Review
. 2023 Apr 5;111(7):936-953.
doi: 10.1016/j.neuron.2023.02.026.

Over and above frequency: Gamma oscillations as units of neural circuit operations

Affiliations
Review

Over and above frequency: Gamma oscillations as units of neural circuit operations

Antonio Fernandez-Ruiz et al. Neuron. .

Abstract

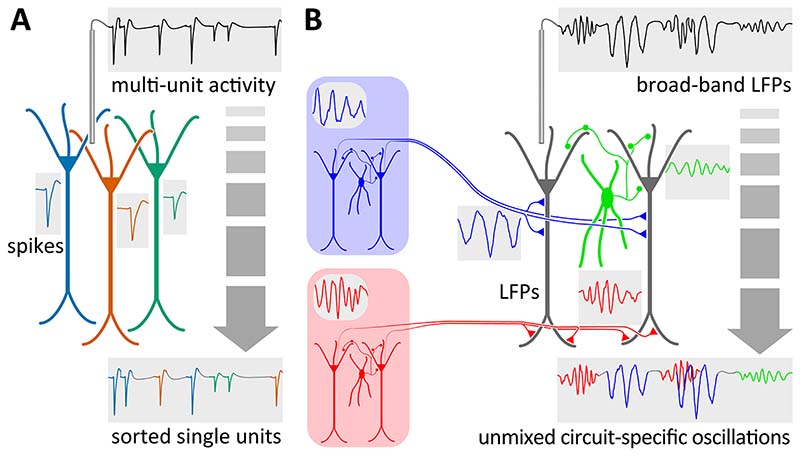
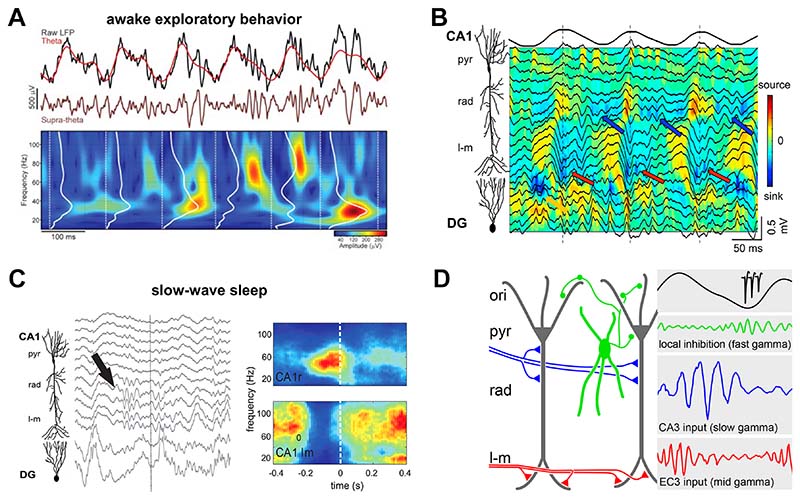
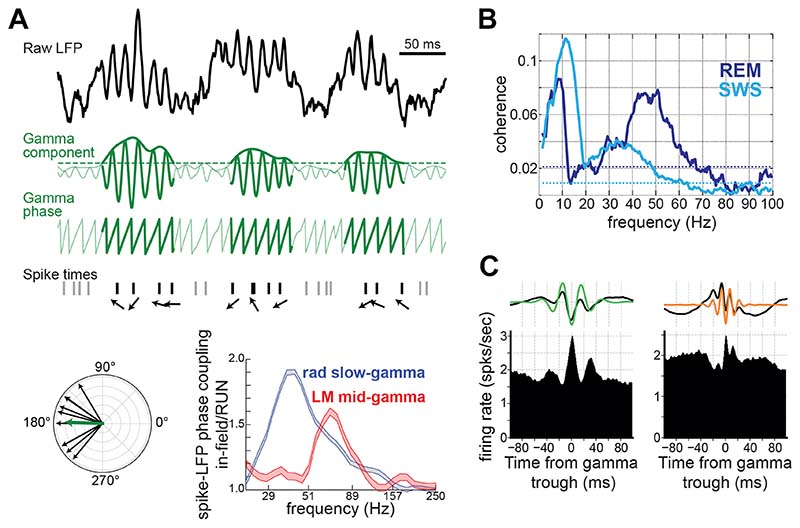
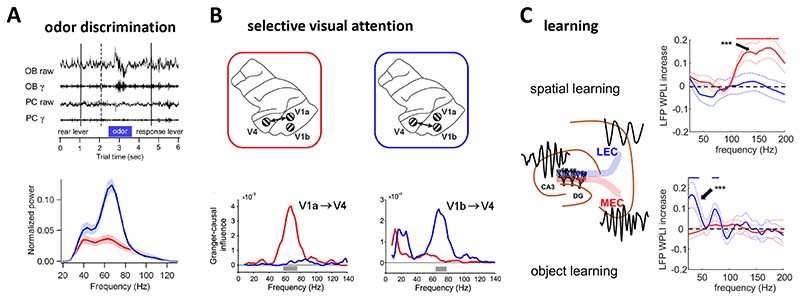
Gamma oscillations (∼30-150 Hz) are widespread correlates of neural circuit functions. These network activity patterns have been described across multiple animal species, brain structures, and behaviors, and are usually identified based on their spectral peak frequency. Yet, despite intensive investigation, whether gamma oscillations implement causal mechanisms of specific brain functions or represent a general dynamic mode of neural circuit operation remains unclear. In this perspective, we review recent advances in the study of gamma oscillations toward a deeper understanding of their cellular mechanisms, neural pathways, and functional roles. We discuss that a given gamma rhythm does not per se implement any specific cognitive function but rather constitutes an activity motif reporting the cellular substrates, communication channels, and computational operations underlying information processing in its generating brain circuit. Accordingly, we propose shifting the attention from a frequency-based to a circuit-level definition of gamma oscillations.


Conflict of interest statement

Declaration of interests The authors declare no competing interests.

Figures

Figure 1
Figure 1. Sorting network gamma oscillations: an analogy with neuron spike sorting.
A) Action potentials discharged by nearby neurons are recorded on the same electrode, resulting in an aggregated signal of multi-unit activity (MUA). Spike sorting relies on sampling of the action potentials by an array of recording sites that allow assigning each action potential to an individual neuron (color-coded single-units), notably using spike waveform features. B) Likewise, multiple oscillations generated by different rhythm-generating circuits project repetitive volleys of synchronous action potentials via axonal pathways to their downstream targets, producing synaptic current-generating sources that sum up in the extracellular space and give rise to the recorded local field potentials (broad-band LFPs). These individual (color-coded) oscillations can then be demixed and assigned to their generating sources and subcellular domains, notably using their spectro-temporal and spatial characteristics.
Figure 2
Figure 2. Diversity of gamma oscillations: example of the hippocampal CA1 region
A) Example of co-occurring theta (top) and gamma (middle) CA1 oscillations (black trace: raw LFPs; color-coded traces: corresponding theta and supra-theta signals) during spatial exploration. Spectrogram at the bottom showing spectral features of hippocampal gamma oscillations. Adapted from . B) Depth profile of hippocampal theta and gamma oscillations (black traces) and underlying current sources (color map) during learning. Blue arrows show slow frequency gamma oscillations in the proximal apical dendrites of CA1 pyramidal cells (stratum radiatum, rad). Red arrows mark mid frequency gamma oscillations in the distal dendrites (stratum lacunosum-moleculare, l-m). Adapted from . C) Left, depth profile of hippocampal LFP traces during slow wave sleep (note slow gamma during down state, arrow); right, average spectrogram for CA1 stratum radiatum (top) and lacunosum-moleculare (bottom) triggered on the entorhinal up state onset. Note similar spectral content of the slow/medium gamma in the dendritic domains innervated by CA3/EC3 to those during theta state. Adapted from . D) Schematic showing that entorhinal cortex layer 3 (EC3) input to distal CA1 apical dendrites elicits mid frequency gamma oscillations (red) at the peak of CA1 pyramidal layer theta (black trace), while CA3 inputs to proximal CA1 apical dendrites elicits slow gamma oscillations (blue) at the descending theta phase. Fast gamma oscillations (green) during theta troughs are generated by a local excitatory-inhibitory circuit motif.
Figure 3
Figure 3. Spiking activity coupling to gamma oscillations
A) Mean vector length method for coupling quantification. Raw LFPs are filtered for the extraction of a gamma signal, which is then used to compute the instantaneous gamma phase. The distribution of the phases sampled by the spike times of a given neuron is next analyzed in a polar plane, where each spike-sampled phase is represented by a vector (phasor) with that corresponding angle. The more consistent is the firing of the neuron, the more concentrated this distribution is around a given mean phase. Thus, the spike-to-phase coupling is quantified as the length of the mean phasor. Non-coupled neurons produce phasors homogenously distributed around the polar plane that cancel out when averaged, whereas phasors obtained for highly coupled neurons stack up, resulting in larger mean vectors. A threshold might be applied to the instantaneous amplitude of gamma to avoid using spikes when the oscillation is not present in the signal, as shown in this figure. Bottom right panel shows coupling strength (relative measure for spikes inside- over outside of place fields) of CA1 place cells calculated for signals in CA1 strata radiatum and lacunosum-moleculare, estimated by ICA (adapted from . Copyright 2010 Society for Neuroscience). B) (Magnitude-Square) Coherence between neocortical LFPs and spike train of a local neuron during REM (darker blue) and slow-wave sleep (lighter blue). These results show how oscillation frequency of the same oscillator, localized near the cell, revealed by spike-LFP coupling, can vary depending on the behavioral state (adapted from ). C) Spike coupling to different gamma oscillations revealed by time-domain analysis. Top panels show CA1 raw and filtered LFP averaged around slow (left) or mid (right) gamma troughs. Bottom panels show firing rate of CA1 principal cells aligned to the same gamma troughs. Importantly, for this analysis a single trough of gamma is taken per theta cycle. Note that instantaneous rates of these cells oscillate around the trough of each gamma paced by its corresponding rhythm (adapted from ).
Figure 4
Figure 4. Behavioural modulation of gamma synchrony
A) Fine odour discrimination is associated with stronger gamma oscillations in the rat olfactory bulb (top: wide-band and gamma filtered LFP traces from rat olfactory bulb and its main target region, the piriform cortex, around the time of odour presentation) compared to coarse odour discrimination (bottom blue and red curves are average power spectra for olfactory bulb responses during fine and coarse odour discrimination respectively; . B) Monkey higher-order visual cortex (V4) displays synchronized gamma oscillations with primary visual cortex (V1) neural population representing behaviourally relevant visual stimulus, but not those linked to irrelevant stimulus . The plots on the bottom indicates directional influence of different areas within V1 on V4 gamma oscillations (as supported by Granger causality) depending on which of two simultaneously presented grating stimuli the monkey was attending to. C) Synchronized fast gamma oscillations appear in the rat dentate gyrus and medial entorhinal cortex during spatial learning (top). However, during object learning, coherent gamma oscillations of slower frequency appear between the dentate gyrus and lateral entorhinal cortex (bottom) . Plots on the right show the increase in LFP-LFP gamma synchrony between rat entorhinal cortical areas and the hippocampal dentate gyrus during different learning tasks as compared to baseline conditions.
Figure 5
Figure 5. Proposed experimental manipulations to study gamma oscillations
High-density recordings in upstream and downstream areas allow recording input patterns (upstream spike trains), input integration (postsynaptic potentials in target neurons) and firing output of target neurons. Such recordings combined with closed-loop optogenetic manipulations allow for the dissection of input-output signal transformation in neural circuits. A gamma pattern (blue trace) generated by a specific synaptic pathway can be optogenetically disrupted (A) or enhanced (B) to probe the function of that pathway. To test the role of the precise timing of spikes for inter-areal communication, optogenetic stimulation of target neurons (gray) can be timed by the phase of gamma oscillations in a projecting area (blue) to increase their synchrony (C). In a similar manner, two connected neuronal populations that normally display gamma coherence can be decoupled by transient inhibition timed by the phase of ongoing gamma oscillations (D). Neurons, oscillations, and spikes are color-coded according to the circuit generating them. Silicon probes and optic fibers are depicted in each region. Blue and yellow trapezoids indicate optogenetic activation and silencing respectively. Vertical black arrows indicate event detection.

Similar articles

Cited by

References

    1. Buzsáki G, Wang X-J. Mechanisms of gamma oscillations. Annu Rev Neurosci. 2012;35:203–225. doi: 10.1146/annurev-neuro-062111-150444. - DOI - PMC - PubMed
    1. Colgin LL, Moser EI. Gamma Oscillations in the Hippocampus. Physiology. 2010;25:319–329. doi: 10.1152/physiol.00021.2010. - DOI - PubMed
    1. Engel AK, Fries P, Singer W. Dynamic predictions: oscillations and synchrony in top-down processing. Nat Rev Neurosci. 2001;2:704–716. doi: 10.1038/35094565. - DOI - PubMed
    1. Fries P. Neuronal gamma-band synchronization as a fundamental process in cortical computation. Annu Rev Neurosci. 2009;32:209–224. doi: 10.1146/annurev.neuro.051508.135603. - DOI - PubMed
    1. Lisman JE, Jensen O. The θ-γ neural code. Neuron. 2013;77:1002–1016. doi: 10.1016/j.neuron.2013.03.007. - DOI - PMC - PubMed

Publication types

LinkOut - more resources