. 2023 Apr 18;4(4):100992.
doi: 10.1016/j.xcrm.2023.100992. Epub 2023 Apr 5.

Treatment effects of soluble guanylate cyclase modulation on diabetic kidney disease at single-cell resolution

Affiliations

Treatment effects of soluble guanylate cyclase modulation on diabetic kidney disease at single-cell resolution

Michael S Balzer et al. Cell Rep Med. .

Abstract

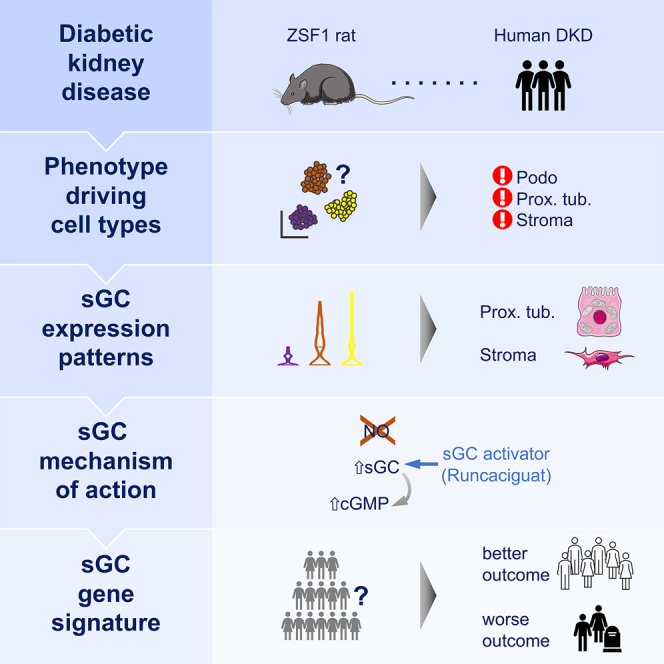
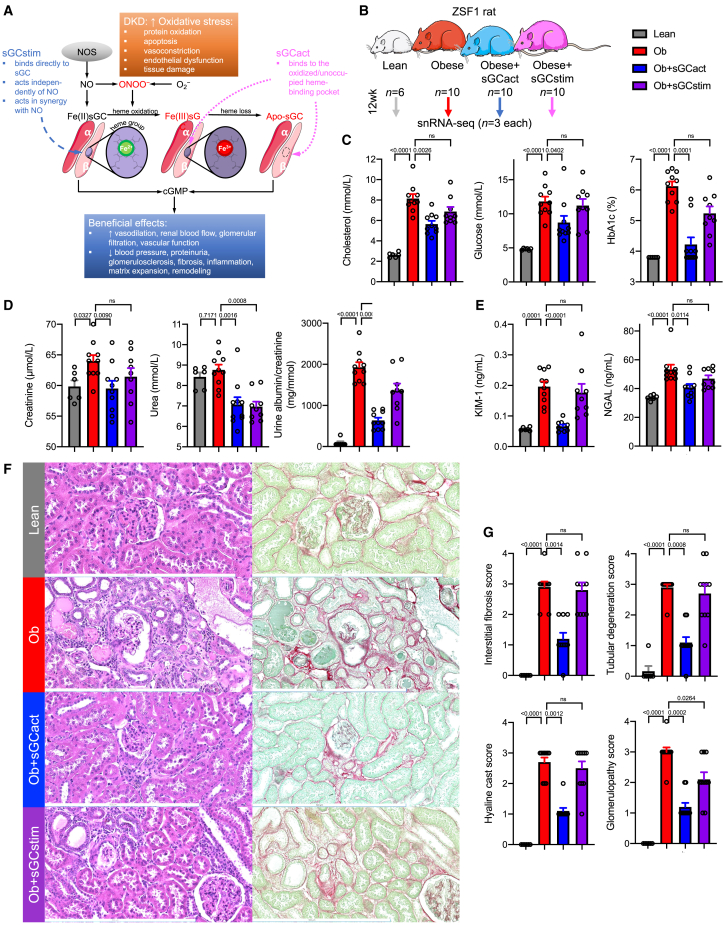
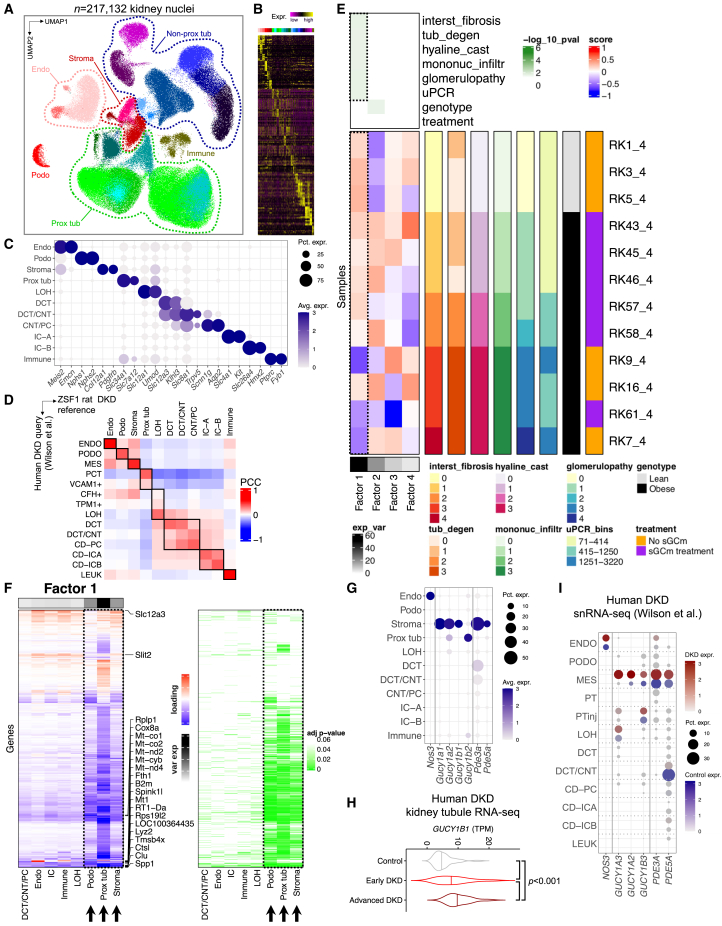
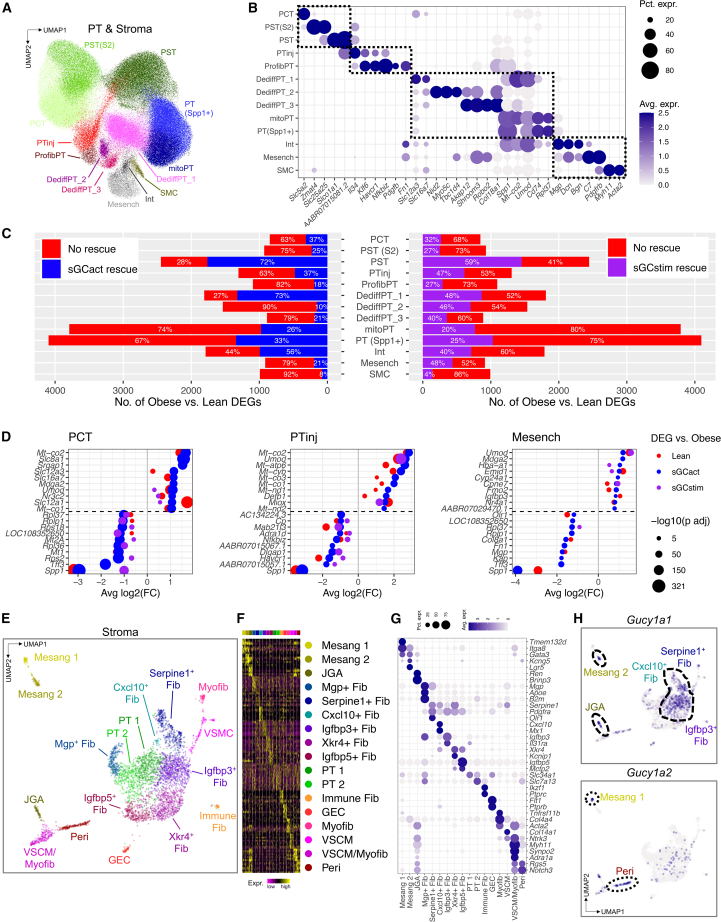
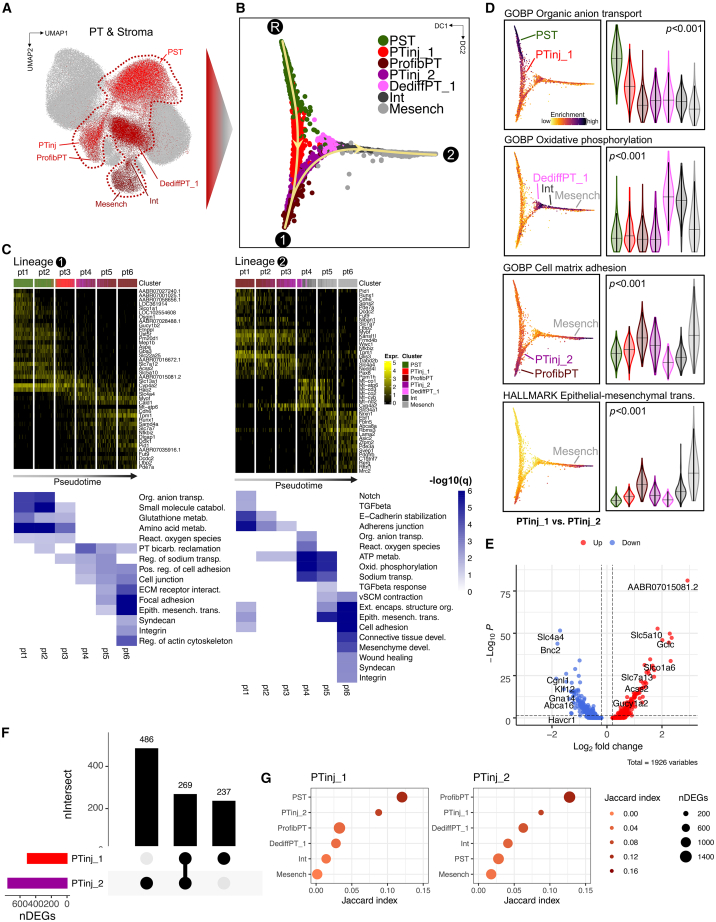
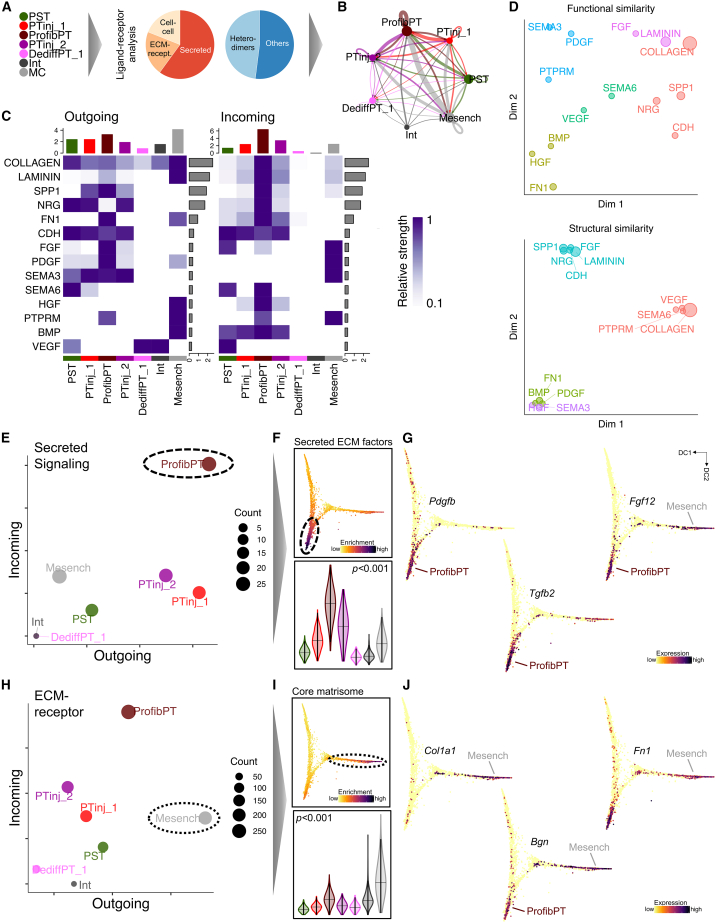
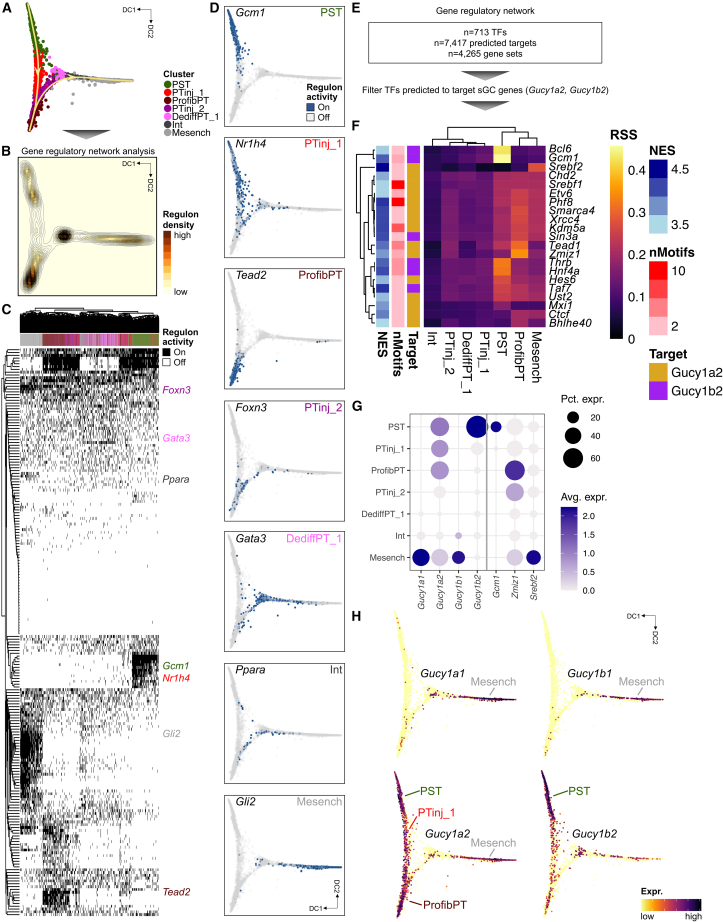
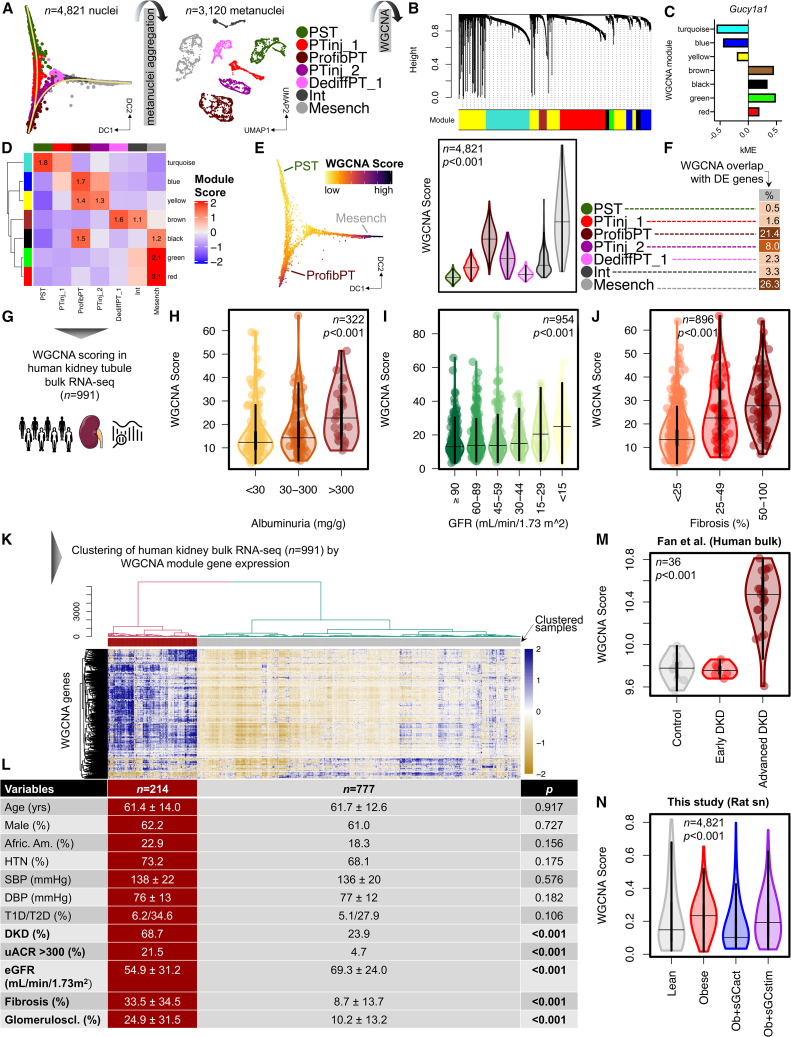
Diabetic kidney disease (DKD) is the most common cause of renal failure. Therapeutics development is hampered by our incomplete understanding of animal models on a cellular level. We show that ZSF1 rats recapitulate human DKD on a phenotypic and transcriptomic level. Tensor decomposition prioritizes proximal tubule (PT) and stroma as phenotype-relevant cell types exhibiting a continuous lineage relationship. As DKD features endothelial dysfunction, oxidative stress, and nitric oxide depletion, soluble guanylate cyclase (sGC) is a promising DKD drug target. sGC expression is specifically enriched in PT and stroma. In ZSF1 rats, pharmacological sGC activation confers considerable benefits over stimulation and is mechanistically related to improved oxidative stress regulation, resulting in enhanced downstream cGMP effects. Finally, we define sGC gene co-expression modules, which allow stratification of human kidney samples by DKD prevalence and disease-relevant measures such as kidney function, proteinuria, and fibrosis, underscoring the relevance of the sGC pathway to patients.

Keywords: CDK; DKD; NO; ZSF1 rat; chronic kidney disease; diabetic kidney disease; gene-regulatory network; nitric oxide; oxidative stress; sGC; single-cell RNA-seq; soluble guanylate cyclase; tensor decomposition; weighted gene correlation network analysis.


Conflict of interest statement

Declaration of interests A.F., J.V., I.M., K. Siudak, F.E., P.S., M.G., and M.P. are employees of Bayer AG. M.S.B. reports consultancy: Boehringer Ingelheim; editorial board membership: Journal of the American Society of Nephrology. K. Susztak reports research support: AstraZeneca, Bayer, Boehringer Ingelheim, Calico, Genentech, Gilead, GSK, Jnana, Lilly, Maze, Merck, Novartis, Novo Nordisk, Regeneron, Variant Bio, and Ventus; advisory board membership: Jnana Therapeutics and Pfizer; consultancy: AstraZeneca, Bayer, GSK, Jnana Therapeutics, Maze, Novo Nordisk, Pfizer, and Ventus; patents: Jag1- and Notch-based targeting of chronic kidney disease; editorial board membership: Cell Metabolism, eBioMedicine, Journal of the American Society of Nephrology, Journal of Clinical Investigation, Kidney International, and Med.

Figures

None
Graphical abstract
Figure 1
Figure 1
Diabetic ZSF1 rats recapitulate phenotypic changes of DKD with marked disease improvement by sGC activators (A) Representation of the importance of heme-containing (native) sGC and heme-free (dysfunctional) form of sGC and its redox equilibrium. sGC stimulator efficacy depends on the ferrous, Fe(II), state of the heme group at the β subunit of sGC, while sGC activators bind directly to oxidized, Fe(III), or heme-free apo form of sGC. Similar to other cardiovascular disorders, DKD is associated with reduced NO bioavailability, increased oxidative stress, and endothelial dysfunction. cGMP, cyclic guanosine monophosphate; DKD, diabetic kidney disease; NO, nitric oxide; NOS, nitric oxide synthase; O2, superoxide; ONOO, peroxynitrite; sGCact, soluble guanylate cyclase activator; sGCstim, soluble guanylate cyclase stimulator. Adapted from Sandner et al. (B) Experimental ZSF1 rat model setup. sGCact, soluble guanylate cyclase activator; sGCstim, sGC stimulator. (C–E) Metabolic (serum cholesterol, glucose, and plasma HbA1c) (C), kidney function (D), and kidney injury markers (E) after 12 study weeks; p values are given for either one-way ANOVA or Kruskal-Wallis test (both Benjamini, Krieger, Yekutieli corrected). Ob, obese; ns, not significant. Color legend as in (B). (F) Histopathology changes in hematoxylin/eosin (left) and Sirius red/fast green (right) stained kidney sections. Scale bars, 500 μm. (G) Histopathology scoring; p values are given for Kruskal-Wallis test (Benjamini, Krieger, Yekutieli corrected). Color legend as in (B).
Figure 2
Figure 2
Single-cell transcriptomic landscape of the diabetic ZSF1 rat (A) Integrated UMAP of 217,132 high-quality nuclei from twelve rat kidney samples; Endo, endothelial cells; Immune, immune cells; Non-prox tub, non-proximal tubule; Podo, podocytes; Prox tub, proximal tubule; Stroma, stromal cells. (B) Heatmap of top ten differentially expressed genes for low-level clustering. (C) Marker gene expression for high-level clustering. Dot size denotes percentage of cells expressing the marker. Color scale represents average gene-expression values. (D) Pearson correlation coefficient (PCC) matrix of average cell type gene expression between ZSF1 rats (lean and obese samples only) and a corresponding human snRNA-seq dataset with control and DKD kidney samples. CD-ICA/IC-A, collecting duct intercalated cell type A; CD-ICB/IC-B, collecting duct intercalated cell type B; CD-PC/PC, collecting duct principal cell; CNT, connecting tubule; DCT, distal convoluted tubule; Endo/ENDO, endothelial cell; LEUK, leukocyte; LOH, loop of Henle; MES, mesangial cells; PCT, proximal convoluted tubule; Podo/PODO, podocytes; Prox tub, proximal tubule. (E) Tensor decomposition analysis heatmap (center left) representing factor loading score of rat kidney (RK) samples (rows) onto tensor factors (rows). Degree of explained variance (exp_var) in the whole dataset is displayed on the bottom left. Significance level (−log10(p value)) of tensor factor association with clinical (uPCR, urinary protein/creatinine ratio in mg/mmol) and histopathology outcome measures (interst_fibrosis, interstitial fibrosis; tub_degen, tubular degeneration; mononuc_infiltr, mononuclear infiltration, glomerulopathy, each scored from 0 to 4) is displayed on the top left. Sample rows are color-annotated by outcome data, genotype (lean vs. obese), and treatment status (sGCm, sGC modulator treatment, or no treatment). (F) Heatmap representing factor 1 loading scores by cell type (columns) and genes (rows) (left). Explained variance is colored in shades of gray (top left), significance levels are shown on the right. The top five significant genes for every cell cluster are annotated. (G) Expression dot plot for NO/sGC/cGAMP pathway genes. Dot size denotes percentage of cells expressing the marker. Color scale represents average gene-expression values. (H) Expression of GUCY1B1 in human microdissected kidney tubule bulk RNA-seq samples, stratified by control, early DKD, and advanced DKD cases; p value is given for one-way ANOVA (Tukey corrected). TPM, transcripts per million. (I) Expression dot plot for NO/sGC/cGAMP pathway genes in a human DKD snRNA-seq dataset. Dot size denotes percentage of cells expressing the marker. Red and blue color scales represent average gene-expression values in DKD and control samples, respectively; PTinj, injured PT (composite of VCAM1+, CFH+, TPM1+ PT cells).
Figure 3
Figure 3
Pharmacological sGC modulation improves gene expression in multiple cell types (A and B) Integrated UMAP (A) and marker gene expression (B) for PT and stromal cell subclusters. PCT, proximal convoluted tubule; PST(S2), proximal straight tubule (segment 2); PST, proximal straight tubule; PTinj, injured PT; ProfibPT, profibrotic PT; DediffPT, dedifferentiated PT; mitoPT, high mitochondrial gene PT; PT(Spp1+), Spp1+ PT; Int, interstitial cell; Mesench, mesenchymal cell; SMC, smooth muscle cell. Dot size (B) denotes percentage of cells expressing the marker. Color scale (B) represents average gene-expression values. (C) Bar graphs representing the number of genes differentially expressed (DEGs) between obese and lean samples in PT and stroma subclusters. Percentages indicate absent or present rescue effect (normalization) for DEG comparison between sGC modulator-treated rats (sGCstim, sGCact) and vehicle-treated rats. (D) Dot plots representing the effect size of DEG normalization by sGCact (blue) and sGCstim (purple) for proximal convoluted tubule (PCT), injured PT (PTinj), and mesenchymal cells (Mesench). The top ten upregulated and top ten downregulated genes are shown. x axis denotes the effect size of DEG rescue/normalization, dot size denotes significance level, color represents the effect of genotype (lean vs. obese) and pharmacological treatment (sGCact, sGCstim vs. obese), respectively. (E–G) UMAP (E), top ten DEGs per cluster (F), and marker gene expression (G) for stromal cell subclusters. Mesang, mesangial cell; JGA, juxtaglomerular apparatus cell; Fib, fibroblast; PT, proximal tubule; GEC, glomerular endothelial cell; Myofib, myofibroblast; VSCM, vascular smooth muscle cell; Peri, pericyte. Dot size (G) denotes percentage of cells expressing the marker. Color scale (G) represents average gene-expression values. (H) Feature plots for Gucy1a1 and Gucy1a2 in UMAP space.
Figure 4
Figure 4
Trajectory analysis highlights dynamic changes of PT cells toward profibrotic and mesenchymal cell states (A and B) Representative healthy and injured PT as well as stroma cell clusters subjected to trajectory analysis in UMAP (A) and diffusion map space (B). R, root state; 1, endpoint of lineage 1; 2, endpoint of lineage 2; PST, proximal straight tubule; PTinj, injured PT; ProfibPT, profibrotic PT; DediffPT, dedifferentiated PT; Int, interstitial cell; Mesench, mesenchymal cell. (C) Top heatmaps showing generalized additive modeling (GAM)-derived DEGs along lineage 1 (R→1) and lineage 2 (1→2). Rows represent DEGs, columns represent individual PT cells in bins along pseudotime. Color legend at the top corresponds to clusters from (B). Bottom heatmaps show corresponding enrichment of top pseudotime-specific GO biological processes and KEGG pathways. (D) Scoring of gene sets corresponding to representative pathways from (C). Left panels show pathway enrichment along the trajectory. Right panels show gene set scores by cell type. p values are given for one-way ANOVA (Tukey corrected); violin colors correspond to cell clusters in (B) along the trajectory. (E) DEGs between PTinj_1 (lineage 1) and PTinj_2 (lineage 2). (F) Upset plot of DEGs for PTinj_1 vs. PTinj_2. (G) Similarity measured by Jaccard index. PTinj_1 was most similar to healthy PST, while PTinj_2 was most similar to ProfibPT. Dot size denotes the number of DEGs, color denotes degree of similarity.
Figure 5
Figure 5
Cell-cell communication analysis identifies a secretory phenotype of profibrotic PT (A) PT-Mesench trajectory clusters from Figure 4 were subjected to ligand-receptor analysis. Cell-cell interactions comprised secreted, ECM-receptor, and direct cell-cell interactions. (B) Weighted total interaction strength. Line size denotes interaction strength, color represents cell clusters from (A). (C) Relative strength of outgoing and incoming interaction signaling is summed up for clusters along the trajectory (columns) as well as summed up and ranked by contributing pathway (rows). (D) Dimension reduction visualizing functional and structural similarity of contributing signaling pathways in all clusters of the trajectory. (E) The number of incoming and outgoing secreted signaling connections indicates the secretory phenotype of ProfibPT. (F) Scoring of gene sets corresponding to secreted ECM factors. Top panel shows pathway enrichment along the trajectory. Bottom panel shows secreted ECM factor scores by cell type. p value is given for one-way ANOVA (Tukey corrected). (G) Feature plots for representative secreted ECM factor genes (Pdgfb, Tgfb2, Fgf12) along the trajectory in diffusion map space. (H) The number of incoming and outgoing ECM-receptor connections indicates the strong matrisome signature of Mesench. (I) Scoring of gene sets corresponding to the core matrisome. Top panel shows pathway enrichment along the trajectory. Bottom panel shows core matrisome scores by cell type. p value is given for one-way ANOVA (Tukey corrected). (J) Feature plots for representative core matrisome genes (Col1a1, Bgn, Fn1) along the trajectory in diffusion map space.
Figure 6
Figure 6
Gene-regulatory network analysis highlights cell-type-specific transcription factors driving the PT-to-mesenchymal trajectory and prioritizes cell types of action for sGC modulation (A) Cell clusters from the PT-Mesench trajectory were subjected to gene-regulatory network (GRN) analysis. (B) Regulon density as a surrogate for stability of regulon states along the trajectory in diffusion map space. (C) Heatmap of cell-type-specific binarized regulon activity. Rows represent regulons of transcription factors (TFs) and their predicted targets, columns represent cells along the trajectory, colored by cell clusters as in (A). Top specific TFs per cluster are annotated. (D) Binarized regulon activity for top cluster-specific TFs along the trajectory in diffusion map space. (E) The GRN dataset was filtered for TFs predicted to target sGC genes (Gucy1a2, Gucy1b2). (F) Heatmap visualizing specificity of regulons (rows) for cell clusters along the trajectory (columns). Color denotes regulon specificity score (RSS). Regulons are color-annotated for normalized enrichment score (NES), number of motifs, and their predicted sGC target gene (Gucy1a2 or Gucy1b2). Top cell-cluster-specific regulons are annotated. (G) Expression dot plot for sGC genes and top cell-cluster-specific TFs from (F). Dot size denotes percentage of cells expressing the marker. Color scale represents average gene-expression values. (H) Feature plots for sGC genes (Gucy1a1, Gucy1a2, Gucy1b1, Gucy1b2) along the trajectory in diffusion map space.
Figure 7
Figure 7
WGCNA-derived sGC co-expression modules correlate with human DKD outcome (A) Metanuclei aggregation of cell clusters from the PT-Mesench trajectory as a prerequisite for performing weighted gene correlation network analysis (WGCNA). (B) Hierarchical cluster tree showing gene co-expression modules identified by WGCNA in cells along the PT-Mesench trajectory revealed seven modules (color-coded). (C) Intramodular connectivity (kME) values show Gucy1a1 as a hub gene for brown, black, green, and red modules. (D) Heatmap demonstrating high specificity of WGCNA modules (rows) for cell clusters along the trajectory (columns). (E) Composite sGC co-expression WGCNA score along the trajectory in diffusion map space (left) and per cell cluster (right). p value is given for one-way ANOVA (Tukey corrected). (F) Percentage overlap of composite sGC co-expression WGCNA genes with cluster-specific DEGs. (G) The composite sGC co-expression WGCNA module gene set was used to score 991 bulk microdissected kidney tubule RNA-seq samples from human individuals with and without DKD. WGCNA scores were then correlated with clinical and histopathology outcome variables. (H–J) WGCNA score in human kidney tubules by degree of albuminuria (H), glomerular filtration rate (GFR) (I), and percentage kidney fibrosis (J). p values are given for one-way ANOVA (Tukey corrected). (K) Dendrogram (top) representing hierarchical clustering of 991 human kidney tubule samples (columns) based on their expression of composite WGCNA module genes (rows) displayed in the corresponding heatmap (below). (L) Clinical and kidney functional and structural outcome characteristics of patients clustered by composite WGCNA module gene expression in (K). p values are given for either Student’s t, Wilcoxon-Mann-Whitney (for continuous variables), or Fisher’s exact test (for categorical variables). HTN, hypertension; SBP, systolic blood pressure; DBP, diastolic blood pressure; T1D/T2D, type 1/type2 diabetes; DKD, diabetic kidney disease; uACR, urinary albumin-to-creatinine ratio; eGFR, estimated glomerular filtration rate. (M and N) WGCNA score in human kidney bulk RNA-seq samples by degree of disease severity (M) as well as in ZSF1 rat kidney cells from the PT-Mesench trajectory by treatment group (N). p values are given for one-way ANOVA (Tukey corrected).

References

    1. Jager K.J., Kovesdy C., Langham R., Rosenberg M., Jha V., Zoccali C. A single number for advocacy and communication-worldwide more than 850 million individuals have kidney diseases. Kidney Int. 2019;96:1048–1050. doi: 10.1016/j.kint.2019.07.012. - DOI - PubMed
    1. U.S. Renal Data System . National Institute of Diabetes and Digestive and Kidney Diseases; Bethesda, MD: 2014. USRDS 2014 Annual Data Report: Atlas of End-Stage Renal Disease in the United States, National Institutes of Health.
    1. Naylor K.L., Kim S.J., McArthur E., Garg A.X., McCallum M.K., Knoll G.A. Mortality in incident maintenance dialysis patients versus incident solid organ cancer patients: a population-based cohort. Am. J. Kidney Dis. 2019;73:765–776. doi: 10.1053/j.ajkd.2018.12.011. - DOI - PubMed
    1. Tervaert T.W.C., Mooyaart A.L., Amann K., Cohen A.H., Cook H.T., Drachenberg C.B., Ferrario F., Fogo A.B., Haas M., de Heer E., et al. Pathologic classification of diabetic nephropathy. J. Am. Soc. Nephrol. 2010;21:556–563. doi: 10.1681/asn.2010010010. - DOI - PubMed
    1. Singh D.K., Winocour P., Farrington K. Oxidative stress in early diabetic nephropathy: fueling the fire. Nat. Rev. Endocrinol. 2011;7:176–184. doi: 10.1038/nrendo.2010.212. - DOI - PubMed

Publication types