. 2023 Apr 5;6(6):e202201767.
doi: 10.26508/lsa.202201767. Print 2023 Jun.

An OMA1 redox site controls mitochondrial homeostasis, sarcoma growth, and immunogenicity

Affiliations

An OMA1 redox site controls mitochondrial homeostasis, sarcoma growth, and immunogenicity

Richard Miallot et al. Life Sci Alliance. .

Abstract

Aggressive tumors often display mitochondrial dysfunction. Upon oxidative stress, mitochondria undergo fission through OMA1-mediated cleavage of the fusion effector OPA1. In yeast, a redox-sensing switch participates in OMA1 activation. 3D modeling of OMA1 comforted the notion that cysteine 403 might participate in a similar sensor in mammalian cells. Using prime editing, we developed a mouse sarcoma cell line in which OMA1 cysteine 403 was mutated in alanine. Mutant cells showed impaired mitochondrial responses to stress including ATP production, reduced fission, resistance to apoptosis, and enhanced mitochondrial DNA release. This mutation prevented tumor development in immunocompetent, but not nude or cDC1 dendritic cell-deficient, mice. These cells prime CD8+ lymphocytes that accumulate in mutant tumors, whereas their depletion delays tumor control. Thus, OMA1 inactivation increased the development of anti-tumor immunity. Patients with complex genomic soft tissue sarcoma showed variations in the level of OMA1 and OPA1 transcripts. High expression of OPA1 in primary tumors was associated with shorter metastasis-free survival after surgery, and low expression of OPA1, with anti-tumor immune signatures. Targeting OMA1 activity may enhance sarcoma immunogenicity.


Conflict of interest statement

The authors declare that they have no conflict of interest.

Figures
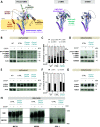
Figure 1.
Figure 1.. C403A mutation alters OMA1 maturation and catalytic activity.
(A) OMA1 model, retrieved from the AlphaFold tool, and representation of the maturation processing of OMA1. OMA1 is a mitochondrial protein with a M48 metalloendopeptidase domain facing the mitochondrial intermembrane space. It probably exists as a homo-oligomeric complex, and the activation mechanism remains incompletely understood (Levytskyy et al, 2017; Alavi, 2021). The cysteine residues of interest are highlighted in pink. OMA1 maturation follows the following steps: the transit peptide in orange, facing the mitochondrial matrix from pre-pro-OMA1, is cleaved between 79L and 80S residues to obtain the pro-OMA1 form. The propeptide in dark green is then cleaved between residues 139Q and 140A and in the C-terminal region after residue 493, in brown. This process requires the AFG3L2 and YMEL1 proteases (Rainbolt et al, 2016; Consolato et al, 2018). The mature long form of OMA1 (L-OMA1) is autocatalytically cleaved into the S-OMA1 form through the cleavage of a second peptide approximately in the region 443–452, in turquoise (Baker et al, 2014; Zhang et al, 2014). (B, C, D, E, F, G) Western blot analysis of OMA1 (B, C, D) and OPA1 (E, F, G) proteins prepared from WT, unedited, and C403A total MCA205 cell (panels B and E) or mitochondrial extracts (panels D and G) exposed for 1 h or not to the uncoupling agent CCCP. Quantification included data obtained from analysis of two WT and four C403A samples (source data), as shown in panels C for OMA1 and F for OPA1 using actin or TOMM20 as control cell or mitochondrial protein (n = 2). Mann–Whitney test; * P < 0.05. (H) BN-PAGE analysis of native proteins prepared from CTRL and C403A cell mitochondrial extracts. MIB and MICOS complex composition was analyzed using anti-MIC60, anti-MIC19, and anti-OPA1 antibodies (n = 2). Source data are available for this figure.
Figure S1.
Figure S1.. Quality control for the production of the OMA1 protein and the edited and control MCA cell lines.
(A) SDS–PAGE stained with Coomassie blue was performed to confirm the presence of purified WT but not mutant OMA1-DsbC protein after elution. (B) Overlay of the AlphaFold-predicted structure of WT and C403A OMA1 proteins. (C) OMA1 enzymatic assay on purified OMA1 WT protein, CTRL, and C403A MCA205 cells evaluated using fluorogenic OPA1 peptide reporter. (D) Scheme of the two-step prime editing method used to obtain the homozygous C403A OMA1–mutated MCA205 cell line, adapted from Anzalone et al (2019). (E) Sequencing profile of genomic DNA reveals the presence of mono- or bi-allelic C403A mutation in the region of interest of OMA1. (F) OMA1 and OPA1 transcript levels in CTRL and C403A cell lines. Actin was used for data normalization. (G) WT, CTRL, or C403A OMA1 cells (1.5 × 10⁵) were seeded and counted 3 d later. (H) Western blot analysis of mitochondrial protein extracts from CTRL and C403A MCA205 cells at different times of CCCP stimulation using OMA1 antibody and TOMM20 as a loading control. (I) BN-PAGE analysis of native proteins prepared from CTRL and C403A mitochondrial extracts. VDAC was used as a loading control on a fraction of mitochondrial lysates. Source data are available for this figure.
Figure 2.
Figure 2.. Evaluation of mitochondrial fitness.
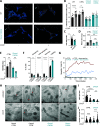
(A) Untreated or CCCP-treated CTRL and C403A MCA205 cells were labeled with mitochondrial depolarization (MDR) (5 µM), and the mitochondrial network was reconstructed by 3D modeling as described in the Materials and Methods section. Yellow and blue dots represent individual mitochondria and network, respectively. Scale bar: 5 µm (n = 2). (B) Mitochondrial fission index was calculated in WT, CTRL, and C403A cells in the presence or the absence of CCCP stimulation (n = 2). Two-way ANOVA Tukey’s multiple comparisons test was performed for statistical analysis (****P < 0.0001 and * P < 0.05). (C) ATP rate index of WT and C403A MCA205 cells was assessed using Seahorse XFp (n = 2). Mann–Whitney test; * P < 0.05. (D) Mitochondrial ROS were evaluated by flow cytometry. Data were represented as the mean fluorescent intensity of the MitoSOX probe on CTRL and C403A clones. Mann–Whitney test; ***P < 0.001 and **P < 0.01. (E) Flow cytometry quantification of MDR and mass (MG) from untreated or CCCP-treated CTRL and C403A cells. The MDR/MG ratio was calculated (n = 5). Mann–Whitney test; **P < 0.01. (F) Flow cytometry evaluation using Annexin V and SYTOX Blue staining of staurosporine-induced CTRL and C403A cell death at 24 h. (G) Quantification of apoptosis by holotomographic microscopy of CTRL and C403 cells after 12-h staurosporine stimulation (n = 2). (H, I, J) EM analysis of CTRL and C403A MCA205 cells. Cells were treated for 1 h with CCCP and fixed for TEM acquisition. Scale bars: 200 nm (n = 2). Quantification was performed on 16 independent fields obtained from CTRL and C403A MCA205 cells. (I) We scored MCS (panel I) per field in untreated or CCCP-treated conditions. (J) Additional analyses were performed to evaluate crista area (panel J). Mann–Whitney test; ****P < 0.0001, ***P < 0.001, and **P < 0.01. Source data are available for this figure.
Figure S2.
Figure S2.. Additional experiments extending the phenotypic characterization of mutant clones.
(A) Untreated or CCCP-treated C403A MCA205 Clone3 and Clone2 cells were labeled with MDR (5 µM), and images from confocal microscope analysis were acquired using Airyscan. The mitochondrial network was reconstructed by 3D modeling using the Imaris technology. Yellow and blue dots represent individual mitochondria and mitochondrial network, respectively. Scale bar: 5 µm (n = 2). (B) Confocal microscopy analysis of CTRL and C403A MCA205 cells stained with anti-TOMM20 antibody (in white) and DAPI (in blue) after 45 min of CCCP stimulation. Images were acquired and processed using the Airyscan technology. Scale bar: 5 µm (n = 10). (C) Basal oxygen consumption rate and extracellular acidification rate analyses by Seahorse of CTRL and C403A cells (n = 2). (D) ATP rate index (i.e., ratio of the mitoATP production rate divided by glycoATP production rate) of CTRL2 and Clone2 C403A MCA205 cells was assessed using Seahorse XFp (n = 2). Mann–Whitney test; * P < 0.05. (E) Flow cytometry quantification of mitochondrial depolarization and mass (MG) from untreated or CCCP-treated CTRL and C403A cells (n = 5). Mann–Whitney test; **P < 0.01. (F) Flow cytometry evaluation using Annexin V and SYTOX Blue staining of bortezomib-induced CTRL and C403A cell death at 24 h. (G) Flow cytometry quantification of the proportion of CTRL and C403A MCA205 dead cells after incubating for 16 h with the proteasome inhibitor bortezomib (BZM) at indicated concentrations. Mann–Whitney test; **P < 0.01. (H) EM analysis of CTRL and C403A MCA205 cells. Cells were treated for 1 h with CCCP and fixed for TEM acquisition. We quantified the number of cristae per cell in untreated or CCCP-treated conditions. Source data are available for this figure.
Figure 3.
Figure 3.. Growth potential of C403A and CTRL tumor cells in vivo.
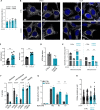
(A) Tumor growth in nude mice. 105 WT and C403A MCA205 cells were subcutaneously grafted in the two flanks of mice, and tumor volume was quantified (n = 10). (B) Western blot analysis of total protein extracts from CD45-negative cells isolated from WT or C403A tumors at day 21 post-cell engraftment. (C) OMA1 and OPA1 expressions were evaluated and quantified in panel (C), as in Fig 2 (n = 4). (D, E) Tumor growth in C57BL/6 mice. 3 × 10⁵ CTRL, 3 × 10⁵ C403A, or a mix of 3 × 10⁵ CTRL and 3 × 10⁵ C403A MCA205 cells were grafted in the two flanks of mice, and tumor volume was quantified (n = 10). Two-way ANOVA with Šídák’s multiple comparisons test; ****P < 0.0001, ***P < 0.001, **P < 0.01, and *P < 0.05. (F) PCR screening to evaluate the proportion of the C403A MCA205 cell in chimera tumors at day 12 and 21 post-cell engraftment (n = 2). Source data are available for this figure.
Figure S3.
Figure S3.. Biochemical and immune phenotyping of mutant clones and tumors.
(A) Western blot analysis of total protein extracts from CD45-negative cells isolated from WT or C403A tumors at day 21 post-cell engraftment. (B) DELE1 expression was evaluated and quantified in panel (B) (n = 4). (C) Western blot analysis of DELE1 in total protein extracts from CTRL and C403A MCA205 cells after different times of oligomycin (20 µM) stimulation. (D) PCR assay discriminating the C403A mutation was used to evaluate the proportion of C403A MCA205 cells at different ratios of CTRL/C403A cells in vitro. (E) Analysis of the immune infiltrate of CTRL or C403A tumors in WT mice at day 12 post-cell engraftment (n = 8–10). Mann–Whitney test; **P < 0.01 and * P < 0.05. Source data are available for this figure.
Figure 4.
Figure 4.. Evaluation of mitochondrial alterations and immune infiltrate in C403A tumors.
(A) Quantification of mitochondrial depolarization and mass by flow cytometry in CD45-negative cells from WT and C403A MCA205 tumors at day 12. Mann–Whitney test; * P < 0.05 and **P < 0.01 (n = 4–5). (B, C) Relative proportion of total ROS production in CTRL and C403A tumors (n = 4) (C). Relative proportion of cytosolic mtDNA (Nd1) by PCR in CD45-negative cells isolated from CTRL and C403A tumors. Mann–Whitney test; **P < 0.01 (n = 5–6). (D) Tumor growth in Xcr1DTA mice. 3 × 10⁵ CTRL or C403A MCA205 cells were subcutaneously grafted in the two flanks of mice, and tumor volume was quantified (n = 8). (E, F) Analysis of the immune infiltrate of CTRL or C403A tumors in WT mice at day 21 post-cell engraftment. Mann–Whitney test; **P < 0.01 and * P < 0.05 (n = 8–10). (G) Tumor growth of C403A tumors in CD8 T cell–depleted mice after day 13 (n = 6). Two-way ANOVA with Šídák’s multiple comparisons test; *P < 0.05. Source data are available for this figure.
Figure 5.
Figure 5.. OMA1 and OPA1 expressions in clinical samples of STS with complex genomics.
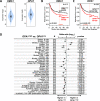
(A) Violin plots showing the distribution of mRNA expression levels of OMA1 and OPA1 in 921 tumor samples. (B, C) Kaplan–Meier MFS curves according to OMA1 and OPA1 expressions. The P-values are for the log-rank test. (D) Correlations between OPA1 expression-based classification and immune variables. Forest plots of correlations between OPA1-high and OPA1-low expressions and immune features including the 24 Bindea’s innate and adaptive immune cell subpopulations, the TIS signature and the TLS signature associated with response to immune checkpoint inhibitors, the ICR score and the cytolytic activity score associated with anti-tumor cytotoxic immune response, and several antigen-processing signatures. The P-values are for the logit link test.

References

    1. Alavi MV (2019) Targeted OMA1 therapies for cancer. Int J Cancer 145: 2330–2341. 10.1002/ijc.32177 - DOI - PubMed
    1. Alavi MV (2021) OMA1—an integral membrane protease? Biochim Biophys Acta Proteins Proteom 1869: 140558. 10.1016/j.bbapap.2020.140558 - DOI - PMC - PubMed
    1. Alavi MV (2022) Recent advances in, and challenges of, designing OMA1 drug screens. Pharmacol Res 176: 106063. 10.1016/j.phrs.2022.106063 - DOI - PMC - PubMed
    1. Amini MA, Karimi J, Khodadadi I, Tavilani H, Talebi SS, Afshar B (2020) Overexpression of ROMO1 and OMA1 are potentially biomarkers and predict unfavorable prognosis in gastric cancer. J Gastrointest Canc 51: 939–946. 10.1007/s12029-019-00330-w - DOI - PubMed
    1. Anzalone AV, Randolph PB, Davis JR, Sousa AA, Koblan LW, Levy JM, Chen PJ, Wilson C, Newby GA, Raguram A, et al. (2019) Search-and-replace genome editing without double-strand breaks or donor DNA. Nature 576: 149–157. 10.1038/s41586-019-1711-4 - DOI - PMC - PubMed

Publication types