. 2023 Jun 8;61(6):2201625.
doi: 10.1183/13993003.01625-2022. Print 2023 Jun.

Wnt7a deficit is associated with dysfunctional angiogenesis in pulmonary arterial hypertension

Affiliations

Wnt7a deficit is associated with dysfunctional angiogenesis in pulmonary arterial hypertension

Ananya Chakraborty et al. Eur Respir J. .

Abstract

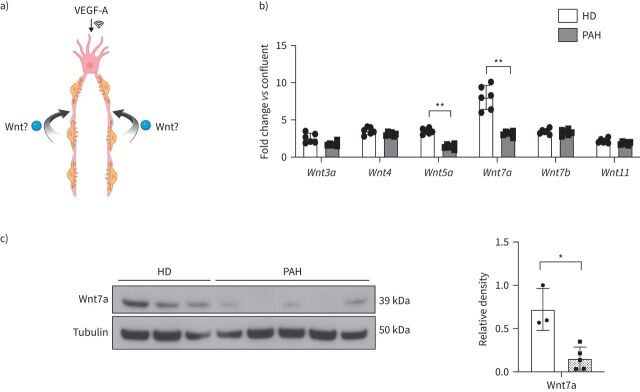
Introduction: Pulmonary arterial hypertension (PAH) is characterised by loss of microvessels. The Wnt pathways control pulmonary angiogenesis but their role in PAH is incompletely understood. We hypothesised that Wnt activation in pulmonary microvascular endothelial cells (PMVECs) is required for pulmonary angiogenesis, and its loss contributes to PAH.

Methods: Lung tissue and PMVECs from healthy and PAH patients were screened for Wnt production. Global and endothelial-specific Wnt7a -/- mice were generated and exposed to chronic hypoxia and Sugen-hypoxia (SuHx).

Results: Healthy PMVECs demonstrated >6-fold Wnt7a expression during angiogenesis that was absent in PAH PMVECs and lungs. Wnt7a expression correlated with the formation of tip cells, a migratory endothelial phenotype critical for angiogenesis. PAH PMVECs demonstrated reduced vascular endothelial growth factor (VEGF)-induced tip cell formation as evidenced by reduced filopodia formation and motility, which was partially rescued by recombinant Wnt7a. We discovered that Wnt7a promotes VEGF signalling by facilitating Y1175 tyrosine phosphorylation in vascular endothelial growth factor receptor 2 (VEGFR2) through receptor tyrosine kinase-like orphan receptor 2 (ROR2), a Wnt-specific receptor. We found that ROR2 knockdown mimics Wnt7a insufficiency and prevents recovery of tip cell formation with Wnt7a stimulation. While there was no difference between wild-type and endothelial-specific Wnt7a -/- mice under either chronic hypoxia or SuHx, global Wnt7a +/- mice in hypoxia demonstrated higher pulmonary pressures and severe right ventricular and lung vascular remodelling. Similar to PAH, Wnt7a +/- PMVECs exhibited an insufficient angiogenic response to VEGF-A that improved with Wnt7a.

Conclusions: Wnt7a promotes VEGF signalling in lung PMVECs and its loss is associated with an insufficient VEGF-A angiogenic response. We propose that Wnt7a deficiency contributes to progressive small vessel loss in PAH.


Conflict of interest statement

Conflict of interest: V.A. de Jesus Perez reports support for the present manuscript from the National Institutes of Health National Heart, Lung, and Blood Institute; and outside the submitted work, holds a leadership position as AHA Chair of Diversity subcommittee. All other authors have nothing to disclose.

Figures

FIGURE 1
FIGURE 1
Wnt7a expression is reduced in pulmonary microvascular endothelial cells (PMVECs) and vascular lesions of pulmonary arterial hypertension (PAH) patients. a) Summary of sprouting angiogenesis and hypothetical role for Wnts. VEGF-A: vascular endothelial growth factor A. b) SYBR Green quantitative PCR analysis for Wnt ligands in the healthy donor (HD) (n=6) and PAH (n=6) PMVECs cultured in semi-confluent versus confluent conditions. The expression of each gene is shown relative to that of confluent cells. **: p<0.005, Mann–Whitney test. c) Western blot of Wnt7a in HD (n=3) and PAH PMVEC (n=5) lysates. Densitometry analysis shows the relative expression of Wnt7a versus tubulin. *: p<0.05, Mann–Whitney test. d) Confocal images of HD (n=3, top) and PAH (n=3, bottom) lung sections stained for endothelial cells (lectin, green) and Wnt7a (red). Arrows point to Wnt7a in the endothelium. Scale bar: 50 µm.
FIGURE 1
FIGURE 1
Wnt7a expression is reduced in pulmonary microvascular endothelial cells (PMVECs) and vascular lesions of pulmonary arterial hypertension (PAH) patients. a) Summary of sprouting angiogenesis and hypothetical role for Wnts. VEGF-A: vascular endothelial growth factor A. b) SYBR Green quantitative PCR analysis for Wnt ligands in the healthy donor (HD) (n=6) and PAH (n=6) PMVECs cultured in semi-confluent versus confluent conditions. The expression of each gene is shown relative to that of confluent cells. **: p<0.005, Mann–Whitney test. c) Western blot of Wnt7a in HD (n=3) and PAH PMVEC (n=5) lysates. Densitometry analysis shows the relative expression of Wnt7a versus tubulin. *: p<0.05, Mann–Whitney test. d) Confocal images of HD (n=3, top) and PAH (n=3, bottom) lung sections stained for endothelial cells (lectin, green) and Wnt7a (red). Arrows point to Wnt7a in the endothelium. Scale bar: 50 µm.
FIGURE 2
FIGURE 2
Loss of Wnt7a is associated with impaired endothelial response to vascular endothelial growth factor A (VEGF-A). a) Cell count proliferation assay of control (n=5) and Wnt7a-specific small interfering RNA (siWnt7a) (n=5) pulmonary microvascular endothelial cells (PMVECs) stimulated with VEGF-A (10 ng·mL−1), Wnt7a (100 ng·mL−1) or both for 24 h. **: p=0.008, multiple Mann­–Whitney test. ##: p=0.01, control baseline versus cells stimulated with VEGF-A+Wnt7a; ###: p=0.0005, control baseline versus control VEGF-A; Kruskal–Wallis test with Dunn's comparison. b) Boyden chamber motility assay of control (n=5) versus siWnt7a (n=5) PMVECs stimulated with VEGF-A (10 ng·mL−1) or VEGF-A+Wnt7a (100 ng·mL−1) for 6 h. The migration index is calculated as the ratio of migrated cells relative to the baseline. *: p=0.008, Mann–Whitney test. #: p=0.0148, control baseline versus control VEGF-A; ##: p=0.009, control baseline versus cells stimulated with VEGF-A+Wnt7a; Kruskal–Wallis test with Dunn's comparison. c, d) Live imaging cell migration assay of control (n=6) and siWnt7a (n=4) PMVECs stimulated with VEGF-A (10 ng·mL−1) or VEGF-A+Wnt7a (100 ng·mL−1) for 24 h. The total distance was calculated using the Image J plugin (NIH). *: p<0.05; **: p=0.009, Kruskal­–Wallis test with Dunn's comparison. e, f) Representative images of Matrigel assay for control and siWnt7a PMVECs stimulated with VEGF-A (10 ng·mL−1) or VEGF-A+Wnt7a (100 ng·mL−1) for 6 h (n=5 per condition). Tube length was measured using Image J. Scale bar: 200 µm. ***: p<0.001, Kruskal–Wallis test with Dunn's comparison. g) Cell count proliferation assay of healthy donor (HD) and pulmonary arterial hypertension (PAH) PMVECs stimulated with VEGF-A (10 ng·mL−1), Wnt7a (100 ng·mL−1) or both for 24 h (n=5 per condition). **: p=0.008, Mann–Whitney test. #: p=0.0243, HD baseline versus control VEGF-A; ##: p=0.0053, HD baseline versus cells stimulated with VEGF-A+Wnt7a; Kruskal–Wallis test with Dunn's comparison. h) Boyden chamber motility assay of HD and PAH PMVECs stimulated with VEGF-A (10 ng·mL−1), Wnt7a (100 ng·mL−1) or both for 6 h (n=5 per condition). The migration index is calculated as the ratio of migrated cells relative to unstimulated. *: p=0.039; **: p=0.007; Mann–Whitney test. #: p=0.0127, HD baseline versus control VEGF-A; ###: p<0.0001, HD baseline versus cells stimulated with VEGF-A+Wnt7a; Kruskal–Wallis test with Dunn's comparison. i, j) Live imaging cell migration assay of HD and PAH PMVECs stimulated with VEGF-A (10 ng·mL−1) or VEGF-A+Wnt7a (100 ng·mL−1) for 24 h (n=5 per condition). The total distance was calculated using the Image J plugin (NIH). **: p<0.01, multiple Mann–Whitney tests. k, l) Representative images of Matrigel assay for HD and PAH PMVECs stimulated with VEGF-A (10 ng·mL−1) or VEGF-A+Wnt7a (100 ng·mL−1) for 6 h (n=5 per condition). Tube length was measured using Image J. Scale bar: 200 µm. **: p<0.01; ***: p<0.001, Kruskal–Wallis test with Dunn's comparison.
FIGURE 2
FIGURE 2
Loss of Wnt7a is associated with impaired endothelial response to vascular endothelial growth factor A (VEGF-A). a) Cell count proliferation assay of control (n=5) and Wnt7a-specific small interfering RNA (siWnt7a) (n=5) pulmonary microvascular endothelial cells (PMVECs) stimulated with VEGF-A (10 ng·mL−1), Wnt7a (100 ng·mL−1) or both for 24 h. **: p=0.008, multiple Mann­–Whitney test. ##: p=0.01, control baseline versus cells stimulated with VEGF-A+Wnt7a; ###: p=0.0005, control baseline versus control VEGF-A; Kruskal–Wallis test with Dunn's comparison. b) Boyden chamber motility assay of control (n=5) versus siWnt7a (n=5) PMVECs stimulated with VEGF-A (10 ng·mL−1) or VEGF-A+Wnt7a (100 ng·mL−1) for 6 h. The migration index is calculated as the ratio of migrated cells relative to the baseline. *: p=0.008, Mann–Whitney test. #: p=0.0148, control baseline versus control VEGF-A; ##: p=0.009, control baseline versus cells stimulated with VEGF-A+Wnt7a; Kruskal–Wallis test with Dunn's comparison. c, d) Live imaging cell migration assay of control (n=6) and siWnt7a (n=4) PMVECs stimulated with VEGF-A (10 ng·mL−1) or VEGF-A+Wnt7a (100 ng·mL−1) for 24 h. The total distance was calculated using the Image J plugin (NIH). *: p<0.05; **: p=0.009, Kruskal­–Wallis test with Dunn's comparison. e, f) Representative images of Matrigel assay for control and siWnt7a PMVECs stimulated with VEGF-A (10 ng·mL−1) or VEGF-A+Wnt7a (100 ng·mL−1) for 6 h (n=5 per condition). Tube length was measured using Image J. Scale bar: 200 µm. ***: p<0.001, Kruskal–Wallis test with Dunn's comparison. g) Cell count proliferation assay of healthy donor (HD) and pulmonary arterial hypertension (PAH) PMVECs stimulated with VEGF-A (10 ng·mL−1), Wnt7a (100 ng·mL−1) or both for 24 h (n=5 per condition). **: p=0.008, Mann–Whitney test. #: p=0.0243, HD baseline versus control VEGF-A; ##: p=0.0053, HD baseline versus cells stimulated with VEGF-A+Wnt7a; Kruskal–Wallis test with Dunn's comparison. h) Boyden chamber motility assay of HD and PAH PMVECs stimulated with VEGF-A (10 ng·mL−1), Wnt7a (100 ng·mL−1) or both for 6 h (n=5 per condition). The migration index is calculated as the ratio of migrated cells relative to unstimulated. *: p=0.039; **: p=0.007; Mann–Whitney test. #: p=0.0127, HD baseline versus control VEGF-A; ###: p<0.0001, HD baseline versus cells stimulated with VEGF-A+Wnt7a; Kruskal–Wallis test with Dunn's comparison. i, j) Live imaging cell migration assay of HD and PAH PMVECs stimulated with VEGF-A (10 ng·mL−1) or VEGF-A+Wnt7a (100 ng·mL−1) for 24 h (n=5 per condition). The total distance was calculated using the Image J plugin (NIH). **: p<0.01, multiple Mann–Whitney tests. k, l) Representative images of Matrigel assay for HD and PAH PMVECs stimulated with VEGF-A (10 ng·mL−1) or VEGF-A+Wnt7a (100 ng·mL−1) for 6 h (n=5 per condition). Tube length was measured using Image J. Scale bar: 200 µm. **: p<0.01; ***: p<0.001, Kruskal–Wallis test with Dunn's comparison.
FIGURE 3
FIGURE 3
Reduced Wnt7a expression is associated with reduced filopodia formation in response to vascular endothelial growth factor A (VEGF-A). a) Filopodia formation in control (n=20) and Wnt7a-specific small interfering RNA (siWnt7a) (n=20) pulmonary microvascular endothelial cells (PMVECs) at baseline and after 1 h of VEGF-A (10 ng·mL−1) stimulation. Arrows point at the filopodia. Actin filaments were visualised using a phalloidin stain (green). Average filopodia length and numbers per cell were measured using Image J. Scale bar: 10 µm. ***: p<0.001, Mann–Whitney test. b) Matrigel filopodia formation assay by control (n=5) and siWnt7a (n=5) PMVECs after 1 h of VEGF-A (10 ng·mL−1) stimulation. Representative scanning electron microscope images of tip cells in Matrigel (right panels) showing densely clustered filopodia in control versus siWnt7a PMVECs. Scale bar: 500 µm. ***: p<0.001, Mann–Whitney test. c) Three-dimensional Cytodex bead assay showing control and siWnt7a PMVECs stimulated with VEGF-A alone or in combination with Wnt7a (n=15–20 per condition). Scale bar: 10 µm. ***: p<0.001, Mann–Whitney test. d) Three-dimensional collagen invasion assay of control versus siWnt7a on gels enriched with VEGF-A or VEGF-A+Wnt7a (n=5 per condition). Broad arrows point at filopodia in tip cells, and thin arrows point at the lumen. Scale bar: 20 µm. **: p=0.0082; ***: p<0.0001; Kruskal–Wallis with Dunn's comparison. e) Matrigel filopodia formation assay by healthy donor (HD) and pulmonary arterial hypertension (PAH) PMVECs after 1 h of VEGF-A (10 ng·mL−1) stimulation (n=5 per condition). Scale bar: 50 µm. *: p<0.05; **: p<0.01; Mann–Whitney test. f) Three-dimensional collagen invasion assay of HD and PAH PMVECs on gels enriched with VEGF-A or VEGF-A+Wnt7a (n=5 per condition). Filopodia length and number were measured using Image J. Scale bar: 40 µm. *: p=0.269; **: p=0.0078; ***: p<0.0001; Kruskal–Wallis with Dunn's comparison.
FIGURE 3
FIGURE 3
Reduced Wnt7a expression is associated with reduced filopodia formation in response to vascular endothelial growth factor A (VEGF-A). a) Filopodia formation in control (n=20) and Wnt7a-specific small interfering RNA (siWnt7a) (n=20) pulmonary microvascular endothelial cells (PMVECs) at baseline and after 1 h of VEGF-A (10 ng·mL−1) stimulation. Arrows point at the filopodia. Actin filaments were visualised using a phalloidin stain (green). Average filopodia length and numbers per cell were measured using Image J. Scale bar: 10 µm. ***: p<0.001, Mann–Whitney test. b) Matrigel filopodia formation assay by control (n=5) and siWnt7a (n=5) PMVECs after 1 h of VEGF-A (10 ng·mL−1) stimulation. Representative scanning electron microscope images of tip cells in Matrigel (right panels) showing densely clustered filopodia in control versus siWnt7a PMVECs. Scale bar: 500 µm. ***: p<0.001, Mann–Whitney test. c) Three-dimensional Cytodex bead assay showing control and siWnt7a PMVECs stimulated with VEGF-A alone or in combination with Wnt7a (n=15–20 per condition). Scale bar: 10 µm. ***: p<0.001, Mann–Whitney test. d) Three-dimensional collagen invasion assay of control versus siWnt7a on gels enriched with VEGF-A or VEGF-A+Wnt7a (n=5 per condition). Broad arrows point at filopodia in tip cells, and thin arrows point at the lumen. Scale bar: 20 µm. **: p=0.0082; ***: p<0.0001; Kruskal–Wallis with Dunn's comparison. e) Matrigel filopodia formation assay by healthy donor (HD) and pulmonary arterial hypertension (PAH) PMVECs after 1 h of VEGF-A (10 ng·mL−1) stimulation (n=5 per condition). Scale bar: 50 µm. *: p<0.05; **: p<0.01; Mann–Whitney test. f) Three-dimensional collagen invasion assay of HD and PAH PMVECs on gels enriched with VEGF-A or VEGF-A+Wnt7a (n=5 per condition). Filopodia length and number were measured using Image J. Scale bar: 40 µm. *: p=0.269; **: p=0.0078; ***: p<0.0001; Kruskal–Wallis with Dunn's comparison.
FIGURE 4
FIGURE 4
Organoid assay reveals differences in sprouting angiogenesis in Wnt7a-specific small interfering RNA (siWnt7a) and pulmonary arterial hypertension (PAH) of pulmonary microvascular endothelial cells (PMVECs). a) Schematic figure of the three-dimensional organoid platform. b, c) Still images of control and siWnt7a (b) and healthy donor (HD) and PAH PMVEC (c) organoids filmed over 10 h. Gels were enriched with vascular endothelial growth factor A (VEGF-A) and VEGF+Wnt7a. Scale bar: 1000 µm. d, e) Maximum sprout numbers for control and siWnt7a (d) and HD and PAH PMVEC (e) organoids. Measurements were carried out using Image J. Experiments were repeated three times per condition. Shown are mean±sem. ***: p<0.001; ****: p<0.0001; one-way ANOVA with Dunnett post hoc test.
FIGURE 4
FIGURE 4
Organoid assay reveals differences in sprouting angiogenesis in Wnt7a-specific small interfering RNA (siWnt7a) and pulmonary arterial hypertension (PAH) of pulmonary microvascular endothelial cells (PMVECs). a) Schematic figure of the three-dimensional organoid platform. b, c) Still images of control and siWnt7a (b) and healthy donor (HD) and PAH PMVEC (c) organoids filmed over 10 h. Gels were enriched with vascular endothelial growth factor A (VEGF-A) and VEGF+Wnt7a. Scale bar: 1000 µm. d, e) Maximum sprout numbers for control and siWnt7a (d) and HD and PAH PMVEC (e) organoids. Measurements were carried out using Image J. Experiments were repeated three times per condition. Shown are mean±sem. ***: p<0.001; ****: p<0.0001; one-way ANOVA with Dunnett post hoc test.
FIGURE 5
FIGURE 5
Vascular endothelial growth factor receptor 2 (VEGFR2) phosphorylation is altered in Wnt7a-deficient and pulmonary arterial hypertension (PAH) pulmonary microvascular endothelial cells (PMVECs) and correlates with reduced receptor tyrosine kinase-like orphan receptor 2 (ROR2) expression. a) Western blot showing expression of total VEGFR2, pY1175-VEGFR2, phospho-p38 (P-p38) and total p38 in control small interfering RNA (siControl) (n=3) versus Wnt7a-specific small interfering RNA (siWnt7a) (n=3) stimulated with vascular endothelial growth factor A (VEGF-A) (10 ng·mL−1) over 1 h. Densitometry analysis was carried for phospho- versus total VEGFR2 and P-p38 versus total p38. **: p<0.01, multiple Mann–Whitney test. b) Western blot showing expression of total and pY1175 VEGFR2 and P-p38 and total p38 in healthy donor (HD) (n=3) and PAH (n=3) PMVECs stimulated with VEGF-A (10 ng·mL−1) over 5 min. **: p<0.01, multiple Mann–Whitney test. c) Diagram of Wnt/planar cell polarity pathway. d) Western blot of active Rac1 and cdc42 in HD PMVECs (n=3) stimulated with Wnt7a (100 ng·mL−1). Densitometry analysis was done against tubulin. **: p<0.01. e) SYBR Green quantitative PCR analysis for Wnt receptors in HD (n=5) and PAH (n=5) PMVECs cultured in semi-confluent versus confluent conditions. The expression of each gene is shown relative to that of confluent cells. The data presented are the result of three independent studies. ***: p=0.002, Mann–Whitney test. f) Western blot of Wnt7a and ROR2 in HD (n=3) and PAH (n=5) PMVEC lysates. Densitometry analysis shows the relative expression of Wnt7a and ROR2 versus tubulin. ***: p=0.004, unpaired t-test. g) Proximity ligation assay of HD PMVECs (n=5 per condition) stimulated with VEGF-A, Wnt7a or both for 1 h. Dots per cell were quantified using Image J. ***: p<0.001 versus VEGF; ###: p<0.001 Wnt7a versus VEGF+Wnt7a; Kruskal–Wallis with Dunn's comparison. h) Representative images of Matrigel assay for control (n=5) and ROR2-specific small interfering RNA (siROR2) (n=5) PMVECs stimulated with VEGF-A (10 ng·mL−1) or VEGF-A+Wnt7a (100 ng·mL−1) for 4 h. Tube length was measured using Image J. Scale bars: 200 µm. **: p<0.01, multiple Mann–Whitney tests. i) Filopodia formation assay in Matrigel by siControl (n=5) and siROR2 (n=5) PMVECs after 1 h of VEGF-A (10 ng·mL−1) stimulation. Filopodia length and number were measured using Image J. Scale bar: 100 µm. ***: p<0.001, Mann–Whitney test. OD: optical density.
FIGURE 5
FIGURE 5
Vascular endothelial growth factor receptor 2 (VEGFR2) phosphorylation is altered in Wnt7a-deficient and pulmonary arterial hypertension (PAH) pulmonary microvascular endothelial cells (PMVECs) and correlates with reduced receptor tyrosine kinase-like orphan receptor 2 (ROR2) expression. a) Western blot showing expression of total VEGFR2, pY1175-VEGFR2, phospho-p38 (P-p38) and total p38 in control small interfering RNA (siControl) (n=3) versus Wnt7a-specific small interfering RNA (siWnt7a) (n=3) stimulated with vascular endothelial growth factor A (VEGF-A) (10 ng·mL−1) over 1 h. Densitometry analysis was carried for phospho- versus total VEGFR2 and P-p38 versus total p38. **: p<0.01, multiple Mann–Whitney test. b) Western blot showing expression of total and pY1175 VEGFR2 and P-p38 and total p38 in healthy donor (HD) (n=3) and PAH (n=3) PMVECs stimulated with VEGF-A (10 ng·mL−1) over 5 min. **: p<0.01, multiple Mann–Whitney test. c) Diagram of Wnt/planar cell polarity pathway. d) Western blot of active Rac1 and cdc42 in HD PMVECs (n=3) stimulated with Wnt7a (100 ng·mL−1). Densitometry analysis was done against tubulin. **: p<0.01. e) SYBR Green quantitative PCR analysis for Wnt receptors in HD (n=5) and PAH (n=5) PMVECs cultured in semi-confluent versus confluent conditions. The expression of each gene is shown relative to that of confluent cells. The data presented are the result of three independent studies. ***: p=0.002, Mann–Whitney test. f) Western blot of Wnt7a and ROR2 in HD (n=3) and PAH (n=5) PMVEC lysates. Densitometry analysis shows the relative expression of Wnt7a and ROR2 versus tubulin. ***: p=0.004, unpaired t-test. g) Proximity ligation assay of HD PMVECs (n=5 per condition) stimulated with VEGF-A, Wnt7a or both for 1 h. Dots per cell were quantified using Image J. ***: p<0.001 versus VEGF; ###: p<0.001 Wnt7a versus VEGF+Wnt7a; Kruskal–Wallis with Dunn's comparison. h) Representative images of Matrigel assay for control (n=5) and ROR2-specific small interfering RNA (siROR2) (n=5) PMVECs stimulated with VEGF-A (10 ng·mL−1) or VEGF-A+Wnt7a (100 ng·mL−1) for 4 h. Tube length was measured using Image J. Scale bars: 200 µm. **: p<0.01, multiple Mann–Whitney tests. i) Filopodia formation assay in Matrigel by siControl (n=5) and siROR2 (n=5) PMVECs after 1 h of VEGF-A (10 ng·mL−1) stimulation. Filopodia length and number were measured using Image J. Scale bar: 100 µm. ***: p<0.001, Mann–Whitney test. OD: optical density.
FIGURE 6
FIGURE 6
Endothelial-specific loss of Wnt7a is not associated with pulmonary hypertension in mice. a) Vascular endothelial-cadherin (PAC)-CreERT2/Wnt7aflox/flox (Wnt7a ECKO) model generation and experimental design for hypoxia and Sugen-hypoxia (SuHx) studies. RV: right ventricular. b–e) Right ventricular systolic pressure (RVSP), Fulton index (weight ratio of the right ventricle to the sum of the left ventricle and septum (RV/(LV+S)), vessel number per 100 alveoli and per cent muscularisation of microvessels in wild-type (WT) versus Wnt7a ECKO mice under normoxia, hypoxia and SuHx (hatched) (n=5–8 per condition). **: p<0.01; ***: p<0.001; one-way ANOVA with Dunnett post hoc test. f, g) Confocal images of WT and Wnt7a ECKO mice in normoxia (f) and hypoxia (g). Arrows indicate perivascular cells expressing Wnt7a. Endothelium (lectin, green), RAGE (AT1 marker, white), Wnt7a (red) and DAPI (blue). Scale bars: 30 µm.
FIGURE 6
FIGURE 6
Endothelial-specific loss of Wnt7a is not associated with pulmonary hypertension in mice. a) Vascular endothelial-cadherin (PAC)-CreERT2/Wnt7aflox/flox (Wnt7a ECKO) model generation and experimental design for hypoxia and Sugen-hypoxia (SuHx) studies. RV: right ventricular. b–e) Right ventricular systolic pressure (RVSP), Fulton index (weight ratio of the right ventricle to the sum of the left ventricle and septum (RV/(LV+S)), vessel number per 100 alveoli and per cent muscularisation of microvessels in wild-type (WT) versus Wnt7a ECKO mice under normoxia, hypoxia and SuHx (hatched) (n=5–8 per condition). **: p<0.01; ***: p<0.001; one-way ANOVA with Dunnett post hoc test. f, g) Confocal images of WT and Wnt7a ECKO mice in normoxia (f) and hypoxia (g). Arrows indicate perivascular cells expressing Wnt7a. Endothelium (lectin, green), RAGE (AT1 marker, white), Wnt7a (red) and DAPI (blue). Scale bars: 30 µm.
FIGURE 7
FIGURE 7
Wnt7a+/– mice develop more severe pulmonary hypertension and vascular remodelling in chronic hypoxia. a) Wnt7a+/– model generation and experimental design for hypoxia studies. RV: right ventricular. b) Western blot of Wnt7a in wild-type (WT) (n=3) and Wnt7a+/– (n=3) lung lysates. Densitometry analysis shows the relative expression of Wnt7a versus total p38. OD: optical density. **: p<0.001, unpaired t-test. c–f) Right ventricular systolic pressure (RVSP), Fulton index (weight ratio of the right ventricle to the sum of the left ventricle and septum (RV/(LV+S)), vessel number per 100 alveoli and per cent muscularisation of microvessels in WT versus Wnt7a+/– mice under normoxia and hypoxia (n=5–7 per condition). *: p<0.05; **: p<0.01; ***: p<0.001; one-way ANOVA with Bonferroni's post hoc test. g) Representative low (upper panels) and high (lower panels) magnification confocal images of lungs of hypoxic WT and Wnt7a+/– mice. Endothelium was labelled for vascular endothelial-cadherin (green), smooth muscle actin (red) and DAPI (blue). Scale bar: 50 µm. h) Representative images of Matrigel assay for WT (n=3) and Wnt7a+/– (n=3) pulmonary microvascular endothelial cells stimulated with vascular endothelial growth factor A (VEGF-A) (10 ng·mL−1) or VEGF-A+Wnt7a (100 ng·mL−1) for 4 h. Tube length was measured using Image J. Scale bars: 100 µm. *: p<0.05; ***: p<0.001; one-way ANOVA with Bonferroni's post hoc test.
FIGURE 7
FIGURE 7
Wnt7a+/– mice develop more severe pulmonary hypertension and vascular remodelling in chronic hypoxia. a) Wnt7a+/– model generation and experimental design for hypoxia studies. RV: right ventricular. b) Western blot of Wnt7a in wild-type (WT) (n=3) and Wnt7a+/– (n=3) lung lysates. Densitometry analysis shows the relative expression of Wnt7a versus total p38. OD: optical density. **: p<0.001, unpaired t-test. c–f) Right ventricular systolic pressure (RVSP), Fulton index (weight ratio of the right ventricle to the sum of the left ventricle and septum (RV/(LV+S)), vessel number per 100 alveoli and per cent muscularisation of microvessels in WT versus Wnt7a+/– mice under normoxia and hypoxia (n=5–7 per condition). *: p<0.05; **: p<0.01; ***: p<0.001; one-way ANOVA with Bonferroni's post hoc test. g) Representative low (upper panels) and high (lower panels) magnification confocal images of lungs of hypoxic WT and Wnt7a+/– mice. Endothelium was labelled for vascular endothelial-cadherin (green), smooth muscle actin (red) and DAPI (blue). Scale bar: 50 µm. h) Representative images of Matrigel assay for WT (n=3) and Wnt7a+/– (n=3) pulmonary microvascular endothelial cells stimulated with vascular endothelial growth factor A (VEGF-A) (10 ng·mL−1) or VEGF-A+Wnt7a (100 ng·mL−1) for 4 h. Tube length was measured using Image J. Scale bars: 100 µm. *: p<0.05; ***: p<0.001; one-way ANOVA with Bonferroni's post hoc test.
FIGURE 8
FIGURE 8
Proposed model. In healthy conditions, Wnt7a primes vascular endothelial growth factor receptor 2 (VEGFR2) phosphorylation via receptor tyrosine kinase-like orphan receptor 2 (ROR2) and activates Rac1/cdc42 to trigger cytoskeletal changes and actin filament formation. Sprouting angiogenesis occurs after tip cell formation, and vascular repair are completed. Reduced expression of Wnt7a lowers VEGFR2 activity, resulting in reduced tip cell formation and inability to initiate sprouting angiogenesis. PAH: pulmonary arterial hypertension.

Comment in

References

    1. Galiè N, Humbert M, Vachiery JL, et al. . 2015 ESC/ERS guidelines for the diagnosis and treatment of pulmonary hypertension. Rev Esp Cardiol 2016: 69: 177. - PubMed
    1. de Jesus Perez VA, Yuan K, Orcholski ME, et al. . Loss of adenomatous poliposis coli-α3 integrin interaction promotes endothelial apoptosis in mice and humans. Circ Res 2012; 111: 1551–1564. doi:10.1161/CIRCRESAHA.112.267849 - DOI - PMC - PubMed
    1. Adams RH, Alitalo K. Molecular regulation of angiogenesis and lymphangiogenesis. Nat Rev Mol Cell Biol 2007; 8: 464–478. doi:10.1038/nrm2183 - DOI - PubMed
    1. de Jesus Perez VA, Yuan K, Lyuksyutova MA, et al. . Whole-exome sequencing reveals TopBP1 as a novel gene in idiopathic pulmonary arterial hypertension. Am J Respir Crit Care Med 2014; 189: 1260–1272. doi:10.1164/rccm.201310-1749OC - DOI - PMC - PubMed
    1. Eyries M, Montani D, Girerd B, et al. . Familial pulmonary arterial hypertension by KDR heterozygous loss of function. Eur Respir J 2020; 55: 1902165. doi:10.1183/13993003.02165-2019 - DOI - PubMed

Publication types

MeSH terms

Substances