. 2023 Apr 6;14(1):1914.
doi: 10.1038/s41467-023-37425-9.

TREM2+ and interstitial-like macrophages orchestrate airway inflammation in SARS-CoV-2 infection in rhesus macaques

Affiliations

TREM2+ and interstitial-like macrophages orchestrate airway inflammation in SARS-CoV-2 infection in rhesus macaques

Amit A Upadhyay et al. Nat Commun. .

Abstract

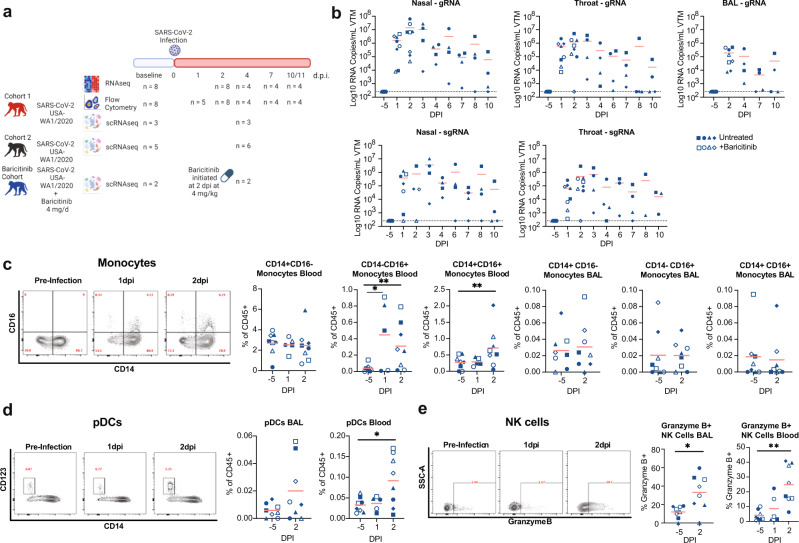
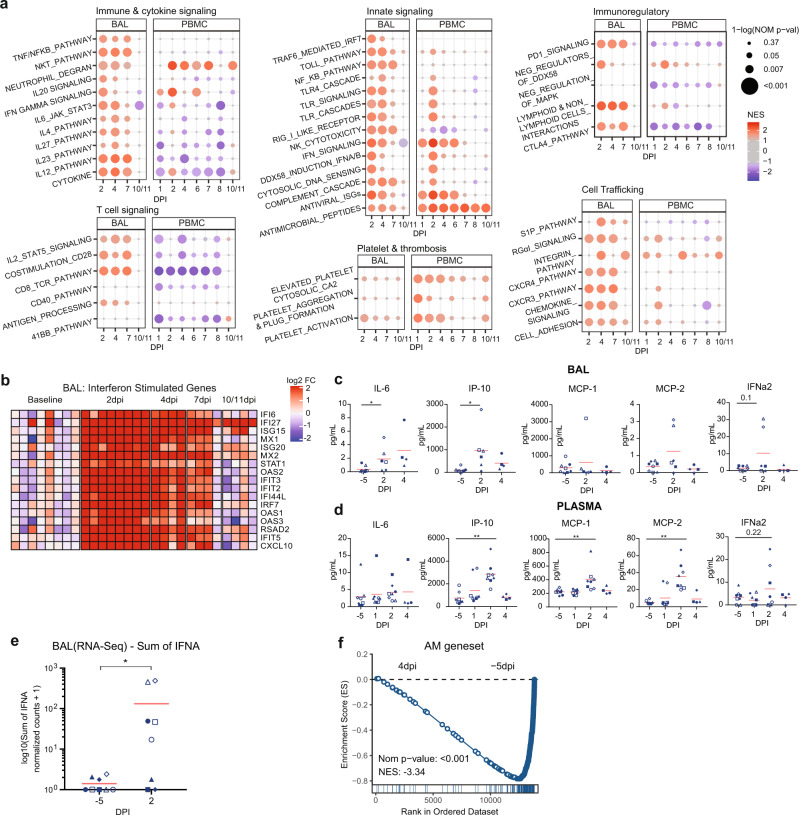
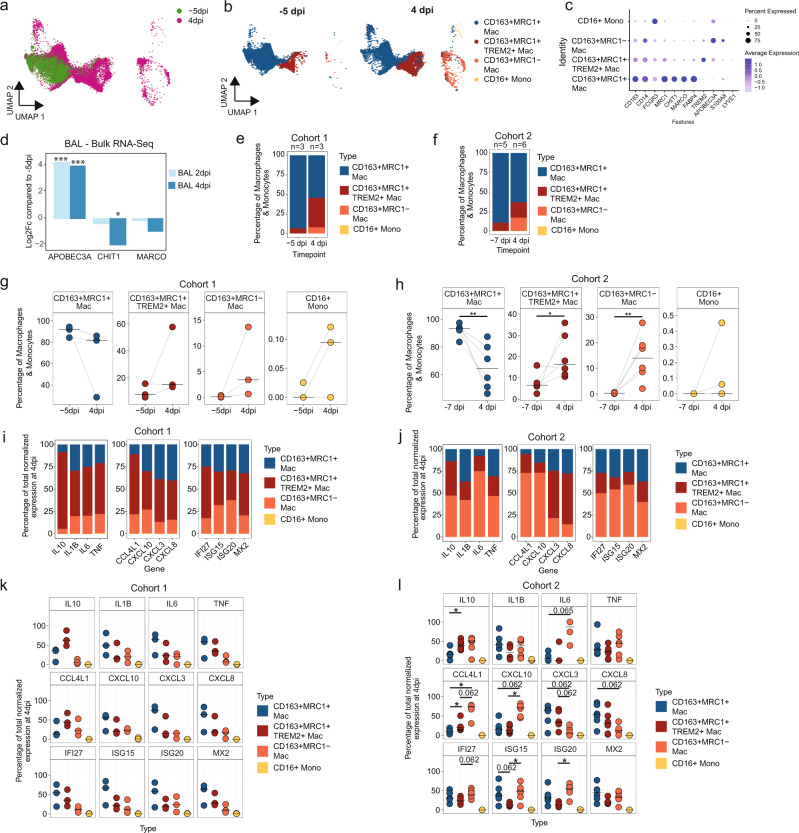
The immunopathological mechanisms driving the development of severe COVID-19 remain poorly defined. Here, we utilize a rhesus macaque model of acute SARS-CoV-2 infection to delineate perturbations in the innate immune system. SARS-CoV-2 initiates a rapid infiltration of plasmacytoid dendritic cells into the lower airway, commensurate with IFNA production, natural killer cell activation, and a significant increase of blood CD14-CD16+ monocytes. To dissect the contribution of lung myeloid subsets to airway inflammation, we generate a longitudinal scRNA-Seq dataset of airway cells, and map these subsets to corresponding populations in the human lung. SARS-CoV-2 infection elicits a rapid recruitment of two macrophage subsets: CD163+MRC1-, and TREM2+ populations that are the predominant source of inflammatory cytokines. Treatment with baricitinib (Olumiant®), a JAK1/2 inhibitor is effective in eliminating the influx of non-alveolar macrophages, with a reduction of inflammatory cytokines. This study delineates the major lung macrophage subsets driving airway inflammation during SARS-CoV-2 infection.


Conflict of interest statement

R.F.S. has served in the past as an unpaid consultant for Eli Lilly whose drugs are being evaluated in the research described in this paper, and owns shares in Eli Lilly. He also receives royalties from the sales of Baricitinib for COVID-19 in the US and Mexico. The terms of this arrangement have been reviewed and approved by Emory University in accordance with its conflict of interest policies. All other authors do not have any conflicts to declare.

Figures

Fig. 1
Fig. 1. Early expansion of inflammatory cells in the blood following infection with SARS-CoV-2.
a Study design; RMs were infected intranasally and intratracheally with SARS-CoV-2 and tracked longitudinally (Cohort 1: n = 4, baricitnib cohort: n = 4, Cohort 2: n = 6). Baricitinib was administered daily to 4 RMs (baricitinib cohort) starting at 2 dpi. The 4 RMs  from Cohort 1 and 6 RMs from Cohort 2 were untreated. (Created with BioRender.com). b After SARS-CoV-2 inoculation, nasal, throat, and bronchoalveolar lavages (BAL) were collected and viral loads were quantified by qRT-PCR for total gRNA and sgRNA. c Longitudinal levels of monocytes within BAL and blood depicted as a % of CD45+ cells. p values: CD14−CD16+ Monocytes Blood: 1 dpi vs. −5 dpi = 0.03 and 2 dpi vs. −5 dpi = 0.004; CD14+CD16+ Monocytes Blood 2 dpi vs. −5 dpi = 0.004. d Longitudinal levels of plasmacytoid dendritic cells (pDCs) within BAL and blood depicted as a percentage of CD45+ cells. p value for pDCs Blood 2 dpi vs. −5 dpi = 0.02. e Longitudinal levels of NK cells expressing Granzyme B in BAL and blood. p values for Granzyme B+ NK Cells 2 dpi vs. −5 dpi BAL = 0.01 and blood = 0.008. n = 8 RM from Cohort 1 and baricitinib cohort. The red bars represent the mean. Statistical analysis was performed using one-tailed Wilcoxon signed-rank test in Graphpad Prism v7.02 comparing each timepoint to −5 dpi. *p value <0.05, **p value <0.01. Source data (be) are provided as a Source Data file.
Fig. 2
Fig. 2. Early pro-inflammatory and ISG response observed in airways and peripheral blood by bulk transcriptomics.
n = 8 RM from Cohort 1 and baricitinib cohort for −5 dpi and 2 dpi except for (c) where n = 6 (3 RM Cohort 1 + 3 RM baricitnib cohort) at 2 dpi. n = 4 RM from Cohort 1 starting from 4 dpi. a Dot plots showing normalized enrichment scores and nominal p values for gene sets. Enrichment is indicated by dot color (red: positively enriched vs. −5 dpi; blue: negatively enriched), dot size indicates significance. Normalized enrichment scores and nominal p values were determined using GSEA. The exact nominal p values are included in Supplementary Data 1. b Heatmap of longitudinal responses for the ISG gene set. The color scale indicates log2 expression relative to the median of the −5 dpi samples. c Cytokines evaluation (Mesoscale) in BALF p values for 2 dpi vs. −5 dpi: IL6 = 0.02 and IP-10 = 0.03 and d Plasma; only significant cytokines are shown (p values for 2 dpi vs. −5 dpi: IP-10 = 0.008, MCP-1 = 0.008, MCP-2 = 0.004). e Sum of normalized expression of all IFNA genes in BAL. *p value = 0.04. f GSEA enrichment plot showing negative enrichment for AM gene signature (derived from SingleR) when comparing bulk BAL RNA-Seq samples from 4 dpi to −5 dpi (Nominal p value = 0). The red bar represents the mean. Statistical analysis for (c)–(e) was performed using one-tailed Wilcoxon signed-rank test in R v4.2.2 comparing each timepoint to −5 dpi. *p value <0.05, **p value <0.01. Source data (ce) are provided as a Source Data file.
Fig. 3
Fig. 3. Influx of pro-inflammatory macrophages in BAL.
a Projection of single-cell macrophages/monocytes from −5 dpi (green) and 4 dpi (magenta) 10X BAL samples obtained from three SARS-CoV-2 infected rhesus macaques (Cohort 1) onto the reference UMAP of lung macrophage/monocytes from uninfected rhesus macaques (NCBI GEO: GSE149758). b UMAP projections showing the predicted cell type annotations based on the uninfected lung reference split by time of sample collection (Cohort 1). c DotPlots showing the expression of marker genes for the different macrophage/monocyte subsets in SARS-CoV-2 infected BAL samples (Cohort 1). d Log2 fold-changes compared to −5 dpi for APOBEC3A, CHIT1 and MARCO in bulk BAL RNA-Seq data (Cohort 1). Significance was determined using DESeq2. The p values corrected by the default Benjamini and Hochberg method were used *adj p value <0.05, ***adj p value <0.001. The exact p values are included in Supplementary Data 2. Percentage of a given subset out of all macrophage/monocyte subsets at −5 dpi and 4 dpi from all three animals pooled (Cohort 1) (e) and at −7 dpi and 4 dpi from all six animals pooled (Cohort 2) (f). Percentage of a given subset out of all macrophage/monocyte subsets for each animal at −5 dpi and 4 dpi from Cohort 1 (n = 3) (g) and at −7 dpi (n = 5) and 4 dpi (n = 6) for Cohort 2 (h). The black lines indicate the median. p values for Cohort 2 (f) for 4 dpi vs. −7 dpi: CD163+MRC1+ = 0.009, CD163+MRC1+TREM2+ = 0.03, and CD163+MRC1− = 0.004. Contribution of each macrophage/monocyte subset toward the production of the pro-inflammatory genes and ISG—Cohort 1 pooled (i), Cohort 2 pooled (j), Cohort 1 individual (k) and Cohort 2 individual (l). p values for (l): * = 0.03. The percentage contribution was calculated by dividing the sum of normalized expression of a given gene in a macrophage/monocyte subset by the sum of the normalized expression of the gene in all macrophage/monocyte subsets. ac, e, g, i, k Cohort 1: n = 3 for both −5 dpi and 4 dpi, d Cohort 1: n = 8 for 2 dpi and n = 4 for 4 dpi, f, h, j, l Cohort 2: n = 5 for −7 dpi and n = 6 for 4 dpi. The black lines indicate the median. Statistical analysis was performed using two-tailed Wilcoxon singed rank test for (g, k, l) and two-tailed Mann–Whitney U test for (h) in R v4.2.2. *p value <0.05, **p value <0.01. Source data (dl) are provided as a Source Data file.
Fig. 4
Fig. 4. Comparison of rhesus and human macrophage subsets.
a UMAP of macrophage subsets in lungs from six healthy human donors (GEO: GSE135893). b UMAP of macrophage subsets in lungs from three healthy rhesus macaques (GEO: GSE149758). c DotPlots showing the expression of marker genes. The color gradient represents the level of expression and the size of the dot represents the percentage of cells expressing a given gene. d UMAP of BAL samples from human donors that are healthy (n = 3), or suffering from moderate (n = 3) or severe (n = 6) COVID-19 (GEO: GSE145926) mapped to the healthy lung reference using the Seurat MapQuery function. e Percent of predicted cell types out of all macrophage/monocytes in each human BAL sample. The black bar indicates the median. Statistical analysis was performed using pairwise two-tailed Mann–Whitney U test in R v4.2.2. p value * = 0.02. Contribution of each predicted macrophage/monocyte subsets in human BAL toward the production of the pro-inflammatory genes and ISG—pooled (f) and individual (g). The percentage contribution was calculated by dividing the sum of normalized expression of a given gene in a macrophage/monocyte subset by the sum of the normalized expression of the gene in all macrophage/monocyte subsets. The black bars represent the median. Statistical analysis was performed using two-tailed Wilcoxon signed rank test in R v4.2.2. *p value 0.03 for all except FABP4 vs. Proliferating for IL6, IL1B, TNF, CXCL3, CXCL8 and SPP1hi vs. Proliferating for CCR2: p value = 0.04. Source data (eg) are provided as a Source Data file.
Fig. 5
Fig. 5. Baricitinib reduced the influx of pro-inflammatory macrophages in addition to the pro-inflammatory gene expression profile.
a Projection of macrophages/monocytes from −5 dpi and 4 dpi 10X BAL samples from three untreated and two baricitinib-treated rhesus macaques on the reference UMAP of uninfected lung macrophages/monocytes (NCBI GEO: GSE149758). b UMAP split by treatment and timepoint showing predicted cell annotations based on mapping to the reference lung macrophages/monocytes. Percentage of a given macrophage/monocyte subset of all the macrophages/monocytes in the BAL samples—pooled (c) and individual (d). Violin plots showing expression of pro-inflammatory cytokines (e), chemokines (f) and ISG (g) in the different macrophage/monocyte subsets in BAL 10X samples from baricitinib-treated and untreated samples. h Absolute number of pDC in BAL samples from scRNA-Seq and i Percentage of pDC out of all cells in the BAL samples from scRNA-Seq. Source data (c, d, h, i) are provided as a Source Data file.

Update of

References

    1. Zhou P, et al. A pneumonia outbreak associated with a new coronavirus of probable bat origin. Nature. 2020;579:270–273. doi: 10.1038/s41586-020-2012-7. - DOI - PMC - PubMed
    1. Zhu N, et al. A novel coronavirus from patients with pneumonia in China, 2019. N. Engl. J. Med. 2020;382:727–733. doi: 10.1056/NEJMoa2001017. - DOI - PMC - PubMed
    1. Baden, L. R. et al. Efficacy and safety of the mRNA-1273 SARS-CoV-2 vaccine. N. Engl. J. Med.10.1056/nejmoa2035389 (2020). - PMC - PubMed
    1. Mulligan MJ, et al. Phase I/II study of COVID-19 RNA vaccine BNT162b1 in adults. Nature. 2020;586:589–593. doi: 10.1038/s41586-020-2639-4. - DOI - PubMed
    1. Polack FP, et al. Safety and efficacy of the BNT162b2 mRNA Covid-19 vaccine. N. Engl. J. Med. 2020;383:2603–2615. doi: 10.1056/NEJMoa2034577. - DOI - PMC - PubMed

Publication types

LinkOut - more resources