. 2023 Apr 6;14(1):1920.
doi: 10.1038/s41467-023-36795-4.

Distributed processing for value-based choice by prelimbic circuits targeting anterior-posterior dorsal striatal subregions in male mice

Affiliations

Distributed processing for value-based choice by prelimbic circuits targeting anterior-posterior dorsal striatal subregions in male mice

Kyuhyun Choi et al. Nat Commun. .

Abstract

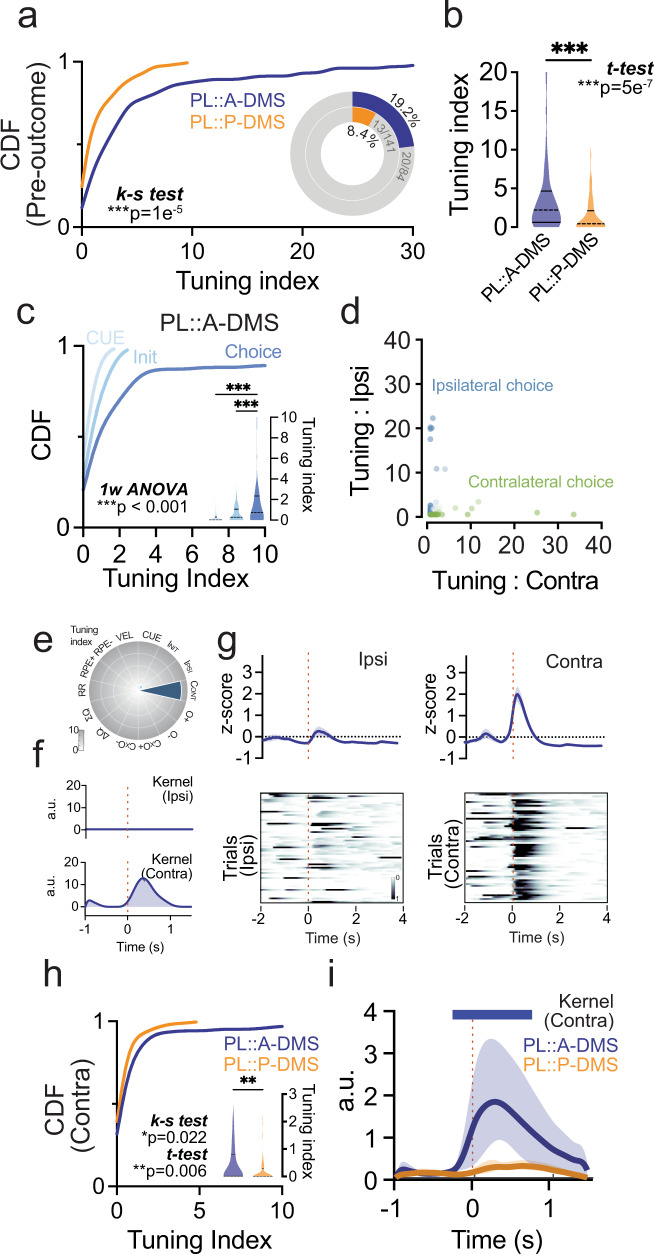
Fronto-striatal circuits have been implicated in cognitive control of behavioral output for social and appetitive rewards. The functional diversity of prefrontal cortical populations is strongly dependent on their synaptic targets, with control of motor output mediated by connectivity to dorsal striatum. Despite evidence for functional diversity along the anterior-posterior striatal axis, it is unclear how distinct fronto-striatal sub-circuits support value-based choice. Here we found segregated prefrontal populations defined by anterior/posterior dorsomedial striatal target. During a feedback-based 2-alternative choice task, single-photon imaging revealed circuit-specific representations of task-relevant information with prelimbic neurons targeting anterior DMS (PL::A-DMS) robustly modulated during choices and negative outcomes, while prelimbic neurons targeting posterior DMS (PL::P-DMS) encoded internal representations of value and positive outcomes contingent on prior choice. Consistent with this distributed coding, optogenetic inhibition of PL::A-DMS circuits strongly impacted choice monitoring and responses to negative outcomes while inhibition of PL::P-DMS impaired task engagement and strategies following positive outcomes. Together our data uncover PL populations engaged in distributed processing for value-based choice.


Conflict of interest statement

The authors declare no competing interests.

Figures

Fig. 1
Fig. 1. Distinct PL neuron populations defined by anterior/posterior dorsomedial striatal (DMS) target.
a Approach for anterograde tracing of PL-DMS excitatory projections with synaptic terminal marker Synaptophysin-mRuby (inset shows GFP-Cre expression at PL target site, scale bar, 1000μm, n = 4 animals). b Averaged fluorescent intensity of Synaptophysin-mRuby inputs from PL along anterior-posterior axis, superimposed onto striatum in brain atlas (top: A-DMS, bottom: P-DMS, left to right increasingly posterior, n = 4 animals). Top number denotes A/P coordinates from bregma (mm). c Schematic demonstrating dual retrograde tracing strategy using trans-synaptic rabies virus (A-DMS; yellow) and Alexa647-conjugated CTB (P-DMS; magenta). d Coronal sections showing injection sites (top: A-DMS, Bottom: P-DMS, n = 5 animals). scale bar, 1000 μm. Number in upper right corner denotes A/P coordinate from bregma. e Representative image of medial prefrontal cortex (top) and quantification (kernel density estimate) of neuronal density from the pia (bottom, n = 4 animals), with relative proportion of overlapping double-labeled neurons (inset). scale bar, 100 μm. f Example image showing prelimbic area from EnvA-∆G-rabies virus tracing of A-DMS inputs (top) co-stained with CTIP2 (bottom, n = 3 animals). Scale bar 100 μm. g Quantification of neuronal density from pia of PL::A-DMS and CTIP2+ populations (n = 3 animals). Solid line, mean; shaded area, ± SEM. h Quantification of neuronal density from pia of PL::P-DMS and CTIP2 + populations (n = 3 animals). Pink line in g, h represents average layer III-V transition as visualized by increased density of CTIP2 + neurons in layer V. Solid line, mean; shaded area, ± SEM. i) Fraction(mean ± SEM) of GFP labeled neurons located in CTIP2 + deep cortical layers (p = 0.54, n = 3/3 animals, Two-sided unpaired t-test).
Fig. 2
Fig. 2. Characterizing afferent drivers and local striatal connectivity of PL::A/P-DMS circuits.
a Schematic of experiment to examine local connectivity of PL::DMS using channelrhodopsin variant (ChiEF; PL) and cell type marker (DO/DIO-GFP/tdTomato; A and P-DMS) in Adora2a-Cre mice. (Insets show viral expression at 3 representative target sites, scale bar, 1000 μm). (Top-right) Schematic of synaptic wiring between PL::DMS. b, c Average amplitude (mean ± SEM) of direct excitatory synaptic current (top-left), Excitatory/Inhibitory ratio (bottom-left, mean ± SEM) depends on target DMS area and cell type. Representative traces from each group (right). Black trace, monosynaptic excitatory current; red trace, feed-forward inhibitory current. Šidák multiple comparison test, *p < 0.05, **p < 0.01, ***p < 0.001. (A-DMS[D1]/A-DMS[D2]/P-DMS[D1]/P-DMS[D2] n =  12/10/10/9 cells from five independent animals). d Schematic of tracing approach to label 2nd order projections to PL circuits defined by DMS target. RetroAAV2-EF1a::Cre virus was injected into either A/P-DMS with Cre-sensitive TVA receptor and Rabies virus glycoprotein injected separately into PL, followed by EnvA pseudo typed-∆G-Rabies virus one week later. e Brain-wide innervation preferences of PL::A/P DMS pathways. Abscissa shows relative proportion (out of total labeled neurons) for each brain region and ordinate shows the ratio between pathways (PL::P-DMS/PL::A-DMS). Green and blue circles represent ipsilateral and contralateral sites relative to injection. *p < 0.05, **p < 0.01. f Comparison of second-order innervation (mean ± SEM) from major afferent brain areas (ORBcontra p = 0.0406; ACAvipsi p = 0.008; RSPcontra p = 0.010, RSPipsi p =0.008; MOsipsi p = 0.0497; VISipsi p = 0.023; n = 3/3 animals/each group, Two-sided unpaired t-test). *p < 0.05, **p < 0.01.
Fig. 3
Fig. 3. Quantifying behavior models of a value-based choice task.
a Schematic of trial structure showing mice initiating trials via sustained (500 ms) center port entry, followed by left/right choice within 3 s. Subsequent reward is delivered from center port. b Five behavior models using choice and reward history to predict current animal choice. c AIC comparison (mean ± SEM) from five behavior models of choice behavior (WS-LSh, WinStay-LoseShift; LogReg, Logistic Regression; Q-learning, standard q-learning model; rLogReg, recursive Logistic Regression; Q+forget, q-learning model with forgetting for unchosen choice). d Relationship between the probability of right choice and ∆Q value obtained from Q+forget model. Mean (thick gray line) and individual animal replicates (thin gray line). e Trial-by-trial choices (blue bar, right; green bar, left), outcomes (long bar, positive; short bar, negative) and predicted ∆Q-values derived from Q + forget model.
Fig. 4
Fig. 4. Assembly of neural encoding model during operant task with 1-photon imaging.
a Schematic showing viral injection strategy to label pathway specific PL neurons for 1-photon calcium imaging (top) and representative image indicating GRIN lens location (bottom, n = 17 animals). scale bar, 500 μm. b MIN1PIPE workflow (left) for extraction of calcium signal and snapshot for each step (middle). scale bar, 50 pixels. Representative raw Ca2+ traces from 10 neurons (right). Scale bar, 20 s. c Abstract of design matrix structure for neural encoding model showing behavioral predictors for pre-outcome, outcome, internal representations of value (top, see Table S1). Schematic of DeepLabcut pipeline for estimating head velocity (blue box) and Q + forget modeling (pink box) to estimate latent internal choice values (bottom). d Example of raw Ca2+ trace and predicted trace from full encoding model (top, left). Encoding model inferred kernels (bottom, left) from example neuron exhibiting strong O+ modulation (top, right, tuning plot). Radar plot shows overview of tuning indices from representative neuron. Peri-event time histogram and trial-by-trial neuronal activity heat map (bottom, right) aligned by O+. e, f) Histogram of binned total FVE distribution for all neurons from PL::A-DMS (e) or PL::P-DMS (f). Gray bars denote non-task tuned population (<5% FVE threshold); colored bars (blue, PL::A-DMS; orange, PL::P-DMS) denote task-tuned neurons. Pie charts showing the proportion of task-tuned neurons (insets).
Fig. 5
Fig. 5. Pre-outcome tuning is dominated by preferential encoding of choice in PL::A-DMS.
a Comparison of cumulative distribution of pre-outcome group tuning (p = 1e−5, Two-sided Kolmogorov-Smirnov test) and the proportion of highly tuned neurons to pre-outcome group predictor (insets, >5% tuning index). ***p < 0.001. b Comparison of average tuning index(Shaded area, Kernel probability density; solid line, quartile=0.4965,4.571/0,2.028; dotted line, median = 2.211/0.4421) between PL::A- or P-DMS for pre-outcome predictors. (p = 5e−7, PL::A-DMS, n = 104 cells; PL::P-DMS, n = 154 cells, Two-sided unpaired t-test). ***p < 0.001. c Comparison of cumulative distributions of individual components for pre-outcome group predictors from PL::A-DMS and average tuning index (insets; Shaded area, Kernel probability density; solid line, quartile; dotted line = 0.0.2959/0,1.057/0.2.334, median = 0/0.2718/0.7517; n = 104 cells, CUE-Init, p = 0.86; CUE-Choice, p = 8e−6; Init-Choice, p = 2e−7, Šidák multiple comparison test). ***p < 0.001. d Scatter plot of Ipsi/Contra tuning index from task tuned neurons (green: Contra- encoding neurons, blue: Ipsi-encoding neurons). e Tuning plot showing representative contralateral choice tuned neuron from PL::A-DMS. f Encoding model inferred kernels corresponding to ipsi (top) and contra (bottom) choice. g PETH (top) and trial-by-trial neuronal activity (bottom) aligned by Ipsi (left)/Contra (right) choice. Solid line, mean; shaded area, ±SEM. h Comparison of cumulative distribution(p = 0.022, Two-sided Kolmogorov-Smirnov test) and average tuning index (insets; Shaded area, Kernel probability density; solid line, quartile = 0.0.7890/0,0.3020; dotted line, median = 0.0101/0) of contra choice tuned neurons in both PL::A/P-DMS pathways (p = 0.006, PL::A-DMS, n = 104 cells; PL::P-DMS, n = 154 cells, Two-sided unpaired t-test). **p < 0.01. i Comparison of model inferred contralateral choice kernels on average for both PL::DMS pathways. Solid line, root-mean-squared (RMS); shaded area, ±95% confidence interval. Colored bar on top indicates timepoints for which RMS kernels are significantly different between pathways (bootstrap test).
Fig. 6
Fig. 6. Divergent encoding of outcome by PL::DMS pathways.
a Comparison of cumulative distribution of outcome group tuning index (p = 0.06, Two-sided Kolmogorov–Smirnov test) and the proportion of highly tuned neurons to outcome group predictor (insets, >5% tuning index). b Comparison of average tuning index (Shaded area, Kernel probability density; solid line, quartile = 1.309,4.695/0.5896,4.394; dotted line, median = 2.695/2.318) between PL::A- or P-DMS for outcome predictors (p = 0.17, PL::A-DMS, n = 104 cells; PL::P-DMS, n = 154 cells, Two-sided unpaired t-test). c Tuning plot showing representative Ch x O+ tuned neuron from PL::P-DMS. d Encoding model inferred kernels corresponding to Ch x O+ (top) and Ch x O- (bottom). e Four interactions of PETH (top) and trial-by-trial neuronal activity (bottom) aligned by outcome. Solid line, mean; shaded area, ±SEM. f Comparison of cumulative distribution (p = 0.02, Two-sided Kolmogorov-Smirnov test) and average tuning index (insets; Shaded area, Kernel probability density; solid line, quartile = 0, 0.2009/0, 0.8864; dotted line, median = 0, 0) of Ch x O+ tuned neurons in both PL-A/P-DMS pathways (p = 0.002, PL::A-DMS, n = 104 cells; PL::P-DMS, n = 154 cells, Two-sided unpaired t-test). *p < 0.05, **p < 0.01. g Comparison of model inferred Ch x O+ kernels on average for both PL-DMS pathways. Solid line, RMS; shaded area, ±95% confidence interval. Colored bar on top indicates timepoints for which RMS kernels are significantly different between pathways (bootstrap test). h Tuning plot showing representative O- tuned neuron from PL::A-DMS. i Encoding model inferred kernels corresponding to O+ (top) and O− (bottom). j PETH (top) and trial-by-trial neuronal activity (bottom) aligned by outcome. Solid line, mean; shaded area, ±SEM. k Comparison of cumulative distribution (p = 2e−5, Two-sided Kolmogorov–Smirnov test) and average tuning index (insets; Shaded area, Kernel probability density; solid line, quartile = 0,1.107/0,0.3613; dotted line, median=0.3689/0) of O- tuned neurons in both PL-A/P-DMS pathways (p = 0.004, PL::A-DMS, n = 104 cells; PL::P-DMS, n = 154 cells, Two-sided unpaired t-test). **p < 0.01, ***p < 0.001. l Comparison of model inferred O- kernels on average for both PL-DMS pathways. Solid line, RMS; shaded area, ±95% confidence interval. Colored bar on top indicates timepoints for which RMS kernels are significantly different between pathways (bootstrap test).
Fig. 7
Fig. 7. Preferential representation of internal value in PL::P-DMS.
a Comparison of cumulative distribution of internal value tuning index (p = 1e−06, Two-sided Kolmogorov–Smirnov test) and the proportion of highly tuned neurons to internal value predictor (insets, >5% tuning index). **p < 0.01. b Comparison of average tuning index (Shaded area, Kernel probability density; solid line, quartile = 1.052,3.685/1.939,7.831; dotted line, median = 2.410/4.972) between PL::A- or P-DMS for internal value predictors (p = 3e−7, PL::A-DMS, n = 104 cells; PL::P-DMS, n = 154 cells, Two-sided unpaired t-test). ***p < 0.001. c Tuning plot showing representative ∆Q tuned neuron from PL::P-DMS. d Time course of raw Ca2+ (black, top) and ∆Q (orange, bottom) trace. Choices and outcomes at top (left/right, green/blue bar; O+/O−, long/short bar). e Outcome aligned trial-by-trial transient Ca2+ signals ranked by ∆Q (left; scale bar, 2 s) and scatter plot showing linear correlation between ∆Q and trial average of Ca2+ transients (right, orange dots denote single trial for a given ∆Q and Ca2+ signals, black dotted line from linear regression. r = 0.61, p < 1e−12, n = 135 trials, simple linear regression). f Comparison of cumulative distribution (p = 0.003, Two-sided Kolmogorov–Smirnov test) and average tuning index (insets; shaded area, Kernel probability density; solid line, quartile = 0,0.5914/0,1.239; dotted line, median = 0.1281/0.4622) of ∆Q tuned neurons in both PL-A/P-DMS pathways (p = 6e−4, PL::A-DMS, n = 104 cells; PL::P-DMS, n = 154 cells, Two-sided unpaired t-test). **p < 0.01, ***p < 0.001. g Tuning plot showing representative RR tuned neuron from PL::P-DMS. h Time course of raw Ca2+ (black, top) and RR (orange, bottom). Choices and outcomes at top (left/right, green/blue bar; O+/O−, long/short bar). i Outcome aligned trial-by-trial transient Ca2+ signals ranked by RR (left; scale bar, 2 s) and scatter plot showing linear correlation between RR and trial average of Ca2+ transients (right). Orange dots denote single trial for a given RR and Ca2+ signals, black dotted line from linear regression (r = 0.58, p < 1e−12, n = 79 trials, simple linear regression). j Comparison of cumulative distribution (p = 0.0012, Two-sided Kolmogorov–Smirnov test) and average tuning index (insets; Shaded area, Kernel probability density; solid line, quartile = 0,0.7863/0,2.503; dotted line, median = 0.009/0.5833) of RR tuned neurons in both PL-A/P-DMS pathways (p = 3e−4, PL::A-DMS, n = 104 cells; PL::P-DMS, n = 154 cells, Two-sided unpaired t-test). **p < 0.01, ***p < 0.001.
Fig. 8
Fig. 8. Optogenetic suppression during choice/outcome epoch impaired subsequent choice selection in a pathway-specific manner.
a Schematic of surgery for pathway specific suppression and light delivery protocol for prior choice inhibition. b Changes in Win-stay (left) and Lose-stay (right) probabilities when light was ON versus OFF during choice on prior trials for PL::A-DMS circuits infected with either GFP or NpHR (black, mean ±SEM; light gray line, each animal). Yellow box indicates light delivered on prior choice epoch(GFP n = 9 animals, NpHR n = 12 animals, Šidák multiple comparison test). ***p < 0.001. c same as b, but for PL::P-DMS circuits (GFP n = 10 animals, NpHR n = 11 animals). d Schematic of surgery for pathway specific suppression and light delivery protocol for prior outcome inhibition. e Changes in Win-stay (left) and Lose-stay (right) probabilities when light was ON versus OFF after outcome on prior trials for PL::A-DMS circuits infected with either GFP or NpHR (black, mean ± SEM; light gray line, each animal). Yellow box indicates light delivered on prior outcome epoch (GFP n = 9 animals, NpHR n = 12 animals, Šidák multiple comparison test). **p < 0.01. f same as e, but PL::P-DMS circuits (GFP n = 10 animals, NpHR n = 11 animals, Šidák multiple comparison test). g Normalized number of total trials in sessions with and without outcome inhibition, where inhibition was delivered in the PL::A-DMS pathway for 30% of trials at random. Blue: NpHR; gray: GFP. of PL::A-DMS pathway in a random 30% of trials (yellow box). Solid line, mean; shaded area, ±SEM (GFP n = 9 animals, NpHR n = 12 animals). h Comparison of initiation latency (mean ±SEM) between sessions with (ON) or without (OFF) outcome epoch illumination of PL::A-DMS circuits from either GFP or NpHR group (GFP n = 9 animals, NpHR n = 12 animals). i same as g, but PL::P-DMS circuits (GFP n = 10 animals, NpHR n = 11 animals, Šidák multiple comparison test). **p < 0.01, ***p < 0.001. j same as h, but PL::P-DMS circuits (GFP n  = 10 animals, NpHR n = 11 animals, Šidák multiple comparison test). **p < 0.01.

Similar articles

Cited by

References

    1. Frank MJ. Computational models of motivated action selection in corticostriatal circuits. Curr. Opin. Neurobiol. 2011;21:381–386. doi: 10.1016/j.conb.2011.02.013. - DOI - PubMed
    1. Hintiryan H, et al. The mouse cortico-striatal projectome. Nat. Neurosci. 2016;19:1100–1114. doi: 10.1038/nn.4332. - DOI - PMC - PubMed
    1. Hunnicutt BJ, et al. A comprehensive excitatory input map of the striatum reveals novel functional organization. Elife. 2016;5:e19103. doi: 10.7554/eLife.19103. - DOI - PMC - PubMed
    1. Voorn P, Vanderschuren LJ, Groenewegen HJ, Robbins TW, Pennartz CM. Putting a spin on the dorsal-ventral divide of the striatum. Trends Neurosci. 2004;27:468–474. doi: 10.1016/j.tins.2004.06.006. - DOI - PubMed
    1. Burton AC, Nakamura K, Roesch MR. From ventral-medial to dorsal-lateral striatum: neural correlates of reward-guided decision-making. Neurobiol. Learn Mem. 2015;117:51–59. doi: 10.1016/j.nlm.2014.05.003. - DOI - PMC - PubMed

Publication types