. 2023 Apr 6;14(4):247.
doi: 10.1038/s41419-023-05779-z.

Combination treatment with FAAH inhibitors/URB597 and ferroptosis inducers significantly decreases the growth and metastasis of renal cell carcinoma cells via the PI3K-AKT signaling pathway

Affiliations

Combination treatment with FAAH inhibitors/URB597 and ferroptosis inducers significantly decreases the growth and metastasis of renal cell carcinoma cells via the PI3K-AKT signaling pathway

Junfeng Hao et al. Cell Death Dis. .

Abstract

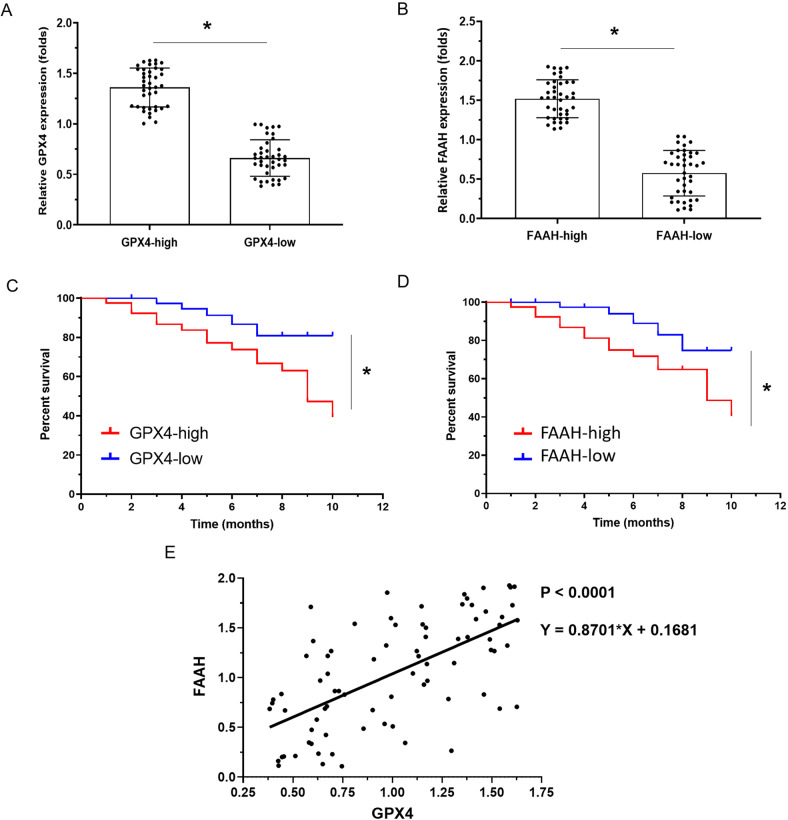
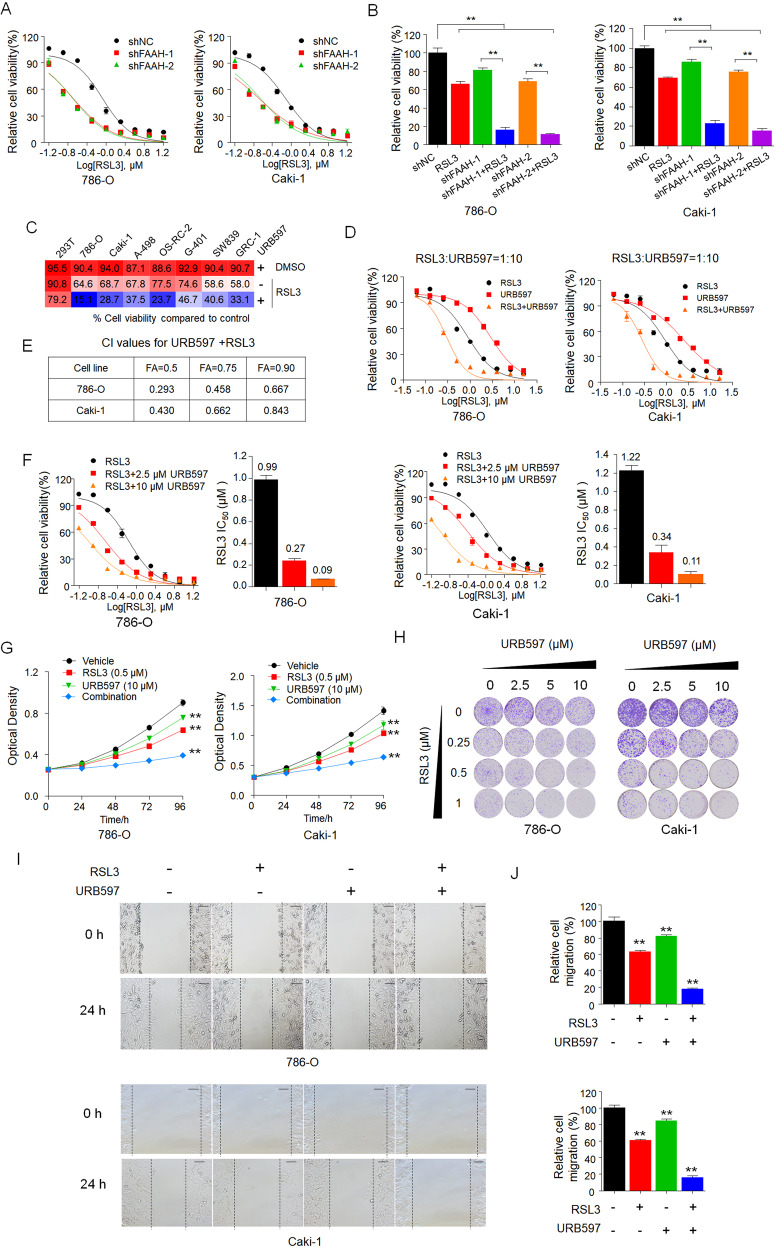
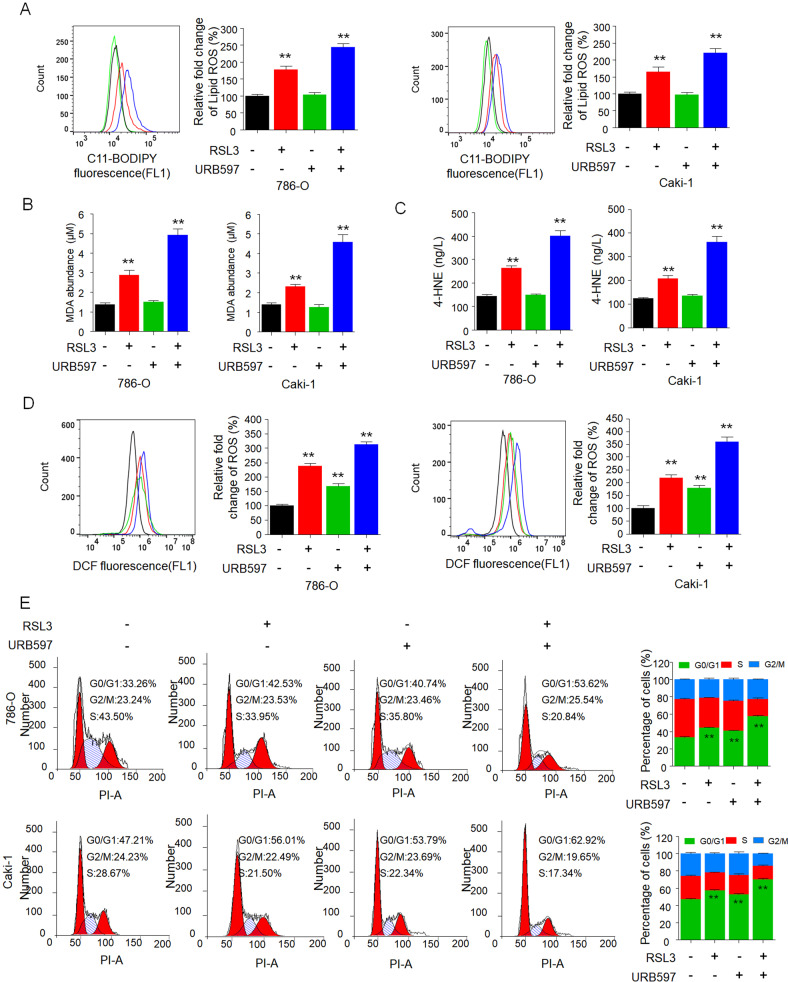
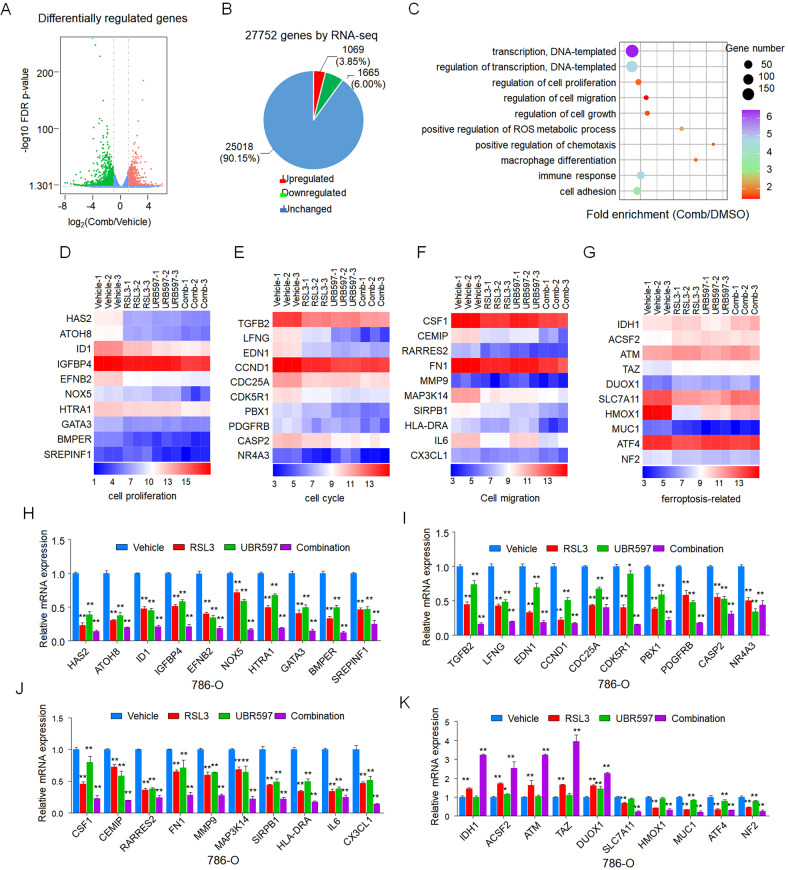
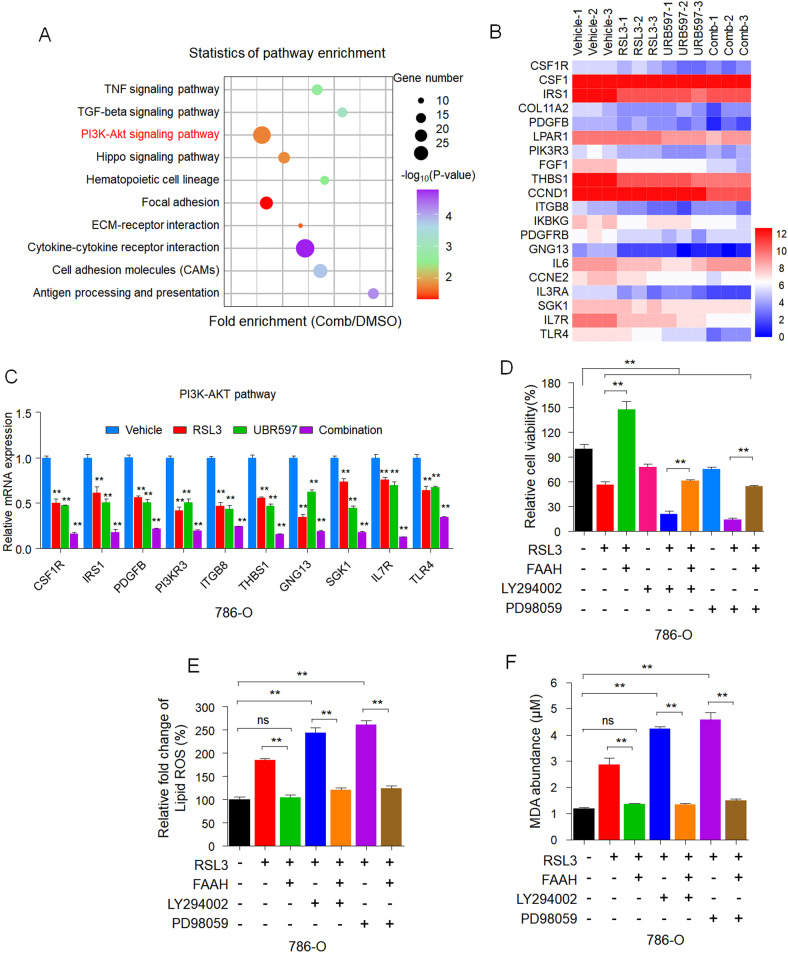
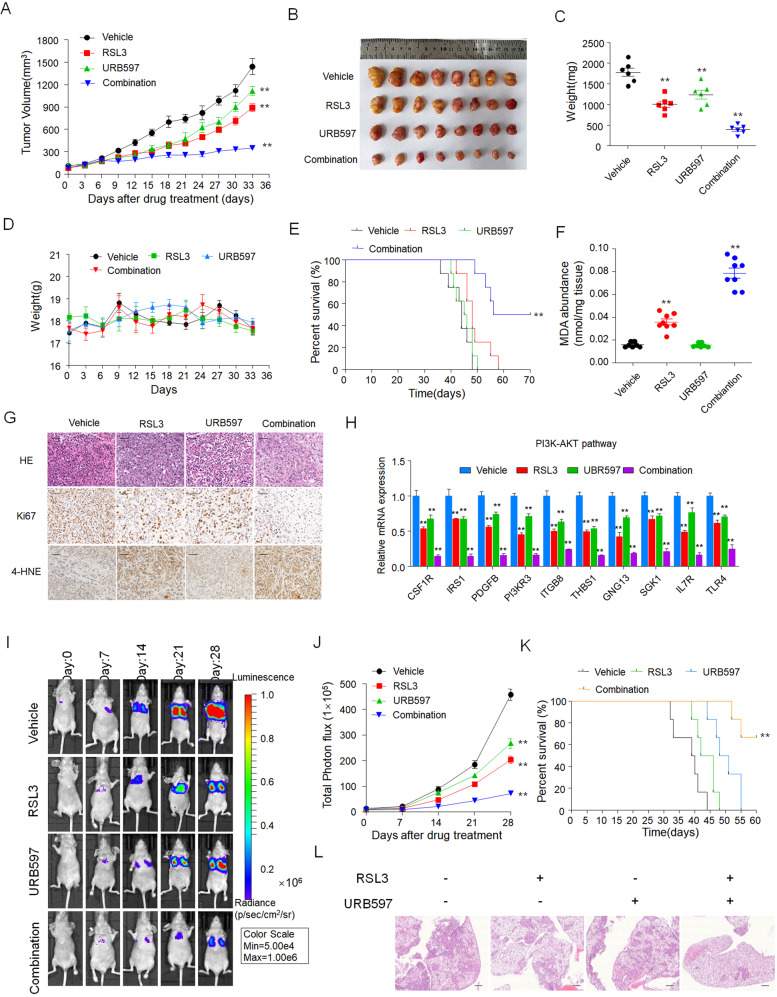
Ferroptosis, a nonapoptotic form of programmed cell death characterized by significant iron-dependent peroxidation of phospholipids, is regulated by cellular metabolism, redox homeostasis, and various cancer-related signaling pathways. Recently, considerable progress has been made in demonstrating the critical role of lipid metabolism in regulating ferroptosis, indicating the potential of combinational strategies for treating cancer in the future. In this study, we explored the combinational effects of lipid metabolism compounds and ferroptosis inducers on renal cell carcinoma (RCC) cells. We found potent synergy of the fatty acid amide hydrolase (FAAH) inhibitor URB597 with ferroptosis inducer (1S, 3R)-RSL3 (RSL3) in inhibiting the growth and metastasis of RCC cells both in vitro and in vivo via induction of G1 cell cycle arrest and promotion of the production of lipid peroxides, malondialdehyde (MDA), 4-hydroxynonenal (4-HNE), and cytosolic reactive oxygen species (ROS). In addition, inhibition of FAAH increased the sensitivity of RCC cells to ferroptosis. Genome-wide RNA sequencing indicated that the combination of URB597 and RSL3 has more significant effects on regulation of the expression of genes related to cell proliferation, the cell cycle, cell migration and invasion, and ferroptosis than either single agent alone. Moreover, we found that combinational treatment modulated the sensitivity of RCC cells to ferroptosis via the phosphatidylinositol 3 kinase (PI3K)-AKT signaling pathway. These data demonstrate that dual targeting of FAAH and ferroptosis could be a promising strategy for treating RCC.


Conflict of interest statement

The authors declare no competing interests.

Figures

Fig. 1
Fig. 1. The clinical significance of FAAH and GPX4 in advanced ccRCC.
Quantitative polymerase chain reaction was used to detect the expression of FAAH and GPX4 in clinical specimens from ccRCC patients. (A, B) Patients were divided into two groups (high-expression group or low-expression group) according to their median expression of GPX4 (A) and FAAH (B). The results are displayed as scatter plots and histograms. Clinical analysis was performed based on follow-up data from patients (C, D). The prognosis of patients (overall survival) in the high/low groups of GPX4 (C) or high/low groups of FAAH (D) is shown as a survival curve. *P < 0.05.
Fig. 2
Fig. 2. Synergy of URB597 with ferroptosis inducers significantly decreases the proliferation and migration of RCC cells.
A, B Effect of FAAH knockdown on 786-O and Caki-1 cells in response to RSL3 treatment with two distinct FAAH shRNA expression vectors. Dose–response curves for 786-O and Caki-1 cells stably transfected with negative control vector or shFAAH treated with RSL3 at the indicated doses (A). Cell viability was assessed by CCK-8 assay (B). **p < 0.01 (one-way ANOVA). C Combinational effects of URB597 (10 µM) and RSL3 at the indicated concentrations in various renal cell lines. Cells were treated with the inhibitors singly or the indicated target pairs. Viability was measured 72 h after treatment with the indicated concentrations of drugs. Effects on cell viability were calculated as the percentage of vehicle-treated cells. D, E Effects of RSL3 with URB597 singly or in combination in the indicated cell lines. The viability of 786-O and Caki-1 cells was measured 72 h after treatment with the indicated doses of drugs (D). The combination index (CI) was calculated with the Chou–Talalay equation using multiple doses and response points. CI values for three different indicated Fa are shown (E). F Dose–response curves for RSL3 as a single agent or in combination with URB597 at the indicated doses in 786-O and Caki-1 cells for 72 h. The effects of URB597 on the IC50 of RSL3 are shown in the bar graphs (right). G Proliferation curves of single agents and combinations of drugs in 786-O and Caki-1 cells treated with the indicated concentrations of RSL3 and URB597 for 96 h. Cell viability was assessed by CCK-8 assay after treatment with the indicated doses of drugs. **p < 0.01 versus the corresponding control (t test). H In the colony formation assay, 786-O and Caki-1 cells were treated with increasing concentrations of URB597 and RSL3 singly and in combination for 14 days, and cells were fixed and stained with crystal violet. I, J In the wound-healing assay, 786-O and Caki-1 cells were treated with URB597 (10 µM) and RSL3 (0.5 µM) singly and in combination following mitomycin C (1 µM) treatment for the indicated time. Histograms show the relative cell migration (J). Scale bar: 100 µm. **p < 0.01 versus the corresponding control (t test). Data are means ± SDs of measurements repeated three times with similar results.
Fig. 3
Fig. 3. URB597 combined with RSL3 significantly inhibits the growth of RCC cells by inducing ferroptosis and cell cycle arrest.
Level of lipid peroxidation (A), MDA (B), 4-HNE (C), and cytosolic ROS production (D) in 786-O and Caki-1 cells treated with URB597 (10 µM) and RSL3 (0.5 µM) singly or in combination for 48 h. Lipid peroxidation and cytosolic ROS were assessed by flow cytometry with C11-BODIPY and H2DCFDA, respectively. Histograms show the production of MDA, the production of 4-HNE, and the relative fold change in lipid ROS and cytosolic ROS (right panel). E Cell cycle distributions of 786-O and Caki-1 cells treated as in (A). The cell cycle was evaluated by flow cytometry after staining with propidium iodide (PI). Histograms show the cell cycle distributions of treated 786-O and Caki-1 cells (right). Data are means ± SDs of measurements repeated three times with similar results. **p < 0.01 versus the corresponding control (t test).
Fig. 4
Fig. 4. FAAH substrates increase the sensitivity of RCC to ferroptosis inducers.
A Dose–response curves for RSL3 as a single agent or combined with AEA, PEA, and OEA at the indicated doses in 786-O and Caki-1 cells for 72 h. Viability was measured 72 h after treatment. Effects on cell viability were calculated as the percentage of vehicle-treated cells. B In the colony formation assay, 786-O and Caki-1 cells were treated as in (A) for 14 days, and cells were fixed and stained with crystal violet. C–E In the wound-healing assay, 786-O (C) and Caki-1 (D) cells were treated as in (A) for the indicated time. Histograms show the relative cell migration (E). Scale bar: 100 µm. Level of lipid peroxidation (F) and cytosolic ROS production (G) in 786-O cells treated as in (A) for 48 h. Lipid peroxidation and cytosolic ROS were assessed by flow cytometry with C11-BODIPY and H2DCFDA, respectively. Histograms show the relative fold change in the production of lipid ROS and cytosolic ROS (right panel). Data are means ± SDs of measurements repeated three times with similar results. ns (not significant), **p < 0.01 (one-way ANOVA).
Fig. 5
Fig. 5. RNA-Seq reveals that the combination of URB597 and RSL3 regulates the expression of genes related to cell growth and metastasis.
A, B Volcano plot of the results of an RNA-Seq analysis showing the expression of differentially regulated genes in 786-O cells between the control vehicle and combinational treatment (Comb) with URB597 (10 µM) and RSL3 (0.5 µM). Upregulated and downregulated genes are shown in red and green, respectively. Values are presented as the log10 of tag counts. C KEGG pathway analysis of differentially expressed genes in transcriptomes of 786-O cells between the control vehicle and combinational treatment (Comb) with URB597 (10 µM) and RSL3 (0.5 µM). The 10 most significantly activated pathways are shown. Heat map of significantly regulated genes in transcriptomes of 786-O cells between the control vehicle and combinational treatment (Comb) with URB597 (10 µM) and RSL3 (0.5 µM) correlated with cell proliferation (D), the cell cycle (E), cell migration (F), and ferroptosis (G) (n = 3). qPCR analysis of the indicated gene expression associated with cell proliferation (H), the cell cycle (I), cell migration (J), and ferroptosis (K) in 786-O cells treated with URB597 (10 µM) and RSL3 (0.5 µM) singly or in combination for 48 h compared to parental 786-O cells. Data are means ± SDs of measurements repeated three times with similar results. ns (not significant), **p < 0.01 versus the corresponding control (t test).
Fig. 6
Fig. 6. RNA-Seq reveals inhibition of FAAH-regulated sensitivity to ferroptosis via the PI3K-AKT pathway.
A KEGG pathway analysis of downregulated differentially expressed genes in transcriptomes of 786-O cells after combinational treatment (Comb) with URB597 (10 µM) and RSL3 (0.5 µM). The 10 most significantly activated pathways are shown. B Heat map of significantly regulated genes of transcriptomes of 786-O cells after combinational treatment with URB597 (10 µM) and RSL3 (0.5 µM) correlated with the PI3K-AKT pathway (n = 3). C qPCR analysis of the indicated gene expression associated with the PI3K-AKT pathway in 786-O cells treated with URB597 (10 µM) and RSL3 (0.5 µM) singly or in combination for 48 h compared to parental 786-O cells. **p < 0.01 versus the corresponding control (t test). D The viability of 786-O cells stably transfected with empty vector or FAAH treated with RSL3 (0.5 µM), LY294002 (5 µM), or PD98059 (10 µM) singly or in combination. Cell viability was assessed by CCK-8 assay after treatment for 72 h with the indicated doses of drugs. Effect of FAAH overexpression, LY294002 (5 µM), and PD98059 (10 µM) on lipid peroxidation (E) and MDA (F) response to RSL3 treatment in 786-O cells. Data are means ± SDs of measurements repeated three times with similar results. ns (not significant), **p < 0.01 (one-way ANOVA).
Fig. 7
Fig. 7. Synergy of URB597 with ferroptosis inducers significantly inhibits RCC tumor growth and metastasis in vivo.
786-O cells were treated with the vehicle, URB597 (30 mg/kg), and RSL3 (30 mg/kg) singly or in combination. Tumor size was monitored every other day (A). Photograph of tumors (B), tumor weight (C), and body weight (D) are shown (n = 6 per group). **p < 0.01 (t test). E Survival rates of nude mice treated as in (A) (n = 6 per group). **p < 0.01 (Kaplan–Meier). F Representative images of H&E, Ki67, and 4-HNE IHC staining in tumors harvested from each group. Scale bars: 50 μm. G the results of MDA abundance. H qPCR analysis of the indicated gene expression associated with the PI3K-AKT pathway in tumors harvested from each group. Data are means ± SDs of measurements repeated three times with similar results. **p < 0.01 versus the corresponding control (t test). I, J Representative bioluminescent images of animals treated as in (A) taken on days 0, 7, 14, 21, and 28 after bioluminescent 786-O xenografts (I). Quantification of tumor cells in mice was performed with bioluminescence analysis (L) (n = 6 per group). **p < 0.01 (t test). K Survival rates of nude mice treated as in (A) (n = 6 per group). **p < 0.01 (Kaplan–Meier). L Representative images of hematoxylin and eosin staining of paraffin sections from lungs. Scale bar: 100 μm. Data are means ± SDs of six tumors at each time point.

Similar articles

Cited by

References

    1. Linehan WM, Ricketts CJ. The Cancer Genome Atlas of renal cell carcinoma: findings and clinical implications. Nat Rev Urol. 2019;16:539–52. doi: 10.1038/s41585-019-0211-5. - DOI - PubMed
    1. Tan SK, Hougen HY, Merchan JR, Gonzalgo ML, Welford SM. Fatty acid metabolism reprogramming in ccRCC: mechanisms and potential targets. Nat Rev Urol. 2023;20:48–60. doi: 10.1038/s41585-022-00654-6. - DOI - PMC - PubMed
    1. Rathmell WK, Rumble RB, Van Veldhuizen PJ, Al-Ahmadie H, Emamekhoo H, Hauke RJ, et al. Management of metastatic clear cell renal cell carcinoma: ASCO guideline. J Clin Oncol. 2022;40:2957–95. doi: 10.1200/JCO.22.00868. - DOI - PubMed
    1. Zhang H, Yu L, Chen J, Liu L, Yang X, Cui H, et al. Role of metabolic reprogramming of long non-coding RNA in clear cell renal cell carcinoma. J Cancer. 2022;13:691–705. doi: 10.7150/jca.62683. - DOI - PMC - PubMed
    1. Jonasch E, Walker CL, Rathmell WK. Clear cell renal cell carcinoma ontogeny and mechanisms of lethality. Nat Rev Nephrol. 2021;17:245–61. doi: 10.1038/s41581-020-00359-2. - DOI - PMC - PubMed

Publication types

MeSH terms

Substances