. 2023 Apr 6;14(4):246.
doi: 10.1038/s41419-023-05770-8.

Melatonin inhibits bladder tumorigenesis by suppressing PPARγ/ENO1-mediated glycolysis

Affiliations

Melatonin inhibits bladder tumorigenesis by suppressing PPARγ/ENO1-mediated glycolysis

Dexin Shen et al. Cell Death Dis. .

Abstract

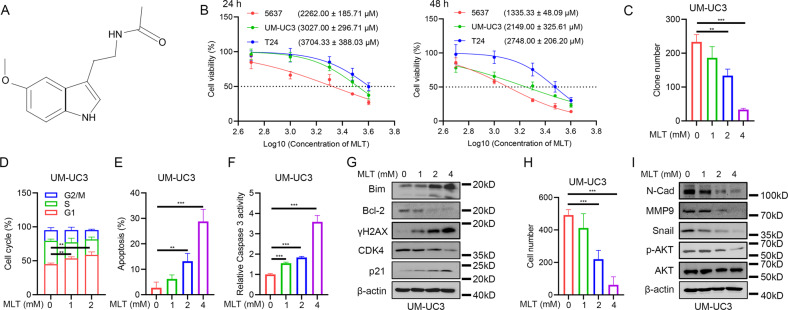
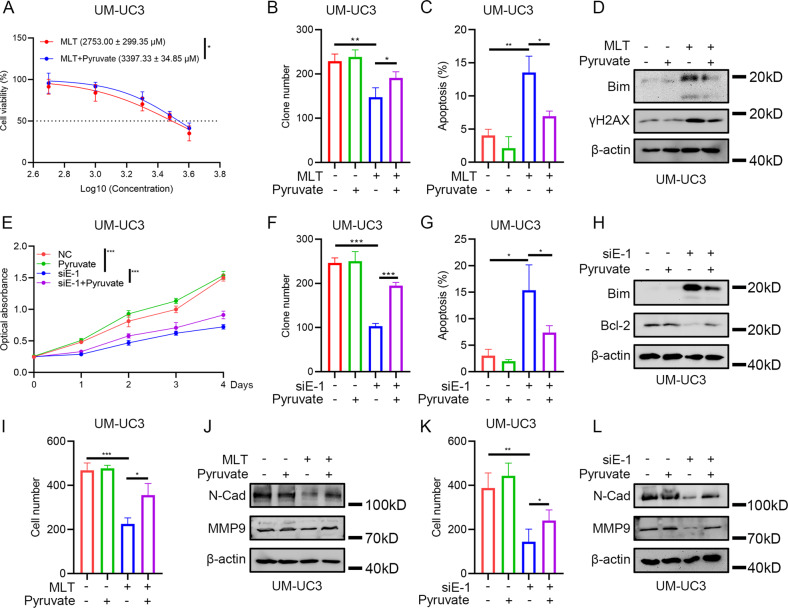
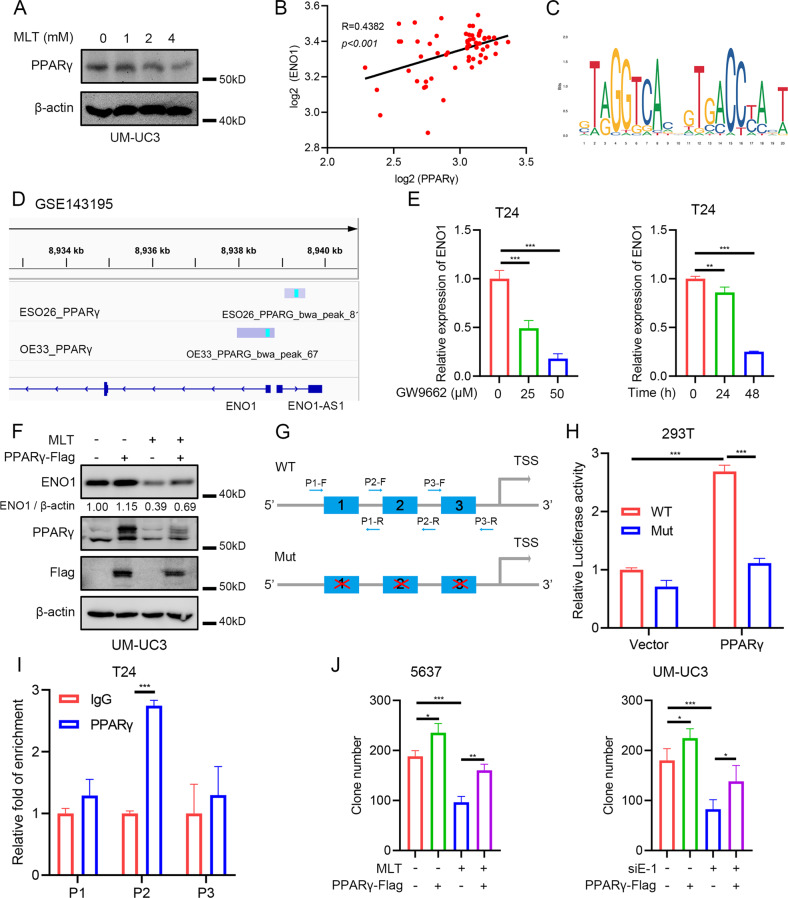
Melatonin is a well-known natural hormone, which shows a potential anticancer effect in many human cancers. Bladder cancer (BLCA) is one of the most malignant human cancers in the world. Chemoresistance is an increasingly prominent phenomenon that presents an obstacle to the clinical treatment of BLCA. There is an urgent need to investigate novel drugs to improve the current clinical status. In our study, we comprehensively explored the inhibitory effect of melatonin on BLCA and found that it could suppress glycolysis process. Moreover, we discovered that ENO1, a glycolytic enzyme involved in the ninth step of glycolysis, was the downstream effector of melatonin and could be a predictive biomarker of BLCA. We also proved that enhanced glycolysis simulated by adding exogenous pyruvate could induce gemcitabine resistance, and melatonin treatment or silencing of ENO1 could intensify the cytotoxic effect of gemcitabine on BLCA cells. Excessive accumulation of reactive oxygen species (ROS) mediated the inhibitory effect of melatonin on BLCA cells. Additionally, we uncovered that PPARγ was a novel upstream regulator of ENO1, which mediated the downregulation of ENO1 caused by melatonin. Our study offers a fresh perspective on the anticancer effect of melatonin and encourages further studies on clinical chemoresistance.


Conflict of interest statement

The authors declare no competing interests.

Figures

Fig. 1
Fig. 1. Melatonin exerted inhibitory effects on proliferation and metastasis of BLCA cells.
A Structural of melatonin. B IC50 value of 24 h and 48 h melatonin treatment on BLCA cells (n = 3). C Statistical analysis of clone formation assay of UM-UC3 cells under 48 h melatonin treatment (n = 3). D Statistical analysis of cell cycle distribution of UM-UC3 cells under 24 h melatonin treatment (n = 3). E Statistical analysis of apoptotic cells of UM-UC3 cells under 24 h melatonin treatment (n = 3). F Caspase 3 activity assay of UM-UC3 cells under 24 h melatonin treatment (n = 3). G Western blot assay of apoptosis-related and cell cycle-related proteins of UM-UC3 cells after 24 h melatonin treatment. H Transwell assay of UM-UC3 cells after 24 h melatonin treatment and statistical analysis. I Western blot assay of EMT-related proteins cells after 24 h melatonin treatment. *p < 0.05, **p < 0.01, ***p < 0.001.
Fig. 2
Fig. 2. Identification of ENO1 as a potential target of melatonin in BLCA cells.
A GSEA result of RNA-seq of BLCA cells after 24 h melatonin (0 mM, 1 mM, 2 mM, and 4 mM) treatment. B Detection of cellular pyruvate level after 24 h melatonin treatment in BLCA cells (n = 3). C Heatmap of the alteration of glycolytic enzymes in BLCA cells after 24 h melatonin (0 mM, 1 mM, 2 mM, and 4 mM) treatment. D Venn map of co-DEGs in GSE3167, GSE7476, GSE27488, and glycolysis enzymes. E Expression level of ENO1 in normal bladder tissues versus BLCA tissues in GSE13507 dataset. F Expression level of ENO1 in low-grade BLCA tissues versus high-grade BLCA tissues in GSE13507 dataset. G Expression level of ENO1 in BLCA tissues with or without progression in GSE13507 dataset. H Survival analysis of BLCA patients with different ENO1 mRNA level in GSE13507 dataset. I qRT-PCR analysis of ENO1 expression alteration after 24 h melatonin (0 mM, 1 mM, 2 mM, and 4 mM) treatment in BLCA cells (n = 4). J Western blot assay of ENO1 protein alteration after 24 h melatonin (0 mM, 1 mM, 2 mM, and 4 mM) treatment in BLCA cells. *p < 0.05, **p < 0.01, ***p < 0.001.
Fig. 3
Fig. 3. Supplement of exogenous pyruvate could reverse the inhibitory effect of melatonin treatment or silencing of ENO1 on BLCA cells.
A IC50 value of 24 h melatonin treatment on UM-UC3 cells with exogenous pyruvate (3 mM) supplement (n = 3). B Statistical analysis of clone formation assay of UM-UC3 cells under 48 h melatonin (2 mM) treatment and exogenous pyruvate (3 mM) supplement (n = 3). C Statistical analysis of apoptotic cells of UM-UC3 cells after 24 h melatonin (2 mM) treatment with exogenous pyruvate (3 mM) supplement (n = 3). D Western blot assay of apoptosis-related proteins of UM-UC3 cells after 24 h melatonin (2 mM) treatment with exogenous pyruvate (3 mM) supplement. E MTT assay of UM-UC3 cells after silencing ENO1 with exogenous pyruvate (3 mM) supplement (n = 3), negative control siRNA was added. F Statistical analysis of clone formation assay of UM-UC3 cells after silencing ENO1 with exogenous pyruvate (3 mM) supplement (n = 3), negative control siRNA was added in “-” of siE-1 group. G Statistical analysis of apoptotic cells of UM-UC3 cells after silencing ENO1 with exogenous pyruvate (3 mM) supplement (n = 3), negative control siRNA was added in “-” of siE-1 group. H Western blot assay of apoptosis-related proteins of UM-UC3 cells after silencing ENO1 with exogenous pyruvate (3 mM) supplement, negative control siRNA was added in “-” of siE-1 group. I Statistical analysis of transwell assay of UM-UC3 cells after 24 h melatonin (2 mM) treatment with exogenous pyruvate (3 mM) supplement and statistical analysis (n = 3). J Western blot assay of EMT-related proteins of UM-UC3 cells after 24 h melatonin (2 mM) treatment with exogenous pyruvate (3 mM) supplement. K Statistical analysis of transwell assay of UM-UC3 cells after silencing ENO1 with exogenous pyruvate (3 mM) supplement (n = 3), negative control siRNA was added in “-” of siE-1 group. L Western blot assay of EMT-related proteins of UM-UC3 cells after silencing ENO1 with exogenous pyruvate (3 mM) supplement, negative control siRNA was added in “-” of siE-1 group. *p < 0.05, **p < 0.01, ***p < 0.001.
Fig. 4
Fig. 4. Melatonin treatment or silencing of ENO1 could promote the cytotoxic effect of gemcitabine.
AB Expression status of glycolysis enzymes in GSE77883. C IC50 value of gemcitabine on BLCA cells with different culture conditions under 48 h culture (n = 3), negative control siRNA was added. D Statistical analysis of apoptotic cells of UM-UC3 cells after 48 h gemcitabine (0.5 μM) treatment with exogenous pyruvate (3 mM) supplement (n = 3). E Western blot assay of γH2AX alteration in UM-UC3 cells with 48 h gemcitabine (0.5 μM) treatment and 3 mM pyruvate supplement. F Statistical analysis of apoptotic cells of UM-UC3 cells with 48 h gemcitabine (0.5 μM) treatment and 24 h 2 mM melatonin treatment (n = 4). G Western blot assay of γH2AX alteration in UM-UC3 cells with 48 h gemcitabine (0.5 μM) treatment and 24 h 2 mM melatonin treatment. H Statistical analysis of apoptotic cells of UM-UC3 cells with 48 h gemcitabine (0.5 μM) treatment and silencing ENO1 (n = 3), negative control siRNA was added in “-” of siE-1 group. I Western blot assay of γH2AX alteration in UM-UC3 cells with 48 h gemcitabine (0.5 μM) treatment and silencing ENO1, negative control siRNA was added in “-” of siE-1 group. *p < 0.05, **p < 0.01, ***p < 0.001.
Fig. 5
Fig. 5. Melatonin treatment or silencing of ENO1 could suppress BLCA growth in vivo.
A Pattern of in vivo model construction and drug treatment. B Weight of xenograft tumors (n = 5). C General view of dissected tumors. D Volume of xenograft tumors (n = 5). E Measurement of mice weight. F Representative pictures of staining assays. Scale bar: 40 μm. *p < 0.05, **p < 0.01, ***p < 0.001.
Fig. 6
Fig. 6. PPARγ mediated the downregulation of ENO1 by melatonin.
A Western blot results of PPARγ protein alteration with 24 h melatonin treatment. B Spearman correlation analysis of the expression level of ENO1 and PPARγ in GSE3167. C The binding site of PPARγ obtained from the JASPAR database. D ChIP-seq data of esophageal adenocarcinoma showing the binding of PPARγ on ENO1 promoter region. E qRT-PCR results of ENO1 mRNA level with GW9662 treatment in T24 cells (n = 3). F Western blot results of ENO1 protein level with PPARγ overexpression and melatonin (4 mM) treatment, empty vector was added. G Pattern of dual-luciferase reporter construction and ChIP-qRT-PCR primer design. H Dual-luciferase reporter assay of ENO1 promoter activity (n = 3). I ChIP-qPCR assay of putative PPARγ binding sites on ENO1 promoter (n = 3). J Statistical analysis of clone formation assay of 5637 cells and UM-UC3 cells (n = 3), empty vector or negative control siRNA was added. *p < 0.05, **p < 0.01, ***p < 0.001.
Fig. 7
Fig. 7. Melatonin inhibited tumorigenesis of bladder cancer via suppressing PPARγ/ENO1-mediated glycolysis.
Left panel: without melatonin treatment, PPARγ promotes ENO1 transcription to complete the integral glycolysis process, and the mitochondrion function normally to maintain cellular redox homeostasis. Right panel: under melatonin treatment, melatonin inhibits PPARγ-ENO1-mediated glycolysis. Decreased pyruvate production causes increased mitochondrion burden leading to abnormal ROS accumulation.

References

    1. Siegel RL, Miller KD, Fuchs HE, Jemal A. Cancer statistics, 2022. CA Cancer J Clin. 2022;72:7–33. doi: 10.3322/caac.21708. - DOI - PubMed
    1. Xia C, Dong X, Li H, Cao M, Sun D, He S, et al. Cancer statistics in China and United States, 2022: profiles, trends, and determinants. Chin Med J (Engl) 2022;135:584–90. doi: 10.1097/CM9.0000000000002108. - DOI - PMC - PubMed
    1. Siegel RL, Miller KD, Fuchs HE, Jemal A. Cancer Statistics, 2021. CA Cancer J Clin. 2021;71:7–33. doi: 10.3322/caac.21654. - DOI - PubMed
    1. Siegel RL, Miller KD, Jemal A. Cancer statistics, 2019. CA Cancer J Clin. 2019;69:7–34. doi: 10.3322/caac.21551. - DOI - PubMed
    1. Siegel RL, Miller KD, Jemal A. Cancer statistics, 2020. CA Cancer J Clin. 2020;70:7–30. doi: 10.3322/caac.21590. - DOI - PubMed

Publication types

MeSH terms