. 2023 Apr 6;15(1):16.
doi: 10.1038/s41368-023-00222-7.

The Tip60/Ep400 chromatin remodeling complex impacts basic cellular functions in cranial neural crest-derived tissue during early orofacial development

Affiliations

The Tip60/Ep400 chromatin remodeling complex impacts basic cellular functions in cranial neural crest-derived tissue during early orofacial development

Sebastian Gehlen-Breitbach et al. Int J Oral Sci. .

Abstract

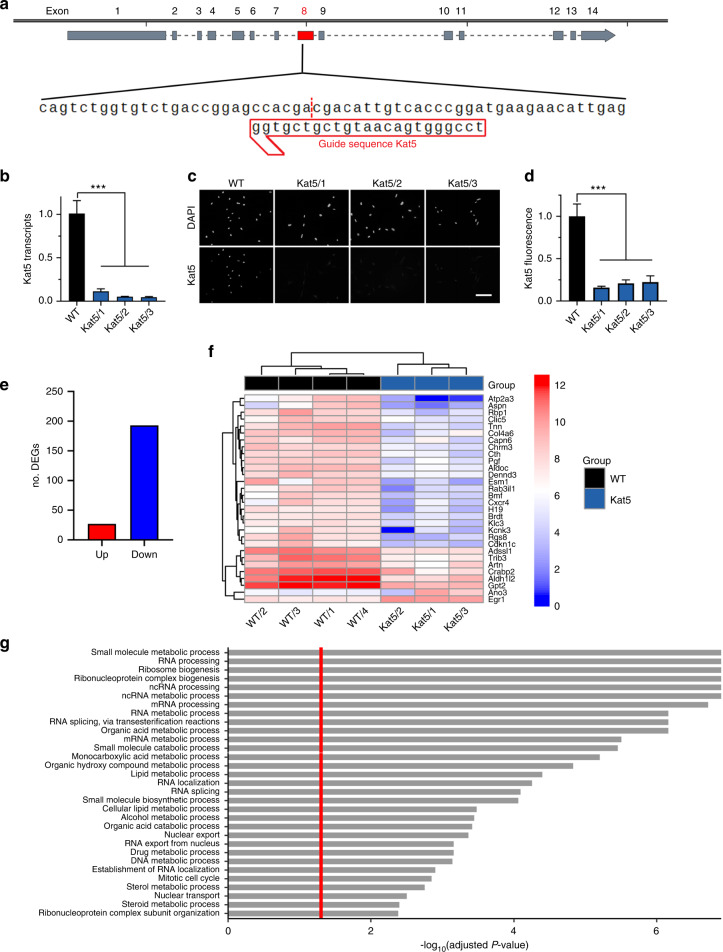
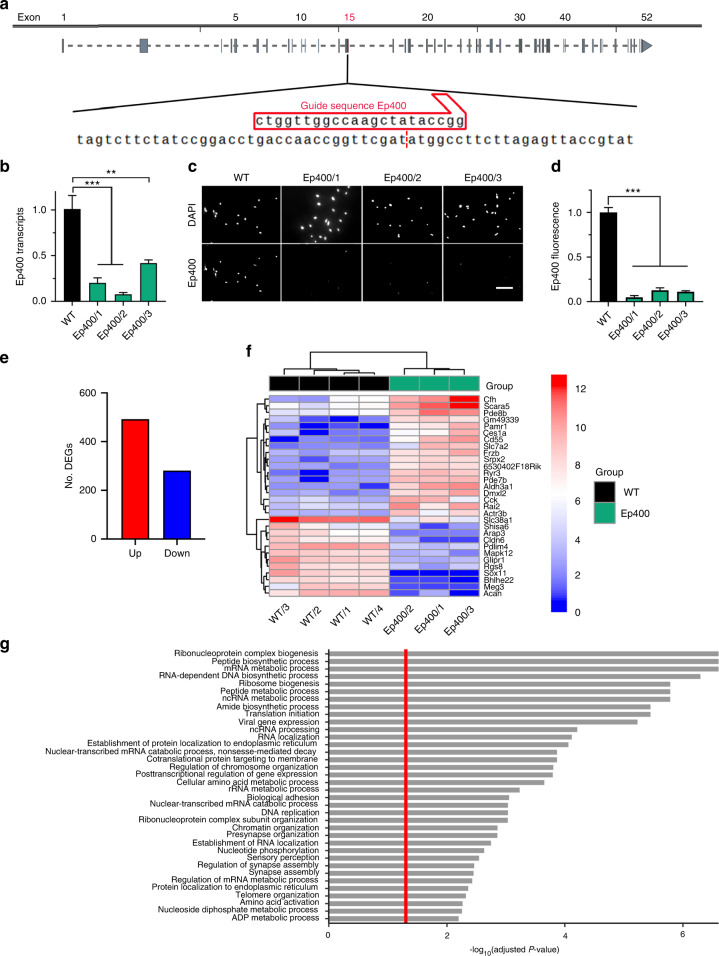
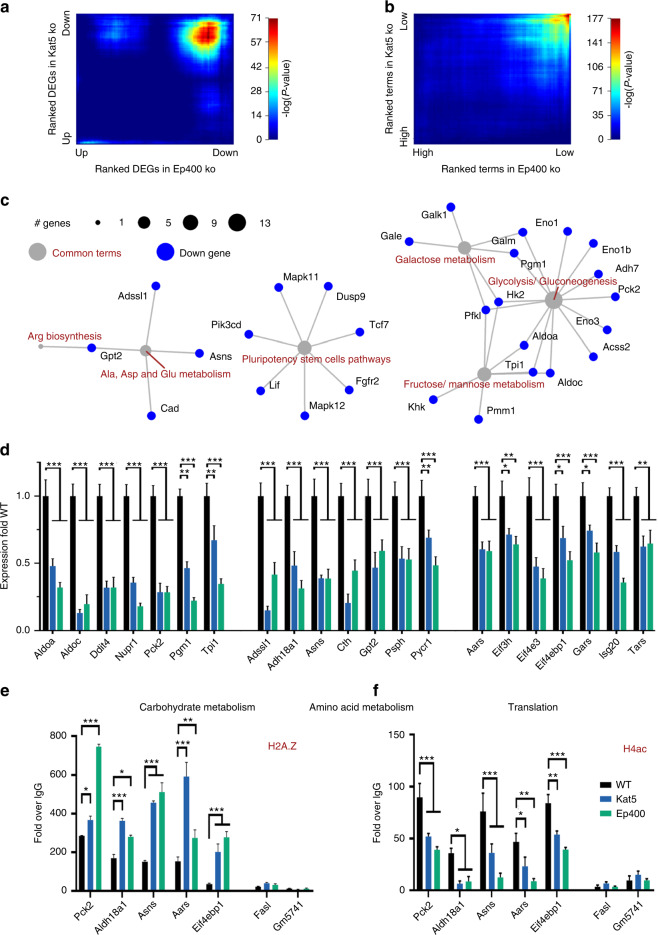
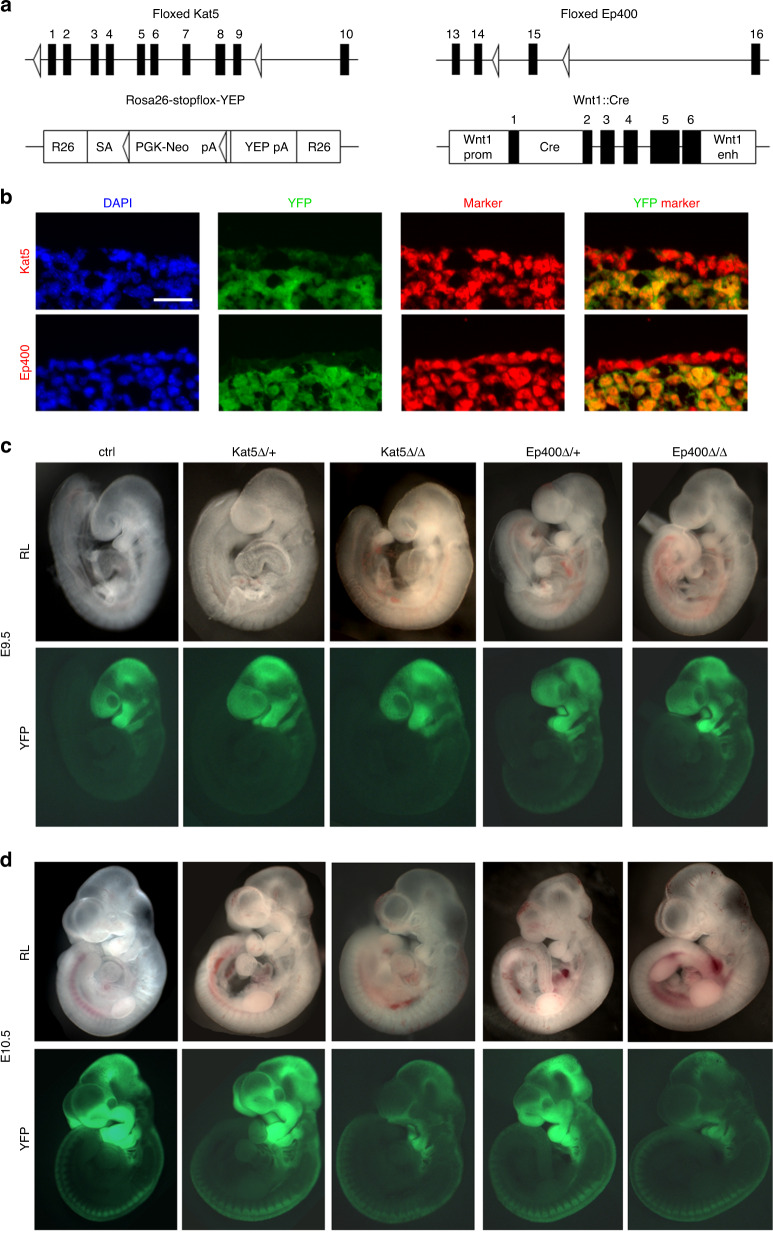
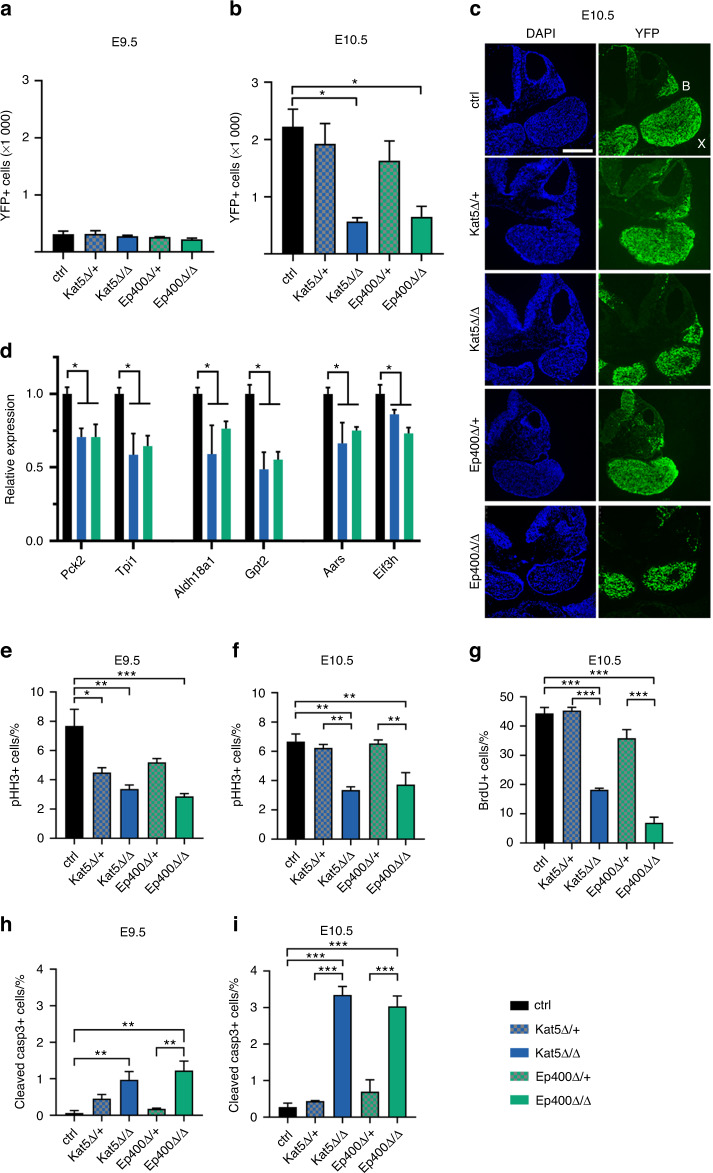
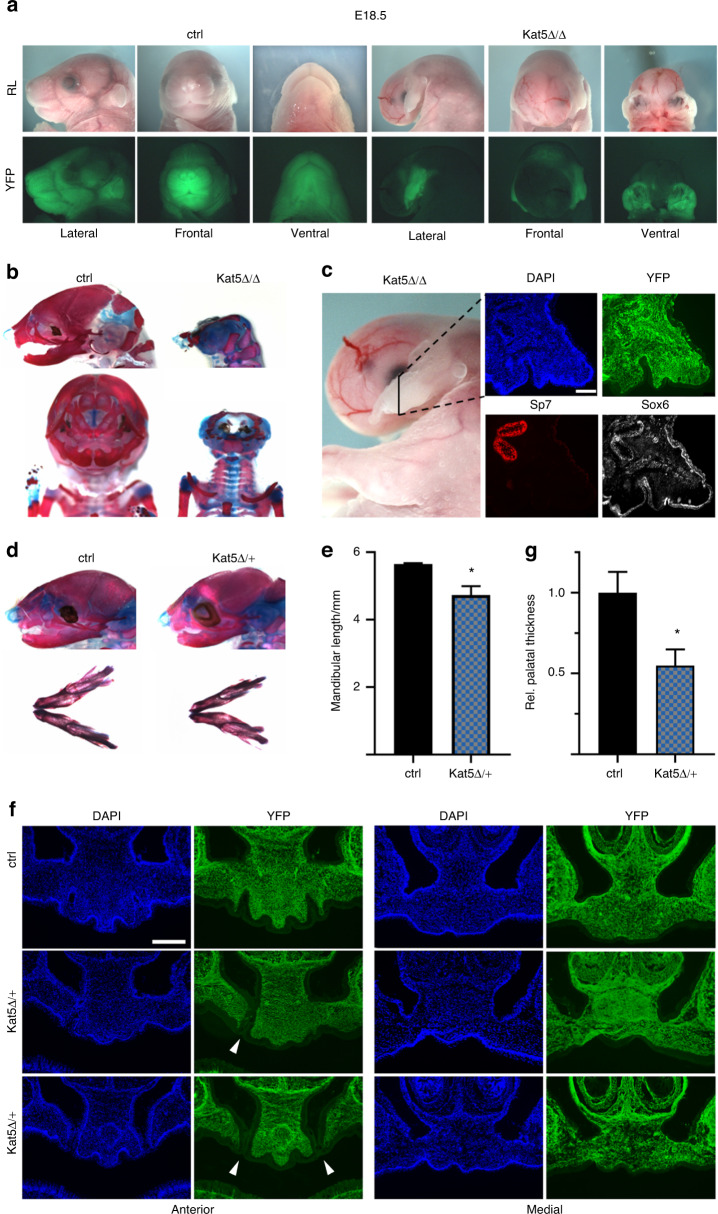
The cranial neural crest plays a fundamental role in orofacial development and morphogenesis. Accordingly, mutations with impact on the cranial neural crest and its development lead to orofacial malformations such as cleft lip and palate. As a pluripotent and dynamic cell population, the cranial neural crest undergoes vast transcriptional and epigenomic alterations throughout the formation of facial structures pointing to an essential role of factors regulating chromatin state or transcription levels. Using CRISPR/Cas9-guided genome editing and conditional mutagenesis in the mouse, we here show that inactivation of Kat5 or Ep400 as the two essential enzymatic subunits of the Tip60/Ep400 chromatin remodeling complex severely affects carbohydrate and amino acid metabolism in cranial neural crest cells. The resulting decrease in protein synthesis, proliferation and survival leads to a drastic reduction of cranial neural crest cells early in fetal development and a loss of most facial structures in the absence of either protein. Following heterozygous loss of Kat5 in neural crest cells palatogenesis was impaired. These findings point to a decisive role of the Tip60/Ep400 chromatin remodeling complex in facial morphogenesis and lead us to conclude that the orofacial clefting observed in patients with heterozygous KAT5 missense mutations is at least in part due to disturbances in the cranial neural crest.


Conflict of interest statement

The authors declare no competing interests.

Figures

Fig. 1
Fig. 1
CRISPR/Cas9-dependent Kat5 inactivation in O9-1 cells. a Schematic representation of the Kat5 gene with zoom-in on guide sequence and adjacent regions in the targeted exon 8 (red box). b Kat5 transcript levels in wildtype O9-1 cells (WT) and gene-edited clones Kat5/1 – Kat5/3 as determined by RT-PCR (n = 3). Levels in wildtype cells were set to 1 ± SEM. c, d Immunocytochemical detection of Kat5 protein in wildtype O9-1 cells (WT) and gene-edited clones (c), used for quantification (n = 3) of Kat5 levels (d). Nuclei were counterstained with DAPI. Scale bar: 150 µm. eg Summary of the consequences of Kat5 inactivation in O9-1 cells as determined by RNA sequencing of gene-edited clones (n = 3) and wildtype cells (n = 4). Shown are the number of up-regulated (red) and down-regulated (blue) genes upon Kat5 inactivation (log2-fold ≥ 1, P value ≤ 0.05) (e), a bi-clustering heatmap for visualization of the expression profile of the top 30 differentially expressed genes sorted and plotted by their (absolute) log2 transformed expression values in the samples (f), and a gene set enrichment analysis of preranked genes to identify cellular processes and structures affected by Kat5 inactivation (g). Statistical significance was determined by one-way ANOVA and Dunnett’s post test (***P ≤ 0.001)
Fig. 2
Fig. 2
CRISPR/Cas9-dependent Ep400 inactivation in O9-1 cells. a Schematic representation of the Ep400 gene with zoom-in on guide sequence and adjacent regions in the targeted exon 15 (red box). b Ep400 transcript levels in wildtype O9-1 cells (WT) and gene-edited clones Ep4005/1 – Ep4005/3 as determined by RT-PCR (n = 3). Levels in wildtype cells were set to 1 ± SEM. c, d Immunocytochemical detection of Ep400 protein in wildtype O9-1 cells (WT) and gene-edited clones (c), used for quantification (n = 3) of Ep400 levels (d). Nuclei were counterstained with DAPI. Scale bar: 150 µm. eg Summary of the consequences of Ep400 inactivation in O9-1 cells as determined by RNA sequencing of gene-edited clones (n = 3) and wildtype cells (n = 4). Shown are the number of up-regulated (red) and down-regulated (blue) genes upon Ep400 inactivation (log2-fold ≥ 1, P value ≤ 0.05) (e), a bi-clustering heatmap for visualization of the expression profile of the top 30 differentially expressed genes sorted and plotted by their (absolute) log2 transformed expression values in the samples (f), and a gene set enrichment analysis of preranked genes to identify cellular processes and structures affected by Ep400 inactivation (g). Statistical significance was determined by one-way ANOVA and Dunnett’s post test (**P ≤ 0.01; ***P ≤ 0.001)
Fig. 3
Fig. 3
Common consequences of Kat5 and Ep400 inactivation on gene expression in O9-1 cells. a RRHO analysis for comparison of DEGs in Kat5 and Ep400 ko clones ranked by their degree of differential expression. The heatmap shows a strong and statistically significant overlap in the downregulated genes. b RRHO analysis of terms obtained by GSEA of preranked genes from Kat5 and Ep400 ko clones ranked by p value reveals a strong overlap in terms with low P value. c KEGG pathway analysis for the identification of the main cellular processes (gray dots, red terms) and the key components (blue dots, black terms) affected by both Kat5 and Ep400 inactivation. d Quantitative RT-PCR to validate expression changes of DEGs related to carbohydrate (left) and amino acid (middle) metabolism or protein biosynthesis (right) shared between Kat5 and Ep400 ko clones. Normalized transcript levels for each gene in wildtype O9-1 cells (WT) were set to 1, and levels in ko clones (n = 3) expressed relative to it. e, f Chromatin immunoprecipitation to determine the occupancy of H2A.Z (e) and acetylated H4 (H4ac, f) near the transcriptional start site of the Pck2, Aldh18a1, Asns, Aars and Eif4ebp1 genes in wildtype O9-1 cells, Kat5 ko clone Kat5/3 and Ep400 clone Ep400/2. Fasl and Gm5741 genes served as controls. Amounts in precipitates were normalized to input and are presented as enrichment with histone-specific antibodies over IgG controls. Statistical significance was determined by 2-way ANOVA and Dunett’s post test (e, f) (*P ≤ 0.05; **P ≤ 0.01; ***P ≤ 0.001)
Fig. 4
Fig. 4
Altered basic functions in O9-1 cells upon Kat5 and Ep400 inactivation. ad Comparison of O9-1 cells before (WT, black bars) and after inactivation of Kat5 (blue bars) or Ep400 (green bars) regarding rate of glycolytic ATP generation (determined in a Seahorse XFe analyzer as pmol per minute) (a), translation (determined as OPP incorporation in nascent transcripts with levels in WT cells set to 100%) (b), apoptosis (determined as percentage of cleaved caspase 3-positive cells among all cells) (c) and cell increase during 48 h (determined by crystal violet staining with staining at 0 h set to 1) (d). Red line in (b) corresponds to OPP incorporation in the presence of cycloheximide. Values were averaged over all three clones and are expressed as mean ± SEM. eh Percentage of cells undergoing mitosis (e, f) or being positive for phosphohistone H3 (pHH3) (g, h) in 30% confluent cultures as additional parameters for proliferation. Quantifications (e, g) and representative phase contrast images with overlaid fluorescent DAPI signal (violet–blue to white; scale bar: 100 µm; f) or immunofluorescent images (pHH3 in red, DAPI in blue; scale bar: 200 µm; h) are shown. Statistical significance was determined by one-way ANOVA and Dunnett’s post test (*P ≤ 0.05; ***P ≤ 0.001)
Fig. 5
Fig. 5
Developmental consequences of Kat5 and Ep400 inactivation in the cranial neural crest. a Schematic representation of the floxed alleles, the Wnt1::Cre used to inactivate Kat5 and Ep400 and the Rosa26-stopflox-YFP allele used to visualize successful inactivation in the cranial neural crest. Exons are depicted as black boxes, loxP sites as open triangles. pA polyadenylation sequence, SA adenovirus splice acceptor, PGK-Neo pgk-neomycin, YFP enhanced yellow fluorescent protein, Wnt1 prom Wnt1 promoter, Cre Cre recombinase, Wnt1 enh Wnt1 enhancer. b Immunohistochemical staining of tissue from the first pharyngeal arch of control embryos at E10.5 with YFP (green) and Kat5 (red, upper row) or Ep400 (red, lower row). DAPI was used to counterstain nuclei. Scale bar: 25 µm. c, d Reflected-light microscopic (RL, upper rows) and YFP-autofluorescent (lower rows) images of whole mount control (ctrl) embryos and age-matched heterozygous as well as homozygous embryos with Kat5 (Kat5Δ/+, Kat5Δ/Δ) and Ep400 (Ep400Δ/+, Ep400Δ/Δ) deletions at E9.5 (c) and E10.5 (d)
Fig. 6
Fig. 6
Consequences of Kat5 and Ep400 inactivation on gene expression, proliferation and survival of the developing cranial neural crest. a, b Overall numbers of YFP-labelled cells in the first pharyngeal arches of control (ctrl) embryos and age-matched heterozygous as well as homozygous embryos (n = 3 for each genotype) with Kat5 (Kat5Δ/+, checkered blue; Kat5Δ/Δ, blue) and Ep400 (Ep400Δ/+, checkered green; Ep400Δ/Δ, green) deletions at E9.5 (a) and E10.5 (b). Absolute numbers ± SEM correspond to cells per first pharyngeal arch. c DAPI stain (left) and YFP-autofluorescence (right) of transverse sections from control, heterozygous and homozygous embryos with Kat5 or Ep400 deletions at E10.5 showing maxillary (X) and mandibular (B) branch of the first pharyngeal arch. Scale bar: 300 µm. d Quantitative RT-PCR to determine transcript levels of Pck2, Tpi1, Aldh18a1, Gpt2, Aars and Eif3h in pharyngeal arches of ctrl, Kat5Δ/Δ and Ep400Δ/Δ embryos at E10.5. Normalized transcript levels for each gene in ctrl embryos were set to 1, and levels in Kat5Δ/Δ and Ep400Δ/Δ embryos (n = 3) were expressed relative to it. eg Percentages of phosphohistone H3- (pHH3-) positive (e, f) and BrdU-labelled (g) neural crest cells in the first pharyngeal arches of control, hetero- and homozygous embryos (n = 3 for each genotype). Percentages are given as mean value ± SEM. h, i Rate of cleaved caspase 3-positive apoptotic cells in the various genotypes at E9.5 (h) and E10.5 (i). Statistical significance was determined by multiple t-test (d) or one-way ANOVA and Sidak’s post test (ei) (*P ≤ 0.05; **P ≤ 0.01; ***P ≤ 0.001)
Fig. 7
Fig. 7
Perinatal phenotype of mice with neural crest-specific Kat5 inactivation. a Reflected-light microscopic (RL, upper row) and YFP-autofluorescent (lower row) images of heads from control (ctrl) embryos and age-matched homozygous embryos with Kat5 deletion (Kat5Δ/Δ) at E18.5. b Alcian blue/alizarin red stainings of cartilaginous and osseous head structures in control and Kat5Δ/Δ embryos at E18.5. c Immunohistochemical staining of the remaining facial structures in Kat5Δ/Δ embryos at E18.5 with antibodies directed against YFP (green), Sp7 (red) and Sox6 (white). Nuclei were counterstained with DAPI (blue). For overview of the structure and orientation of the plane of sectioning, see left panel. d Alcian blue/alizarin red stainings of head (top) and mandibles (bottom) from control and Kat5Δ/+ embryos at E18.5. e Determination of mandibular length in control and Kat5Δ/+ embryos at E18.5 (n = 3). f Visualization of the anterior (left) and middle (right) part of the secondary palate of control and Kat5Δ/+ embryos at E18.5 by DAPI and YFP staining of coronal sections. Arrowheads point to clefts in the secondary palate. Scale bars: 200 µm (c, f). g Quantification of secondary palatal thickness (middle region) in control and Kat5Δ/+ embryos at E18.5 (n = 3). Statistical significance was determined by unpaired t-test (*P ≤ 0.05)

Similar articles

Cited by

References

    1. Mossey PA, Little J, Munger RG, Dixon MJ, Shaw WC. Cleft lip and palate. Lancet. 2009;374:1773–1785. doi: 10.1016/S0140-6736(09)60695-4. - DOI - PubMed
    1. Leslie EJ, Marazita ML. Genetics of cleft lip and cleft palate. Am. J. Med. Genet. C Semin. Med. Genet. 2013;163C:246–258. doi: 10.1002/ajmg.c.31381. - DOI - PMC - PubMed
    1. Mangold E, et al. Sequencing the GRHL3 Coding Region Reveals Rare Truncating Mutations and a Common Susceptibility Variant for Nonsyndromic Cleft Palate. Am. J. Hum. Genet. 2016;98:755–762. doi: 10.1016/j.ajhg.2016.02.013. - DOI - PMC - PubMed
    1. Garland MA, Reynolds K, Zhou CJ. Environmental mechanisms of orofacial clefts. Birth Defects Res. 2020;112:1660–1698. doi: 10.1002/bdr2.1830. - DOI - PMC - PubMed
    1. Reynolds K, et al. Genetics and signaling mechanisms of orofacial clefts. Birth Defects Res. 2020;112:1588–1634. doi: 10.1002/bdr2.1754. - DOI - PMC - PubMed

Publication types