. 2023 Apr 6;14(1):1925.
doi: 10.1038/s41467-023-37498-6.

Replication-associated formation and repair of human topoisomerase IIIα cleavage complexes

Affiliations

Replication-associated formation and repair of human topoisomerase IIIα cleavage complexes

Liton Kumar Saha et al. Nat Commun. .

Abstract

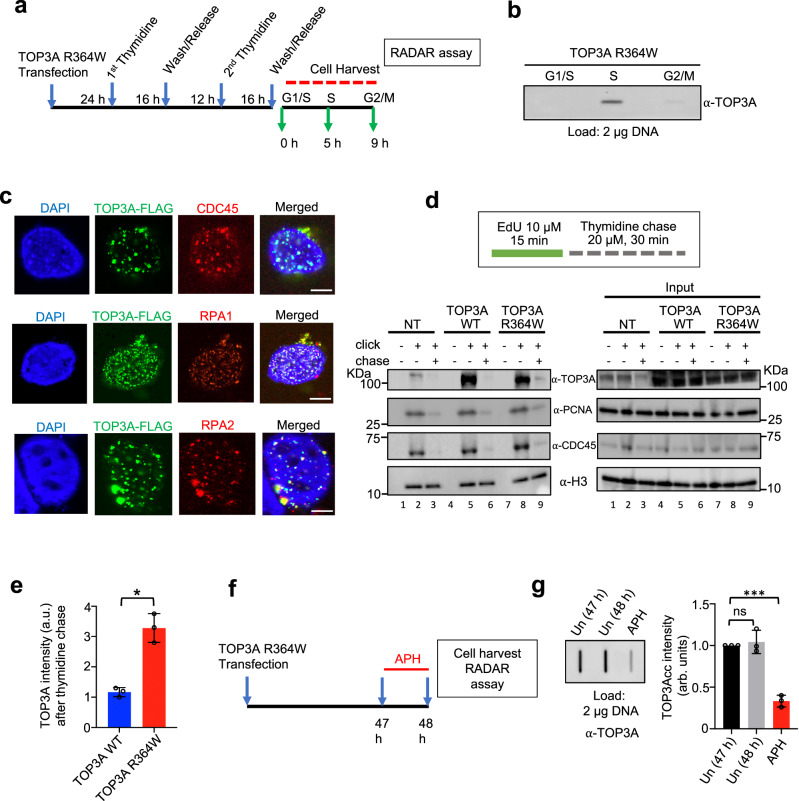
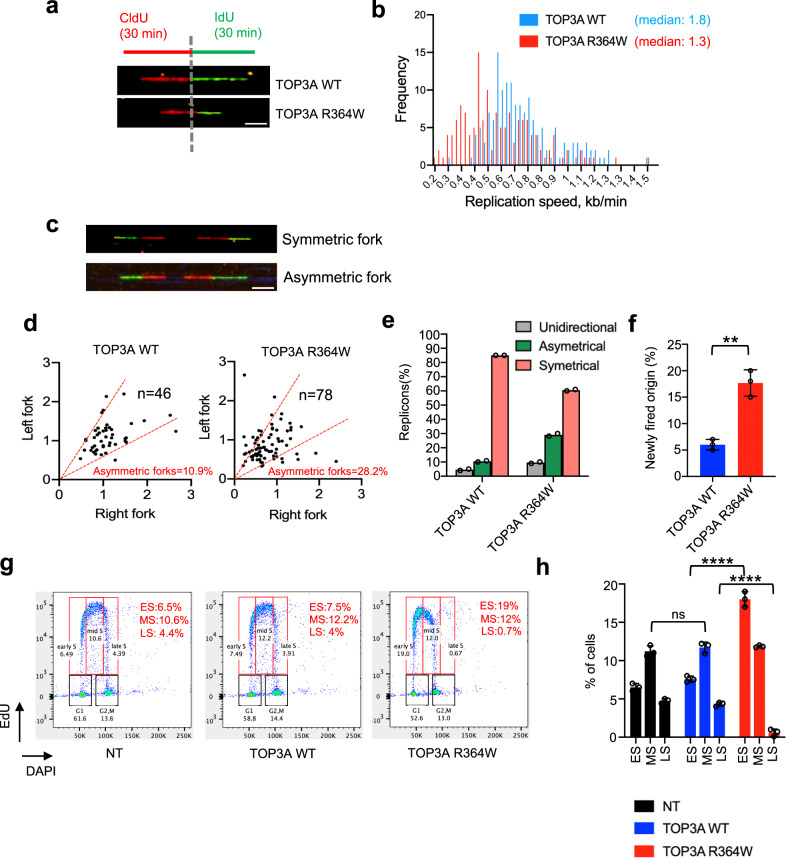
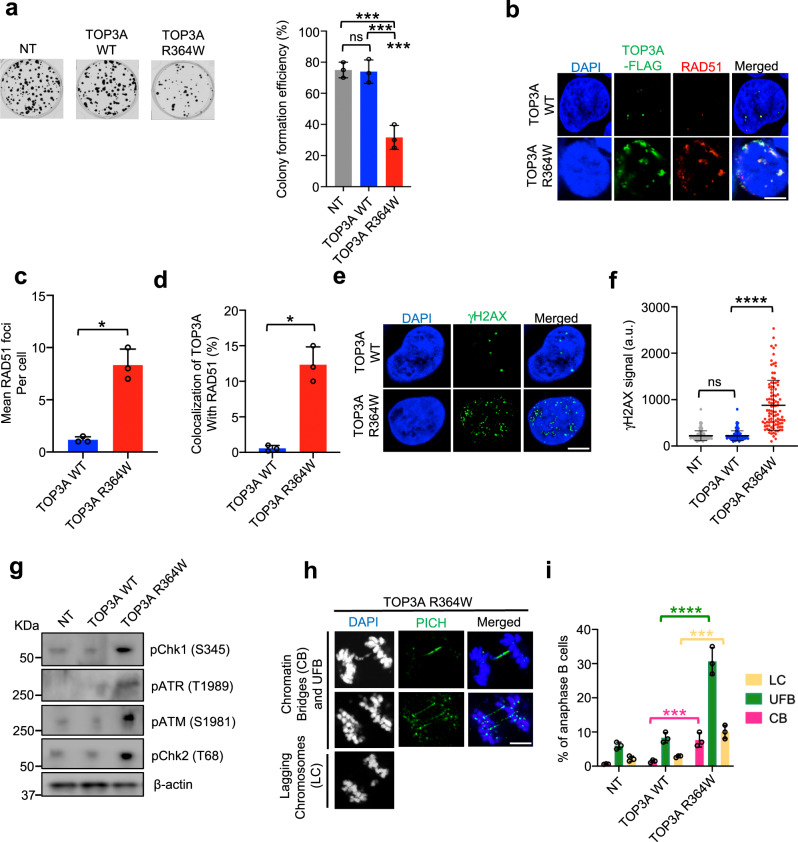
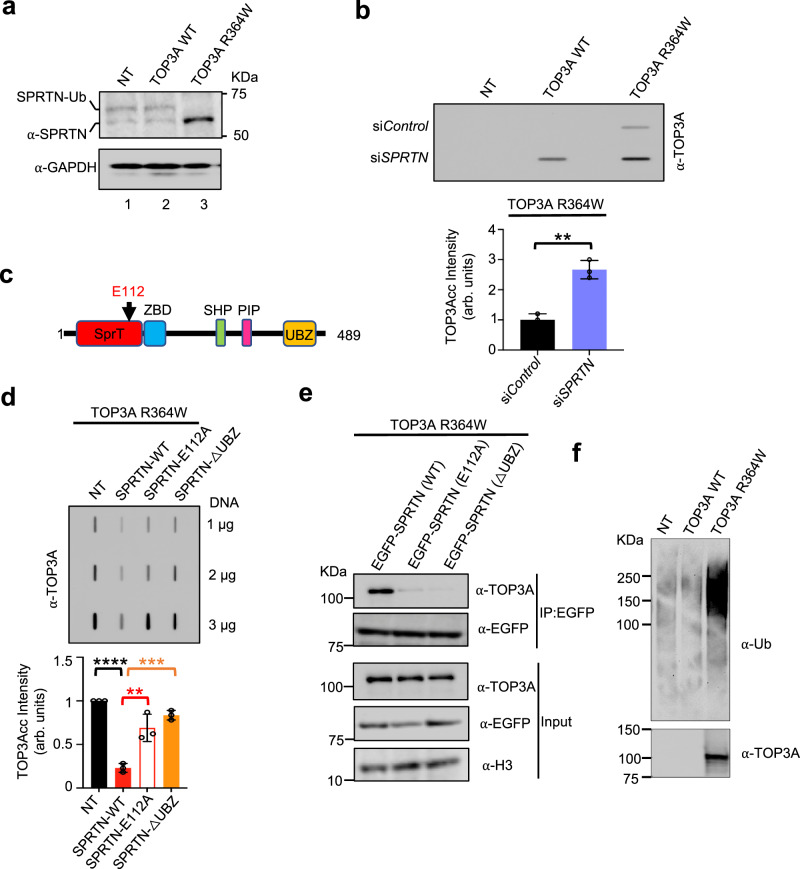
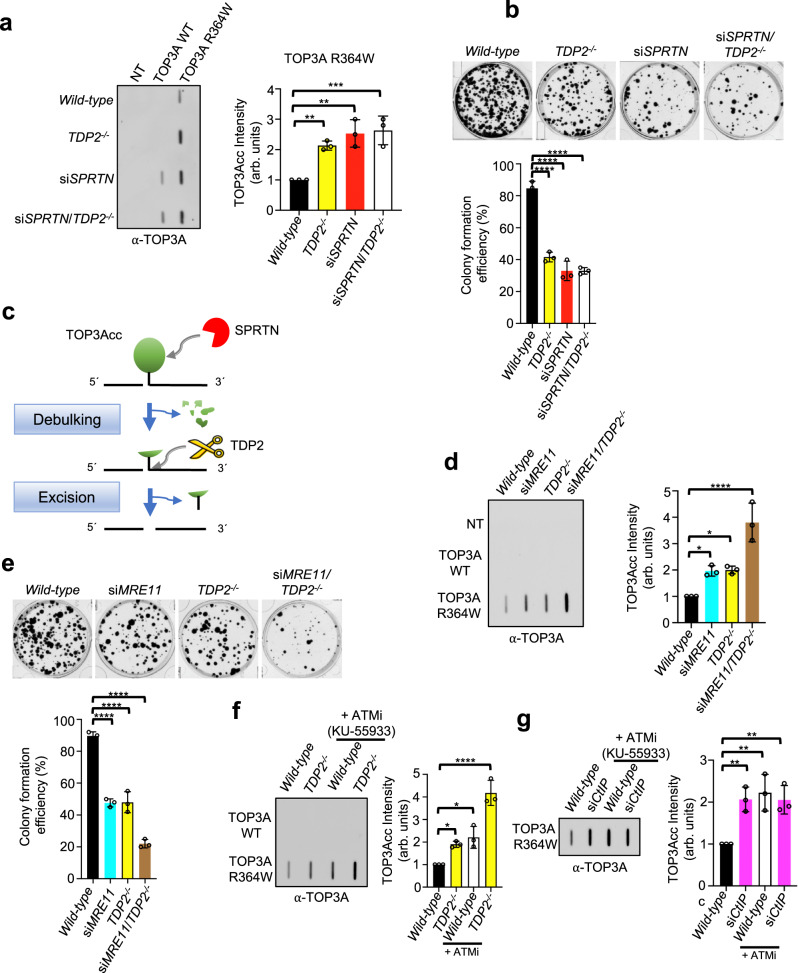
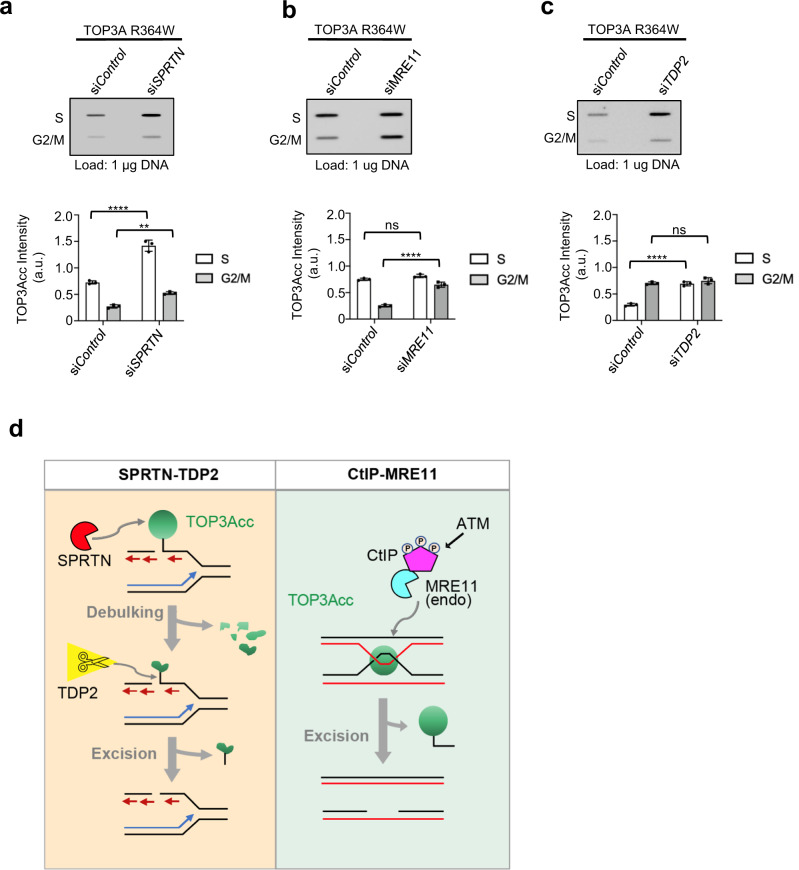
Topoisomerase IIIα (TOP3A) belongs to the conserved Type IA family of DNA topoisomerases. Here we report that human TOP3A is associated with DNA replication forks and that a "self-trapping" TOP3A mutant (TOP3A-R364W) generates cellular TOP3A DNA cleavage complexes (TOP3Accs). We show that trapped TOP3Accs that interfere with replication, induce DNA damage and genome instability. To elucidate how TOP3Accs are repaired, we explored the role of Spartan (SPRTN), the metalloprotease associated with DNA replication, which digests proteins forming DNA-protein crosslinks (DPCs). We find that SPRTN-deficient cells show elevated TOP3Accs, whereas overexpression of SPRTN lowers cellular TOP3Accs. SPRTN is deubiquitinated and epistatic with TDP2 in response to TOP3Accs. In addition, we found that MRE11 can excise TOP3Accs, and that cell cycle determines the preference for the SPRTN-TDP2 vs. the ATM-MRE11 pathways, in S vs. G2, respectively. Our study highlights the prevalence of TOP3Accs repair mechanisms to ensure normal DNA replication.


Conflict of interest statement

The authors declare no competing interests.

Figures

Fig. 1
Fig. 1. TOP3A forms TOP3Accs in cells transfected with R364W-TOP3A.
a Domain organization alignment of human and bacterial type IA topoisomerases; TOP3A and TOP3B for human, Topo III, and Topo I for E. coli. The conserved catalytic tyrosine residues with their amino acid position are indicated by red arrows. Conserved arginine amino acid residues are indicated in orange. b Structure of human TOP3A and ribbon representation of human TOP3A (amino acid [aa] residues 1–637) with the catalytic active site Y362 and the self-trapping mutation site R364. Zoom in on the part of structure where red and orange lines indicate the position of Y362 and R364. c Representative slot blot of TOP3Accs detected by RADAR assay in the indicated human cells transfected with the indicated plasmid constructs for 48 h. TOP3Accs were detected with anti-TOP3A antibody. Indicated amounts of DNA were loaded. d U2OS cells expressing FLAG-TOP3A (WT and R364W) were transfected for 48 h and were pre-extracted, fixed and analyzed by confocal microscopy. Representative images are shown. TOP3A foci were detected using anti-FLAG antibody. Scale bars: 10 μm. e Quantification of data from experiments as shown in panel D (mean ± SD; at least 100 cells quantified per condition per experiment; n = 3 independent experiments). Quantification of chromatin-bound FLAG-TOP3A foci is shown in cells expressing WT- and R364W-TOP3A. P-values were obtained by two-tailed unpaired t-test. ***p = 0.0012. Source data are provided as a Source Data file.
Fig. 2
Fig. 2. TOP3Accs are predominantly formed in replicative cells.
a Outline of the experimental protocol for transfection, cell synchronization, followed by RADAR assay in U2OS cells with ectopic expression of TOP3A-R364W. Cells at different phases of cell cycle were harvested at the indicated times and protein-DNA adducts were probed by RADAR assay. b Representative slot blot for TOP3Accs detection by RADAR assay from cells harvested as indicated in panel A. TOP3Accs were detected with anti-TOP3A antibody. c U2OS cells expressing FLAG-tagged TOP3A-R364W after 48 h transfection were pre-extracted, fixed and analyzed by confocal microscopy. Representative images showing TOP3A co‐localization with CDC45, RPA1 and RPA2. TOP3A foci were detected using anti-FLAG antibody. Scale bars: 10 μm. d Upper panel: workflow of the iPOND experiments; click reactions were performed at the end of the 15 min EdU pulse or following thymidine chase. Lower left panels: lysates form mock-transfected (NT), TOP3A-WT- and TOP3A-R364W-transfected cells were immunoblotted with the indicated antibodies. H3 was used as a loading control. Input samples are shown in the right panels. e Quantification of data for the remaining TOP3A signal from 3 independent experiments as shown in Fig. 2D after thymidine chase in cells expressing TOP3A-WT as well as TOP3A-R364W. Chase signal were normalized with respective TOP3A click signal as well as H3 signal. Data represents mean ± SD. P-values were obtained by two-tailed unpaired t-test with Welch’s correction. *p = 0.0105. f Protocol for the experiments shown in g. TOP3A-R364W-transfected U2OS cells were pretreated with 1 µM aphidicolin (APH) for 1 h before cell harvesting and RADAR assays. g Aphidicolin treatment reduces TOP3Accs levels. Left panel: representative slot blot probed with anti-TOP3A antibody. Right panel: quantitation for the three independent experiments as shown on the left panel. Error bar represents mean ± SD. P-values were obtained by Ordinary one-way ANOVA with Dunnett multiple comparisons test. ***Adjusted p-value = 0.0002, ns not significant (Adjusted p-value = 0.8032). Source data are provided as a Source Data file.
Fig. 3
Fig. 3. Trapped TOP3Accs alter DNA replication.
a Schematic representation of the DNA combing assay protocol and representative single molecule images. Nascent DNA was labeled with CldU (30 min) followed by IdU (30 min) in U2OS cells transfected with TOP3A-WT and TOP3A- R338W. Scale bars: 100 μm. b Histogram showing reduced replication fork speed in U2OS cells expressing R364W-TOP3A. c Representative images of a symmetric and an asymmetric replicon observed in DNA combing. Scale bars: 100 μm. d Self-trapping TOP3A-R364W induces asymmetric replication forks in U2OS cells. The values of x and y axis represent replication speed (kb/min) of the right fork and left fork, respectively. The percentages of asymmetric forks from the indicated cells are indicated in red. n = number of forks analyzed. Asymmetric forks were classified as those forks when the difference between length of left forks and right forks emerging from the same origin was greater than 30%. e Histogram showing the percentages of unidirectional (grey), asymmetrical (green) and symmetrical (pink) forks in the indicated cell lines. Histograms represent the sum of replicons measured in two independent experiments. f Newly fired origins are defined as IdU-single labeled (green) fibers. Percentage was calculated from the number of fibers with single green signals divided by the total number of fibers. Error bars indicate the mean value ± SD (n = 3 independent experiments). **p = 0.0078 (two-tailed unpaired t-test with Welch’s correction). g Representative flow cytometry plots. U2OS cells transfected as indicated were pulse-labeled with EdU for the last 30 min before harvesting. NT mock transfected. The percentage of replicating (EdU and DAPI-positive) cells measured by BD FACS analysis software is shown in the red text. ES: early-S, MS: mid-S, LS: late-S. h A bar plot showing the percentages of EdU positive cells (ES, MS, and LS) from three independent experiments as shown in g. Error bars represents mean value ± SD. ns = not significant (Adjusted p-value = 0.5304) ****Adjusted p-value < 0.0001 (Two-way ANOVA with Tukey’s multiple comparisons test). Source data are provided as a Source Data file.
Fig. 4
Fig. 4. Self-trapping R364W-TOP3A causes DNA damage and genome instability.
a Representative images of colony formation assays in HEK293 cells after transfection with TOP3A-R364W, TOP3A-WT or NT; mock transfected (left). Quantitative representation of colony formation assays as shown in left panel (right). Percent of colony formation efficiency was calculated as the percentage of surviving cells after TOP3A plasmids transfection relative to the number of seeded cells of each cell types. Data are provided as means ± SD (n = 3 biological replicates). Ordinary one-way ANOVA with Dunnett multiple comparisons test. ns = not significant (Adjusted p-value = 0.9825), ***Adjusted p-value = 0.0006 (NT vs TOP3A R364W), ***Adjusted p-value = 0.0007 (TOP3A WT vs TOP3A R364W). b Representative confocal microscopy images of TOP3A and RAD51 immunostaining of U2OS cells transfected with the indicated constructs. TOP3A was detected with anti-FLAG antibody. Scale bar: 10 μm. c Quantification of mean RAD51 foci number per nucleus from three independent experiments as shown in panel B. Data represents mean ± SD. Two-tailed unpaired t-test with Welch’s correction. *p = 0.0125. d Quantification of the percentage of cells displaying colocalization of TOP3A and RAD51 from three independent experiments as shown in panel B. Data represents mean ± SD. Two-tailed unpaired t-test with Welch’s correction. *p = 0.0132. e Representative confocal microscopy images of gamma-γH2AX immunostaining of U2OS cells transfected with the indicated constructs. Scale bar: 10 μm. f Trapped TOP3A induces γH2AX in U2OS cells transfected with the indicated constructs. Fluorescence intensities of γH2AX signal per nucleus were analyzed by Image J. Data are the mean ± SD (n = 102 cells for NT and TOP3A WT both, and n = 101 cells for TOP3A R364W). Two-tailed unpaired t-test with Welch’s correction. ****p < 0.0001 (TOP3A WT vs TOP3AR364W), ns = not significant (p > 0.9999). g Trapped TOP3A induces DNA damage response (DDR). U2OS cells were transfected as indicated and analyzed by Western blotting with the indicated antibodies. h Representative images of TOP3A-R364W-transfected U2OS cells displaying genome instability markers (CB chromatin bridges, LC lagging chromosomes, and UFB ultra-fine bridges) in anaphase stage. Cells were arrested in prometaphase with nocodazole for 3 h and released for 45 min. CB and LC were stained with DAPI, and UFB with PICH. Scale bar: 10 μm. i Quantification of CB, LC and UFB in anaphase B (late anaphase) cells in experiments as shown in h. Each data point is the mean of 3 independent experiments ±SD. Two-way ANOVA with Dunnett’s multiple comparisons test. ***Adjusted p-value = 0.0009 (CB: TOP3A-WT vs TOP3A-R364W), ****Adjusted p-value < 0.0001 (UFB: TOP3A-WT vs TOP3A-R364W), ***Adjusted p-value = 0.0002 (LC: TOP3A-WT vs TOP3A-R364W). Source data are provided as a Source Data file.
Fig. 5
Fig. 5. SPRTN promotes the repair of TOP3Accs.
a HCT116 cells were transfected with the indicated constructs. Whole-cell lysates were immunoblotted with the indicated antibodies. GAPDH was used as loading control. NT mock transfected. b HCT116 cells were transfected with either siControl or siSPRTN. After 24 h, they received an additional transfection with the indicated TOP3A constructs and were harvested at 72 h for RADAR assays. Representative slot blot image is shown using anti-TOP3A antibody to detect TOP3Accs. Quantitation is under the image. Error bar represents mean ± SD (n = 3 independent experiments). Two-tailed unpaired t-test with Welch’s correction. **p = 0.0025. c Domain architecture of human SPRTN. The catalytic site glutamic acid residue (E112) is noted as black arrow. SprT the metalloprotease domain, ZBD Zinc binding domain, SHP p97 or VCP-binding motif, PIP PCNA interaction peptide, and UBZ ubiquitin-binding zinc finger. d Ectopic expression of active full-length SPRTN reduces TOP3Accs. HCT116 cells co-transfected with SPRTN-WT and the indicated mutant plasmids (E112A and ΔUBZ) and TOP3A-R364W were harvested for RADAR assays with anti-TOP3A antibody. A representative slot blot image is shown. Error bar represents mean ± SD (n = 3 independent experiments). Quantitation is plotted under the gel image. Ordinary one-way ANOVA with Dunnett multiple comparison test. ****Adjusted p-value ≤ 0.0001 (NT vs SPRTN-WT), **Adjusted p-value = 0.0025 (SPRTN-WT vs SPRTN-E112A), ***Adjusted p-value = 0.0006 (SPRTN-WT vs SPRTN-ΔUBZ). e EGFP immunoprecipitation (IP) of HCT116 cells transfected both with EGFP‐SPRTN and FLAG- TOP3A-R364W under denaturing conditions was followed by immunoblotting with FLAG and EGFP antibodies. Cells were lysed and chromatin fractions were immunoprecipitated with S-protein agarose beads. Immunoblotting was performed with the indicated antibodies. f Ubiquitination of cellular TOP3Accs. RADAR assay samples were prepared from mock-transfected (NT) U2OS cells or U2OS cells transfected with FLAG-tagged TOP3A-WT or TOP3A-R364W plasmid constructs for 48 h. Equal amounts (3 μg DNA) of RADAR assay samples were digested with benzonase nuclease, ran on SDS-PAGE, and immunoblotted with anti-Ubiquitin (Ub) and anti-TOP3A antibodies. Source data are provided as a Source Data file.
Fig. 6
Fig. 6. MRE11 and TDP2 repair TOP3Accs in parallel pathways.
a Epistatic relationship between SPRTN and TDP2. Left panel: representative slot-blot. WT and TDP2-/- HCT116 cells were transfected with the indicated TOP3A plasmid constructs for 48 h and co-transfected with either siControl or siSPRTN for 72 h. TOP3Accs were detected by RADAR assay with anti-TOP3A antibody. Right panel: Quantitation of TOP3Accs from three independent RADAR assays as shown in left panel. NT; mock transfected. Error bar indicates mean ± SD. Ordinary one-way ANOVA with Dunnett multiple comparison test. **Adjusted p-value = 0.0083 (Wild-type vs TDP2-/-), **Adjusted p-value = 0.0013 (Wild-type vs siSPRTN), ***Adjusted p-value = 0.0009 (Wild-type vs siSPRTN/TDP2-/-). b Representative images of colony formation assays in indicated genotypes of HCT116 cells after transfection with TOP3A-R364W. Lower panel: quantification of the data from experiments as shown in upper panel. Clonogenic survival histogram data of each cell types were presented after normalized with their respective colony formation efficiency in TOP3A-WT transfection condition. Error bar represents data mean ± SD (n = 3 independent experiments). Ordinary one-way ANOVA with Dunnett multiple comparison test. ****Adjusted p-value = <0.0001 (Wild-type vs TDP2-/-, Wild-type vs siSPRTN, Wild-type vs siSPRTN/TDP2-/-). c Model for the coordinated processing of TOP3Accs by SPRTN and TDP2. d Additive effects of MRE11 and TDP2 on TOP3Accs. WT and TDP2-/- HCT116 cells were transfected with the indicated TOP3A plasmid constructs for 48 h and co-transfected with either siControl or siMRE11 for 72 h. Representative slot blot of RADAR assay samples probed with anti-TOP3A antibody. Quantitation is shown to the right of slot-blot images. Error bar indicates the mean value ± SD (n = 3 independent experiments). Ordinary one-way ANOVA with Dunnett multiple comparison test. *Adjusted p-value = 0.0380 (Wild-type vs siMRE11), *Adjusted p-value = 0.0324 (Wild-type vs TDP2-/-), ****Adjusted p-value = <0.0001 (Wild-type vs siSPRTN/TDP2-/-). e Representative images of colony formation assays in indicated genotypes of HCT116 cells after transfection with TOP3A-R364W. Lower panel: quantification of the data from experiments as shown in upper panel. Clonogenic survival histogram data of each cell types were presented after normalized with their respective colony formation efficiency in TOP3A-WT transfection condition. Error bar represents data mean ± SD (n = 3 independent experiments). Ordinary one-way ANOVA with Dunnett multiple comparisons test. ****Adjusted p-value = <0.0001 (Wild-type vs siMRE11, Wild-type vs TDP2-/-, Wild-type vs siMRE11/TDP2-/-). f, g Effects of ATM, CtIP and TDP2 on TOP3Accs. WT and TDP2-/- HCT116 cells were transfected with the indicated TOP3A plasmid constructs for 48 h. WT cells were co-transfected with either siControl or siCtIP for 72 h. Before harvest, cells were treated with either DMSO or the ATM inhibitor (ATMi) KU-55933 (20 μM) for 2 h. Protein-DNA adducts were isolated by RADAR assay and dot blotted with anti-TOP3A antibody. Representative slot blots are shown with quantitation of TOP3Accs to the right of each panel. Error bar represents data mean ± SD (n = 3 independent experiments). Ordinary one-way ANOVA with Dunnett multiple comparison test. *Adjusted p-value = 0.0463 (Wild-type vs TDP2-/-), *Adjusted p-value = 0.0109 (Wild-type vs Wild-type+ATMi), ****Adjusted p-value = <0.0001 (TDP2-/- + ATMi) for (f) and **Adjusted p-value = 0.0079 (Wild-type vs siCtIP), **Adjusted p-value = 0.0035 (Wild-type vs Wild-type+ATMi), **Adjusted p-value = 0.0084 (Wild-type vs siCtIP + ATMi) for g. Source data are provided as a Source Data file.
Fig. 7
Fig. 7. Proposed model for parallel pathways resolving stalled cellular TOP3Accs.
a–c Differential roles of SPRTN, MRE11 and TDP2 for TOP3Accs repair as a function of cell cycle. U2OS cells were transfected with either siControl or siSPRTN (a), siMRE11 (b), siTDP2 (c) followed by co-transfection with TOP3A-R364W. Cells (in S and G2/M phase) were collected after synchronization by double-thymidine block. RADAR assays were performed with anti-TOP3A antibody. Representative slot-blot images are shown. Quantitation from three independent RADAR assays is shown to the bottom of slot blot images. Error bar indicates mean ± SE. Statistical significance was determined by two-way ANOVA with Sidak’s multiple comparisons test. ****Adjusted p-value ≤ 0.0001(siControl vs siSPRTN: S-phase, siControl vs siTDP2: S-phase, siControl vs siMRE11: G2/M-phase), **Adjusted p-value = 0.0016 (siControl vs siSPRTN: G2/M-phase), nsAdjusted p-value = 0.0903 (siControl vs siMRE11: S-phase), nsAdjusted p-value = 0.3247 (siControl vs siTDP2: G2/M-phase). Source data are provided as a Source Data file. d Left, throughout S-phase (left), trapping of TOP3A at replication forks induces the recruitment of SPRTN. Debulking of TOP3Accs by SPRTN allows TDP2 to excise the TOP3A peptide remnants linked to DNA. Single-ended double-strand breaks (seDSBs) ultimately require homology-directed recombination (HDR) to ensure replication fork progression. Right, at the end of replication and in G2 phase, MRE11 endonucleolytic cleavage removes TOP3Accs from single-strand break sites without needing debulking. MRE11 works together with CtIP. Phosphorylation of CtIP by ATM activates MRE11 for nucleolytic excision of TOP3Accs.

Similar articles

Cited by

References

    1. Pommier, Y., Nussenzweig, A., Takeda, S. & Austin, C. Human topoisomerases and their roles in genome stability and organization. Nat. Rev. Mol. Cell Biol.23, 407–427 (2022). - PMC - PubMed
    1. Tse YC, Kirkegaard K, Wang JC. Covalent bonds between protein and DNA. Formation of phosphotyrosine linkage between certain DNA topoisomerases and DNA. J. Biol. Chem. 1980;255:5560–5565. doi: 10.1016/S0021-9258(19)70666-8. - DOI - PubMed
    1. Wang JC. DNA topoisomerases: why so many? J. Biol. Chem. 1991;266:6659–6662. doi: 10.1016/S0021-9258(20)89545-3. - DOI - PubMed
    1. Pommier Y, Marchand C. Interfacial inhibitors: targeting macromolecular complexes. Nat Rev. Drug Discov. 2011;11:25–36. doi: 10.1038/nrd3404. - DOI - PMC - PubMed
    1. Bizard AH, Hickson ID. The many lives of type IA topoisomerases. J. Biol. Chem. 2020;295:7138–7153. doi: 10.1074/jbc.REV120.008286. - DOI - PMC - PubMed

Publication types