. 2023 Apr 6;14(1):1924.
doi: 10.1038/s41467-023-37350-x.

Intercellular exchange of Wnt ligands reduces cell population heterogeneity during embryogenesis

Affiliations

Intercellular exchange of Wnt ligands reduces cell population heterogeneity during embryogenesis

Yudai Hatakeyama et al. Nat Commun. .

Abstract

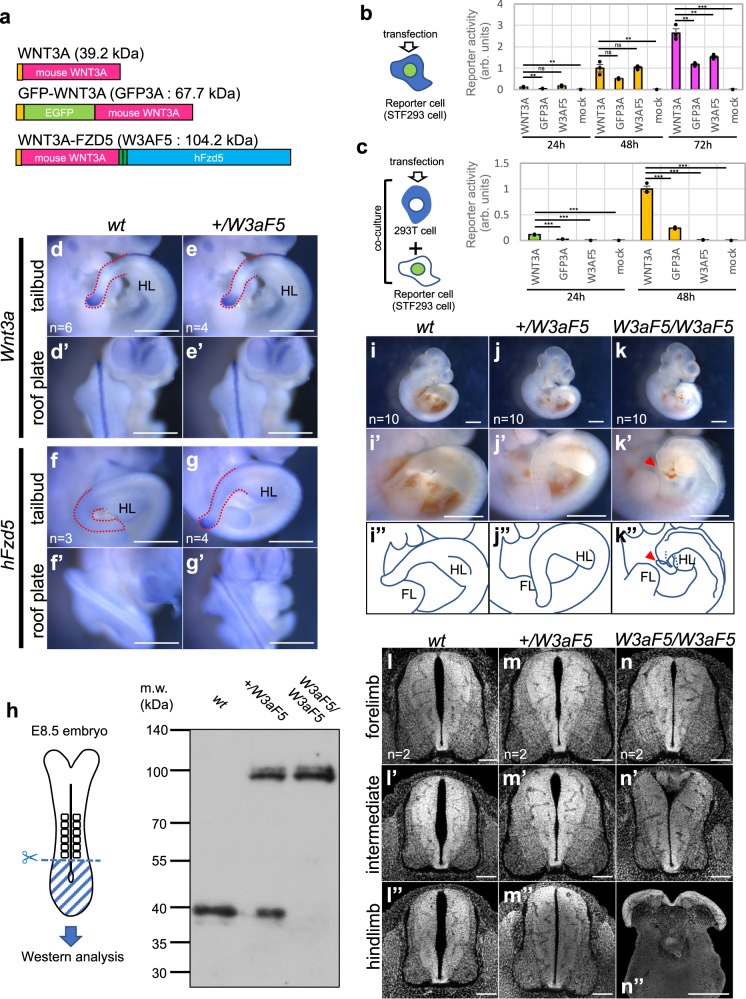
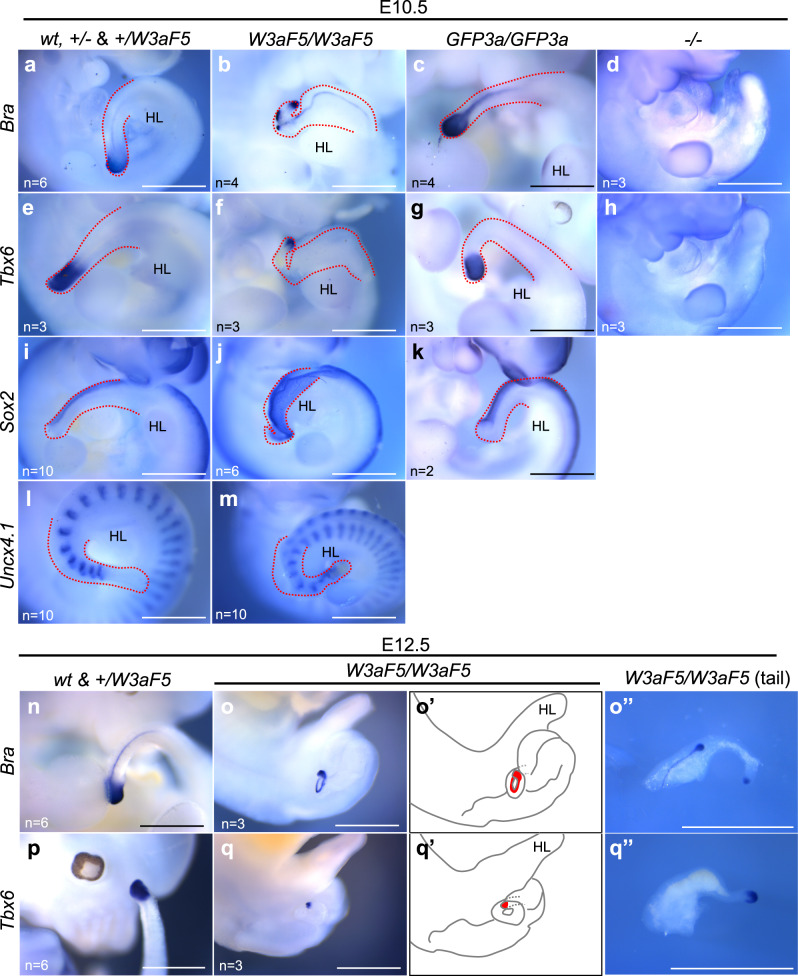
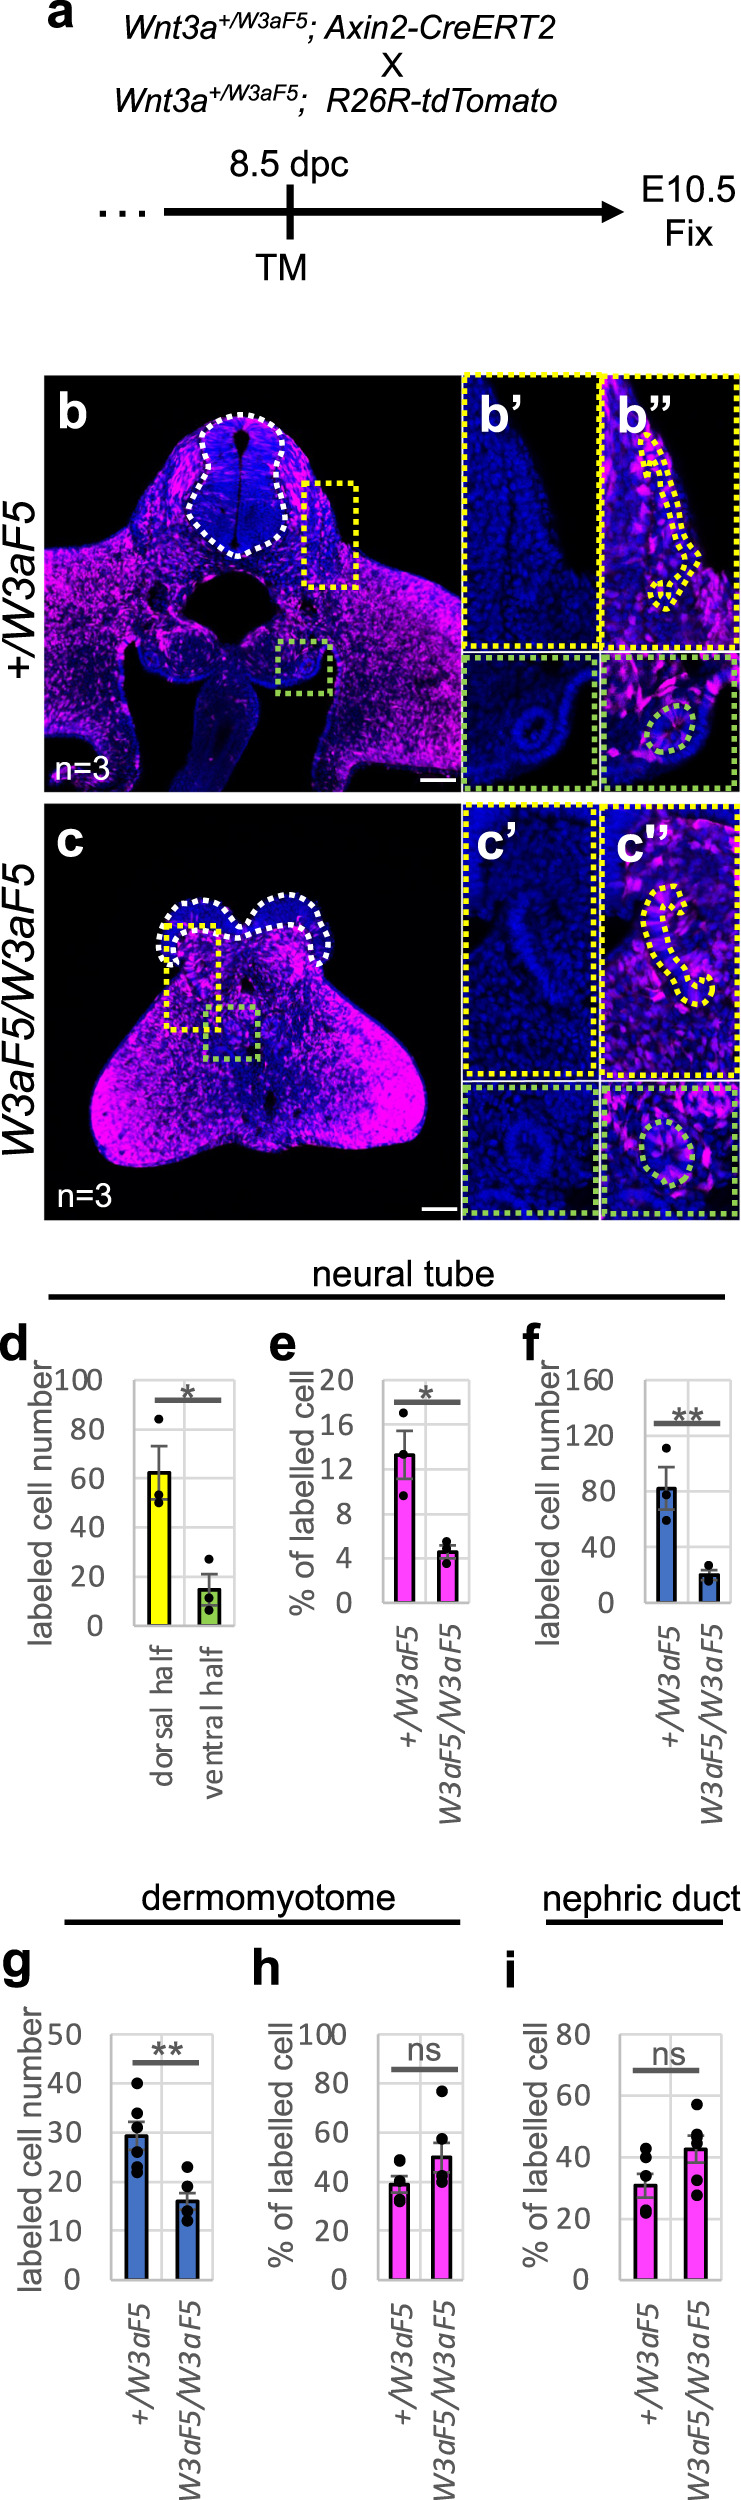
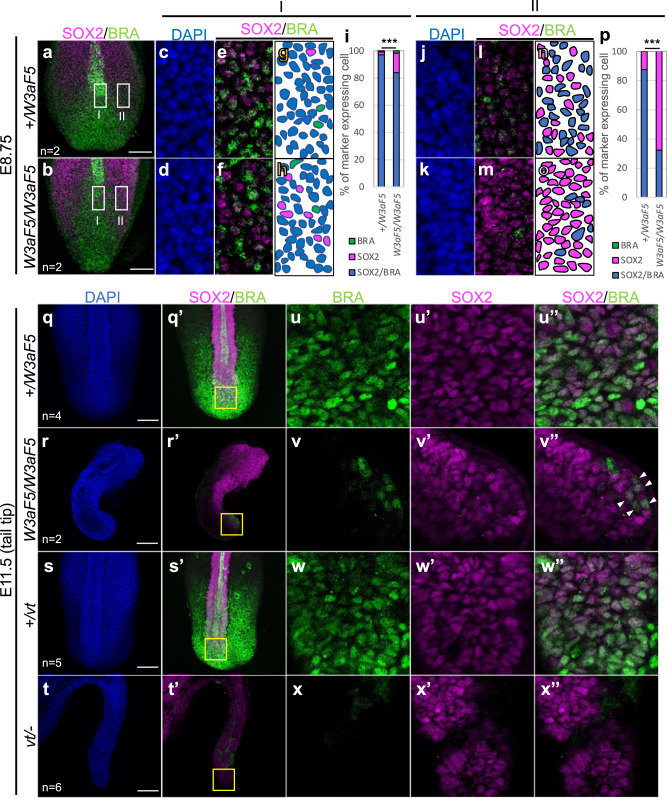
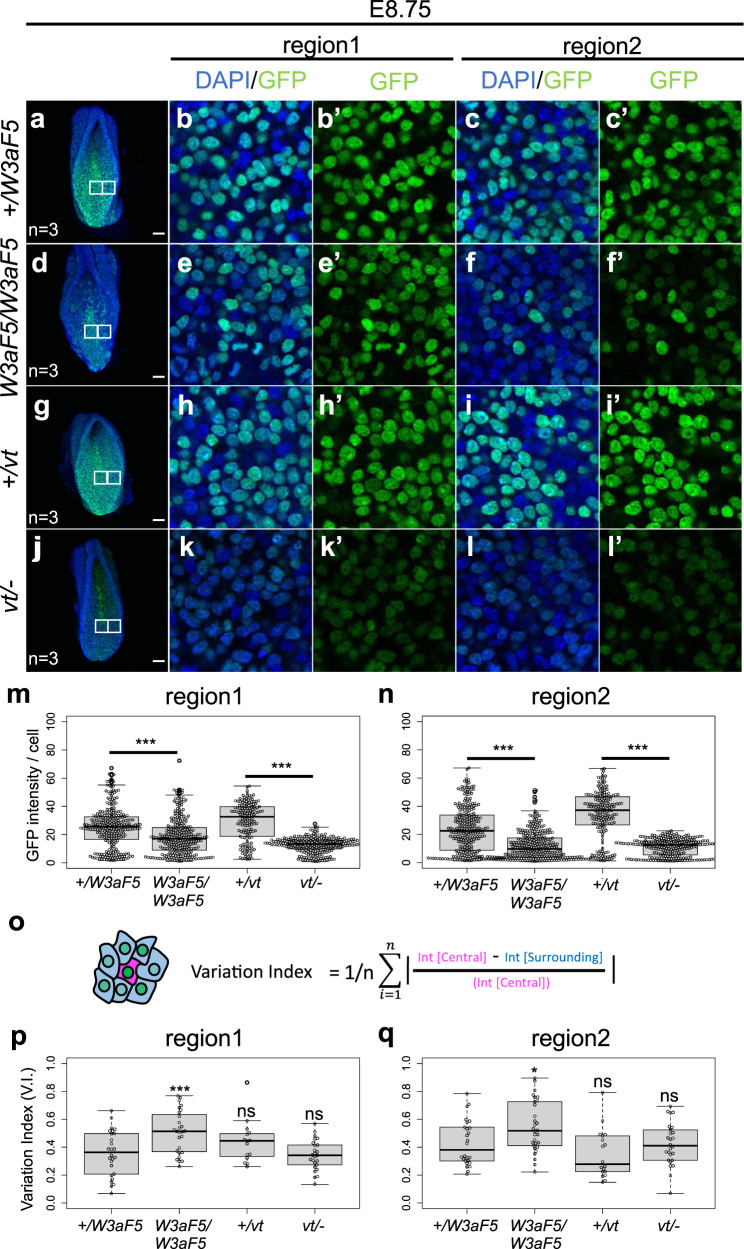
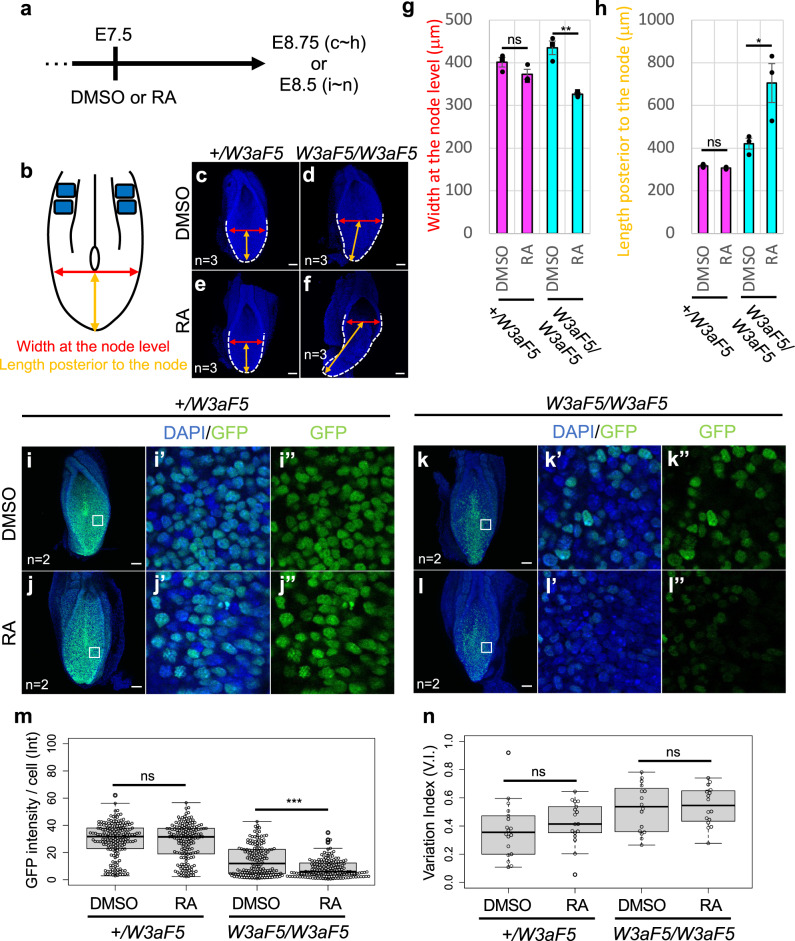
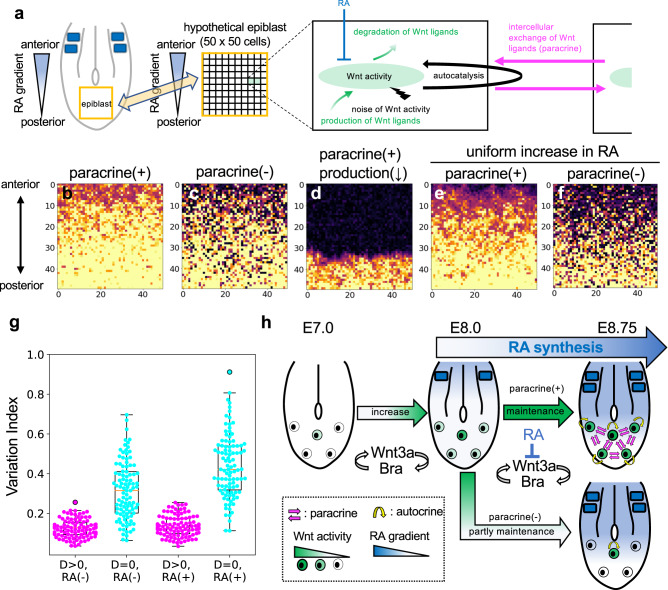
Wnt signaling is required to maintain bipotent progenitors for neural and paraxial mesoderm cells, the neuromesodermal progenitor (NMP) cells that reside in the epiblast and tailbud. Since epiblast/tailbud cells receive Wnt ligands produced by one another, this exchange may average out the heterogeneity of Wnt signaling levels among these cells. Here, we examined this possibility by replacing endogenous Wnt3a with a receptor-fused form that activates signaling in producing cells, but not in neighboring cells. Mutant mouse embryos show a unique phenotype in which maintenance of many NMP cells is impaired, although some cells persist for long periods. The epiblast cell population of these embryos increases heterogeneity in Wnt signaling levels as embryogenesis progresses and are sensitive to retinoic acid, an endogenous antagonist of NMP maintenance. Thus, mutual intercellular exchange of Wnt ligands in the epiblast cell population reduces heterogeneity and achieves robustness to environmental stress.


Conflict of interest statement

The authors declare no competing interests.

Figures

Fig. 1
Fig. 1. In vitro activity of WNT3A-FZD5 and generation of Wnt3a-Fzd5 knock-in mice.
a Schematic figure of WNT3A-FZD5, comparing it with WNT3A and GFP-WNT3A. b, c Wnt signaling activity of each construct shown in a. Wnt signaling activity was monitored in HEK293T cells stably expressing the Super TOPFlash reporter (STF293 cells). In (b), Wnt activity was monitored at 24, 48, and 72 h after transfection of each plasmid into STF293 cells. In (c), paracrine Wnt activity was monitored in co-cultures of transfected HEK293T cells with STF293 cells at 24 and 48 h after transfection. Units of reporter activity in (b) and (c) are standardized in activity of WNT3A at 48 h after transfection. Data are presented as mean ± S.D. (n = 3 per each condition). Statistical significance was assessed using two-sided Student’s t test; ns (not statistically significant, p  >  0.05), *p  <  0.05, **p  <  0.01, ***p  <  0.001. In (b), WNT3A vs GFP3A p = 0.0078 at 24 h, p = 0.052 at 48 h, p = 0.0021 at 72 h; WNT3A vs W3AF5 p = 0.085 at 24 h, p = 0.85 at 48 h, p = 0.0060 at 72 h; WNT3A vs mock p = 0.0014 at 24 h, p = 0.0047 at 48 h, p < 0.001 at 72 h. dg Expression of Wnt3a-Fzd5 in Wnt3a-Fzd5 heterozygous (+/W3aF5) embryos. Whole-mount in situ hybridization was carried out using probes of mouse Wnt3a (d, e) or human Fzd5 (f, g) in wild-type (d, f) and +/W3aF5 (e, g) embryos at E10.5. Images are highlighted on the tailbud (dg) and the dorsal neural tube (d’, e’, f’, g’). Numbers of stained embryos are indicated by “n = “ in the images. h Western blotting analysis of proteins prepared from E8.5 embryos with anti-mouse Wnt3a antibody. Two independent experiments were repeated with similar results. ik Lateral views of wt (i), +/W3aF5 (j) and W3aF5/W3aF5 (k) embryos at E10.5. (i’), (j’), and (k’) are magnified images of (i), (j), and (k), respectively. (i”), (j”), and (k”) are drawings of the images of (i’), (j’), and (k’), respectively. ln Transverse sections of the neural tube of wt (l, l’, l”), +/W3aF5 (m, m’, m”) and W3aF5/W3aF5 (n, n’, n”) embryos at E11.5. Sections of DAPI-stained embryos at the forelimb (l, m, n), the intermediate between fore and hindlimb (l’, m’, n’) and the hindlimb (l”, m”, n”) levels are shown. Two embryos were examined for each genotype. Scale bars: 1 mm (dg’, ik”), 100 μm (ln”). HL: hindlimb. FL: forelimb.
Fig. 2
Fig. 2. Expression of mesoderm and neural marker genes in Wnt3a-Fzd5 homozygous embryos.
am Expression of mesoderm and neural marker genes in embryos at E10.5. Whole-mount in situ hybridization was carried out using probes of Bra (ad), Tbx6 (eh), Sox2 (ik), and Uncx4.1 (l, m) in wt, Wnt3a+/−, & Wnt3a+/Fzd5 (a, e, i, l), Wnt3aFzd5/Fzd5 (b, f, j, m), Wnt3aGFP3a/GFP3a (c, g, k), and Wnt3a−/−(d, h) embryos at E10.5. Red dotted lines indicate tail regions. nq Expression of mesoderm and neural marker genes in embryos at E12.5. Whole-mount in situ hybridization was carried out using probes of Bra (n, o), and Tbx6 (p, q) in wt & Wnt3a+/Fzd5 (n, p), Wnt3aFzd5/Fzd5 (o, q) embryos at E12.5. Tail regions of stained embryos were cut out and shown in (o”) and (q”). (o’) and (q’) are drawings of the images of (o) and (q), respectively. Numbers of stained embryos are indicated by “n = “ in the images. Scale bars: 1 mm. HL: hindlimb.
Fig. 3
Fig. 3. Differentiation of Wnt-positive progenitor cells in the neural tube and somites in Wnt3a-Fzd5 homozygous embryos.
a Experimental procedure. Cells activated by Wnt signaling express Axin2-CreERT2, and are eternally labeled by expression of tdTomato. Tamoxifen (TM) was injected into pregnant females at 8.5 dpc and embryos were fixed at E10.5. b, c Distribution of tdTomato-labeled cells at the posterior hindlimb level in Wnt3a+/Fzd5 (b) and Wnt3aFzd5/Fzd5 (c) embryos at E10.5. Merged images with DAPI staining are indicated. Magnified images of the dotted yellow and green areas are also indicated without (b’, c’) or with (b”, c”) tdTomato fluorescence. Neural tube and dermomyotome, derived from somite, are outlined with white and orange dotted lines, respectively. Squares framed by green dotted lines indicate the area around the nephric duct. d The percentage of tdTomato-positive cells in dorsal and ventral neural cells of Wnt3a+/Fzd5. ei The percentage of tdTomato-positive cells (e, h, i) and total labeled cell number (f, g) in neural tube (e, f), somite (g, h), and nephric duct (i) at the posterior hindlimb level in Wnt3a+/Fzd5 and Wnt3aFzd5/Fzd5 embryos at E10.5. Numbers or percentages of labeled cells (mean±s.d.) per section are indicated. The photograph (b, c) and data (di) are representative of three independent biological experiments with similar results. Data are presented as mean ± S.D. Statistical significance was assessed using two-sided Student’s t test; ns (not statistically significant, p  >  0.05), *p  <  0.05, **p  <  0.01, ***p  <  0.001. p = 0.019 in (d), p = 0.017 in (e), p = 0.0049 in (f), p = 0.00083 in (g), p = 0.051 in (h), and p = 0.091 in (i). Scale bars: 100 μm.
Fig. 4
Fig. 4. NMP cells in Wnt3a-Fzd5 homozygous embryos.
ap Whole-mount staining of Wnt3a-Fzd5 heterozygous (a, c, e, g, j, l, n) and homozygous (b, d, f, h, k, m, o) embryos at E8.75. Maximum intensity projection images of posterior ends of embryos stained with anti-SOX2 (magenta) and anti-BRA (green) antibodies are shown in (a) and (b). To quantify the number of SOX2/BRA double-positive cells, single-plane images of medial (region I) and lateral (region II) regions were analyzed (cp). These images contain all cells in the frame regions. While region I contain the node-streak border, region II is set 50 μm away from the side of region I. Images of DAPI staining (blue; c, d, j, k), and merged images of staining with anti-SOX2 (magenta) and anti-BRA (green) antibodies (e, f, l, m) are shown. Summarized schematic figures (g, h, n, o) and diagrams (i, p) are also shown. In both region I and II, it was confirmed by two-sided κ-square that the population of SOX2/BRA double-positive cells is significantly decreased in Wnt3a-Fzd5 homozygous embryos (***p < 0.001) . The size of the medial and lateral regions is 50 μm × 100 μm. Two embryos were examined for each genotype. qx Whole-mount staining of Wnt3a+/Fzd5 (q, u), Wnt3aFzd5/Fzd5 (r, v), Wnt3a+/vt (s, w), and Wnt3avt/− (t, x) embryos at E11.5. Maximum intensity projection images of posterior ends of embryos stained with DAPI (blue; qt), and with anti-SOX2 (magenta) and anti-BRA (green) antibodies (q’–t’), are shown. Single-plane images of areas indicated with yellow-lined boxes in (q’–t’) are magnified in (ux), respectively. Images of staining with anti-SOX2 (magenta; ux) and anti-BRA (green; u’–x’) antibodies, as well as merged images (u”–x”) are shown. The yellow-lined box is a square with one side = 100 µm. Arrowheads in (v”) indicate a small number of SOX2/BRA-positive cells. Note that there are no SOX2 and BRA double-positive cells in Wnt3avt/− (t, x). The number of stained embryos is indicated by “n = “. Scale bars: 100 μm (a, b, qt).
Fig. 5
Fig. 5. Wnt signaling in the epiblast cell population of Wnt3a-Fzd5 homozygous embryos.
Wnt signaling activity in individual epiblast cells was visualized at E8.75 using mouse embryos carrying an Histone2B-GFP-reporter gene, expression of which is specifically activated by Wnt signaling. Wnt signaling activity was monitored in Wnt3a-Fzd5 heterozygous (ac) and homozygous (df) embryos, as well as in +/vt (gi) and vt/- (jl) embryos. In each embryo, magnified images of the areas indicated by boxes are also shown. Magnified images of the region containing the node (region 1) and a lateral region of CLE (region 2) are shown in each genotyped embryo (Areas = 100 × 100 μm). While region 1 contain the node-streak border, region 2 is lateral to region 1. Magnified images were taken in a single confocal plane while others were processed by maximum intensity projection. GFP intensity in individual cells in region 1 and 2 was quantified in each genotyped embryo (m, n). Three embryos were examined for each genotype except for +/vt (2 embryos). Box plots indicate the first and third quartiles and the median. Variation between adjacent cells was also examined (oq). Here, we focused on cells that are in the top 10% of Wnt activity in each framed region, and measured the degree of difference in Wnt activity between such cells and surrounding cells as shown in (o). The degree of difference, called as “variation index” here, is examined for region 1 (p) and 2 (q). Each dot in (p) and (q) indicates variation index around one of cells in the top 10% of Wnt activity. In (m), (n), (p), and (q), the middle, upper, and lower box lines represent the maximum, minimum, median and two quartiles of values in each group and whiskers indicate highest and lowest values no greater than 1.5× interquartile range. Differences were assessed for statistical significance using two-sided Student’s t test; ***p < 0.001; **p < 0.01; ns, not statistically significant (p > 0.05). In (p), +/W3aF5 vs W3aF5/W3aF5 p = 0.0010, +/W3aF5 vs +/vt p = 0.12, +/W3aF5 vs vt/− p = 0.69, in (q) +/W3aF5 vs W3aF5/W3aF5 p = 0.015, +/W3aF5 vs +/vt p = 0.13, +/W3aF5 vs vt/− p = 0.87. The number of examined embryos is indicated by “n = “. Scale bars: 100 μm.
Fig. 6
Fig. 6. Effect of retinoic acid on the epiblast cell population of Wnt3a-Fzd5 homozygous embryos.
a, b Experimental schemes are shown. c-h Morphological abnormality of RA-treated embryos. Dorsal images of DMSO (c, d) or RA (e, f) treated Wnt3a-Fzd5 heterozygous (c, e) and homozygous (d, f) embryos at E8.75 stained with DAPI (blue). Results of quantification of the width of embryos at the node level (g) and the length posterior to the node (h) in each genotyped embryo are shown. Note that RA treatment enhances the abnormality in gross morphology specifically in Wnt3a-Fzd5 homozygous embryos. Red arrows indicate the width at the node level while orange arrows indicate the length posterior to the node. Data are presented as mean ± S.D. Statistical significance was assessed using two-sided Student’s t test; ns (not statistically significant p  >  0.05), *p  <  0.05, **p  <  0.01, ***p  <  0.001. In (g) +/W3aF5 DMSO vs RA p = 0.16, W3aF5 /W3aF5 DMSO vs RA p = 0.027, and in (h) +/W3aF5 DMSO vs RA p = 0.18, W3aF5 /W3aF5 DMSO vs RA p = 0.047. Scale bars: 100 μm. The number of examined embryos is indicated by “n = “. in Wnt activity in RA-treated embryos. Wnt signaling activity in individual epiblast cells was visualized as shown in Fig. 5. These embryos were treated with RA 7.5 days post-coitus and analyzed at E8.5. Dorsal images, processed by maximum intensity projection of DMSO- (i, k) or RA- (j, l) treated Wnt3a-Fzd5 heterozygous (i, j) and homozygous (k, l) embryos are shown. Images of a single confocal plane in the caudal lateral epiblast of these embryos are also indicated with (i’-l’) and without (i”-l”) DAPI. The size of these areas is 100 μm × 100 μm and their positions in the epiblast are identical to those of the region 2 in Fig. 5f. GFP intensity in individual cells in (i”) - (l”) is summarized in (m). The “variation index” in Wnt activity, as shown in Fig. 5 is also indicated (n). Two embryos were examined for each genotype. In the box and whisker plots, the middle, upper, and lower box lines represent the maximum, minimum, median and two quartiles of values in each group and whiskers indicate highest and lowest values no greater than 1.5× interquartile range. Differences were assessed for statistical significance using a two-sided Student’s t test; ns (not statistically significant p  >  0.05), *p  <  0.05, **p  <  0.01, ***p  <  0.001. In (m), +/W3aF5 DMSO vs RA p = 0.35, W3aF5 /W3aF5 DMSO vs RA p < 0.001, and in (n) +/W3aF5 DMSO vs RA p = 0.88, W3aF5 /W3aF5 DMSO vs RA p = 0.57. In (b), blue squares indicate somites. Scale bars: 100 μm.
Fig. 7
Fig. 7. Mathematical model to examine the effect of intercellular communication in cell populations.
a Schematic diagram showing parameters used in the model. We assumed a virtual space corresponding to the cell sheet of the epiblast. This virtual space is divided into 50 × 50 sections along the antero-posterior and medio-lateral axes. Each section corresponds to a single cell in the epiblast. Wnt activity (W) is determined by parameters such as the rate of production and degradation of Wnt protein, the rate of amplification or reduction by positive feedback, the rate of intercellular exchange of Wnt protein, the rate of inhibition by RA, and fluctuating noise that affects Wnt activity. It is assumed that cell division occurs randomly and that dividing daughter cells are extruded in one section in either the left, right, or anterior direction in a 1:1:2 ratio. bf Spatial patterns of Wnt activity in a virtual sheet of cells. Examples of the spatial pattern in the presence (b, d, e) or absence (c, f) of the paracrine function of Wnt are shown at the same time point (mean division time t = 3.00) after the addition of RA (t = 0). In the condition of d, the Wnt production rate is reduced (see “Methods”). Spatial patterns of Wnt activity were calculated in the absence (bd) and presence (e, f) of uniformly supplied RA. g Variation index was calculated at position 25 and T = TR + 4. Loss of Wnt-mediated cell-to-cell communication increased the variability index (D > 0 vs D = 0 in RA(−)). The variation index was not significantly changed when the RA concentration was uniformly increased in the hypothetical epiblast plane (RA(-) vs RA(+)). In the box and whisker plots, the middle, upper, and lower box lines represent the maximum, minimum, median and two quartiles of values in each group and whiskers indicate highest and lowest values no greater than 1.5× interquartile range. In each condition, 20 independent simulations were performed. h Schematic representation showing the effect of Wnt paracrine in the epiblast cell population.

Similar articles

Cited by

References

    1. Beumer J, Clevers H. Cell fate specification and differentiation in the adult mammalian intestine. Nat. Rev. Mol. Cell Biol. 2021;22:39–53. doi: 10.1038/s41580-020-0278-0. - DOI - PubMed
    1. Chacón-Martínez CA, Koester J, Wickström SA. Signaling in the stem cell niche: regulating cell fate, function and plasticity. Development. 2018;145:dev165399. doi: 10.1242/dev.165399. - DOI - PubMed
    1. Clevers H, Loh KM, Nusse R. Stem cell signaling. An integral program for tissue renewal and regeneration: Wnt signaling and stem cell control. Science. 2014;346:1248012. doi: 10.1126/science.1248012. - DOI - PubMed
    1. Stern CD, et al. Head-tail patterning of the vertebrate embryo: one, two or many unresolved problems? Int. J. Dev. Biol. 2006;50:3–15. doi: 10.1387/ijdb.052095cs. - DOI - PubMed
    1. Tzouanacou E, Wegener A, Wymeersch FJ, Wilson V, Nicolas JF. Redefining the progression of lineage segregations during mammalian embryogenesis by clonal analysis. Dev. Cell. 2009;17:365–376. doi: 10.1016/j.devcel.2009.08.002. - DOI - PubMed

Publication types

LinkOut - more resources