. 2023 Apr 6;14(1):1910.
doi: 10.1038/s41467-023-37598-3.

Tryptase β regulation of joint lubrication and inflammation via proteoglycan-4 in osteoarthritis

Affiliations

Tryptase β regulation of joint lubrication and inflammation via proteoglycan-4 in osteoarthritis

Nabangshu Das et al. Nat Commun. .

Abstract

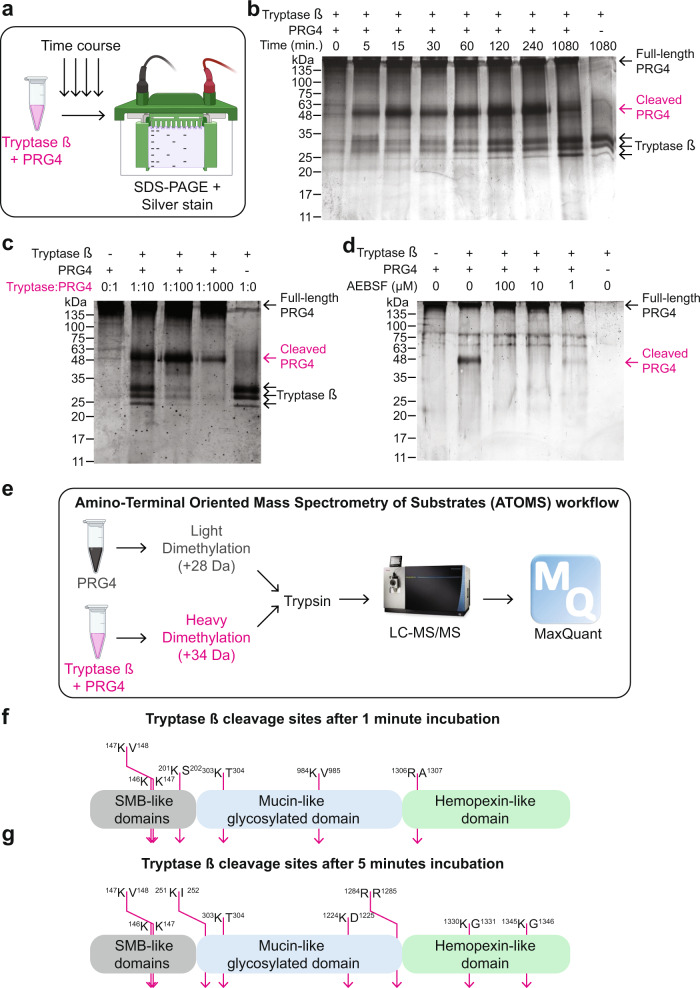
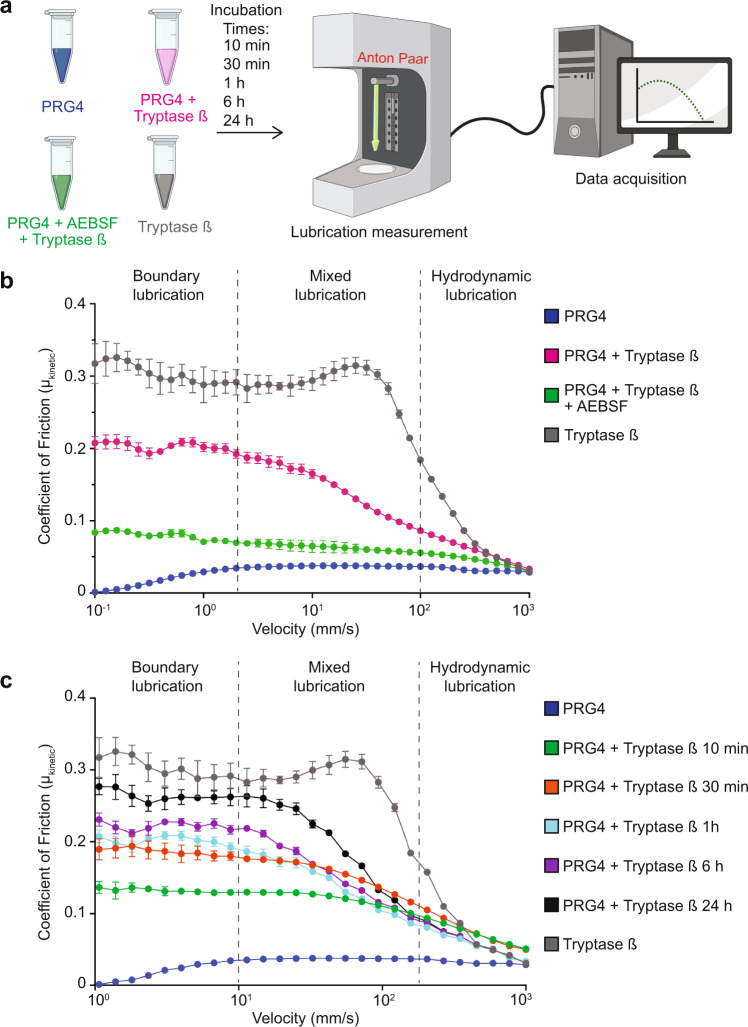
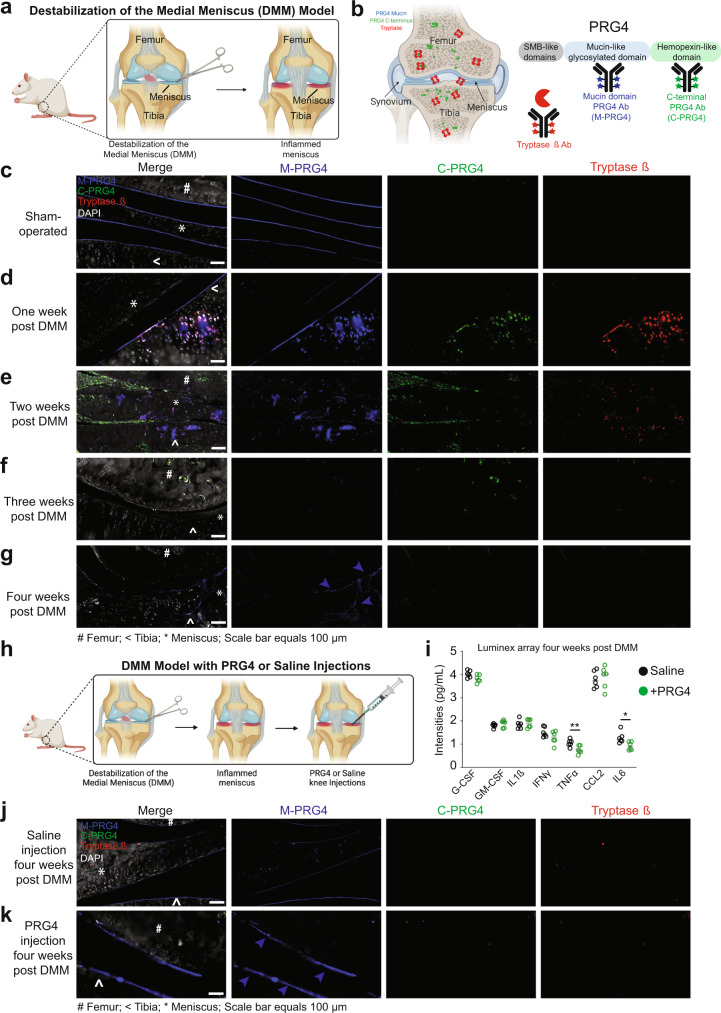
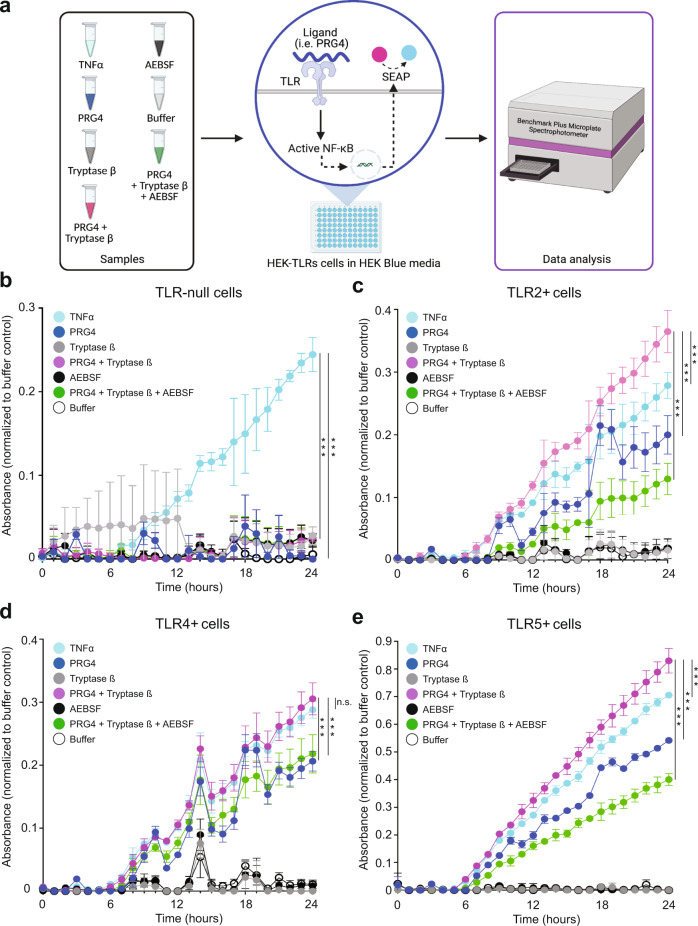
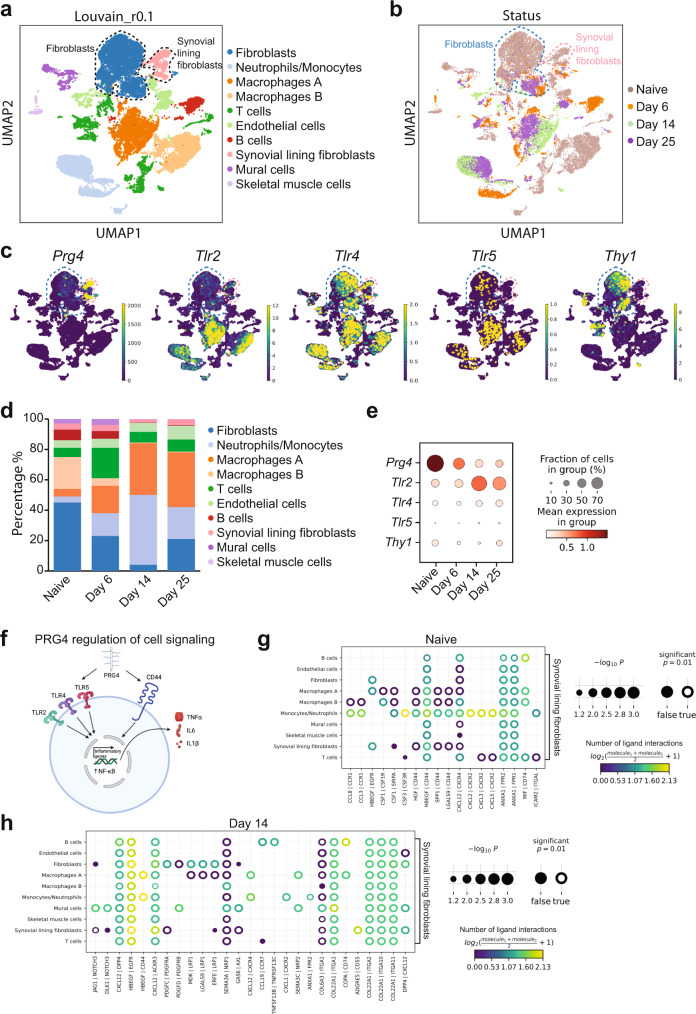
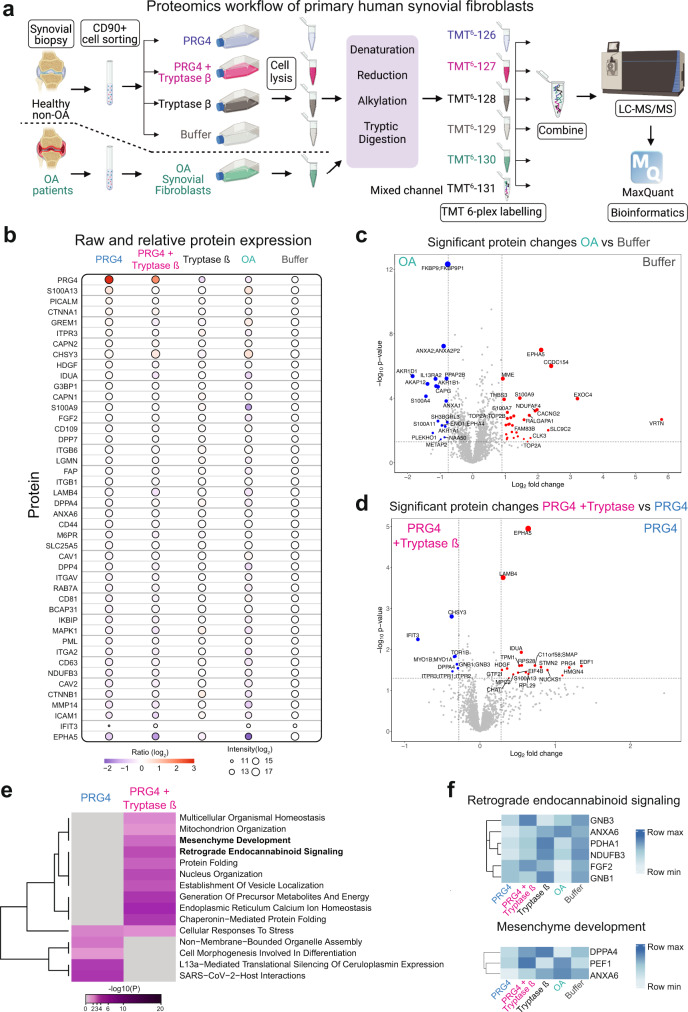
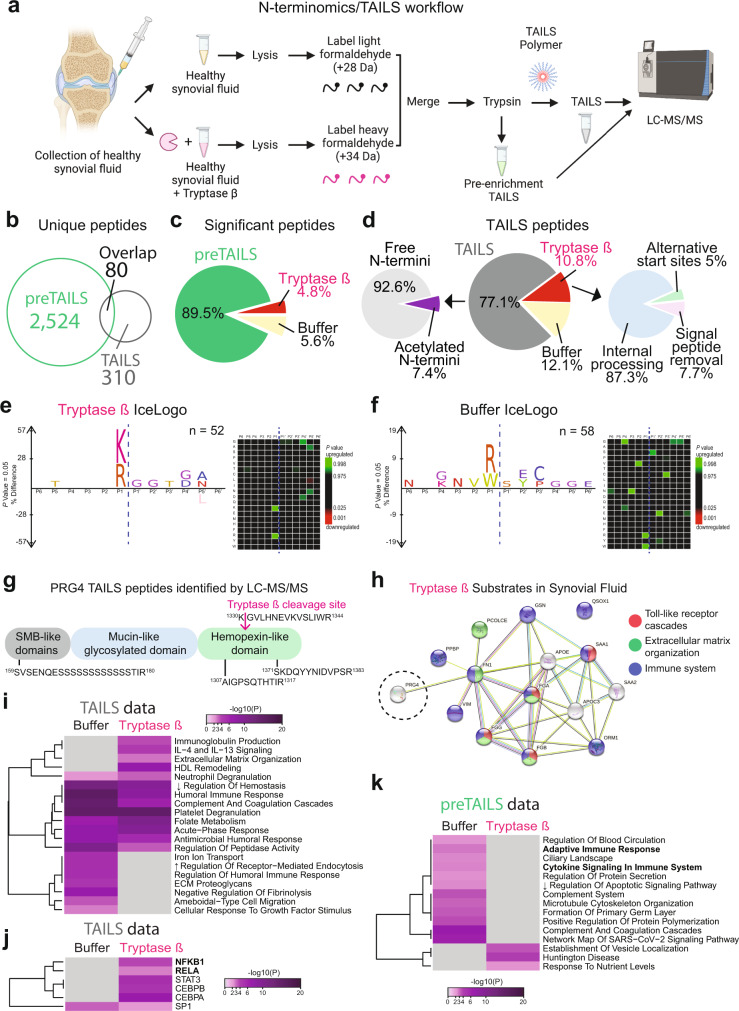
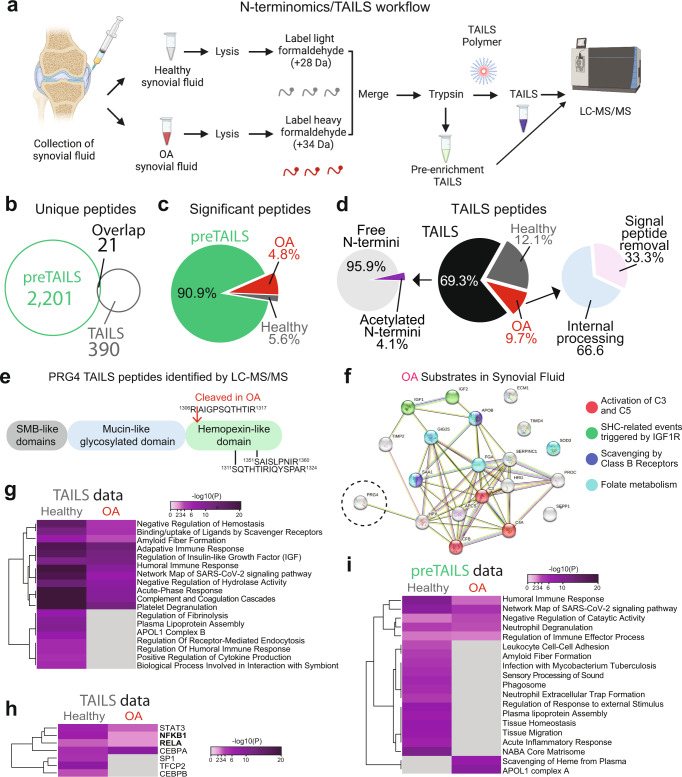
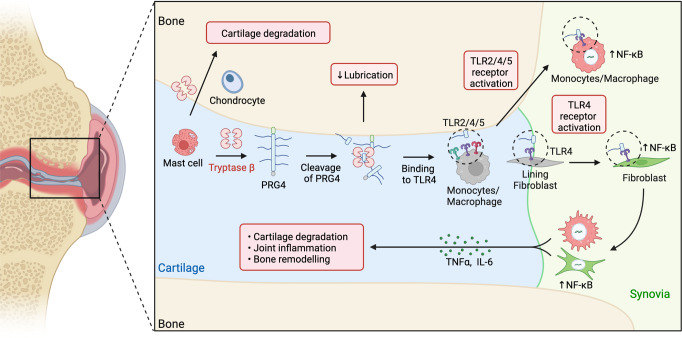
PRG4 is an extracellular matrix protein that maintains homeostasis through its boundary lubricating and anti-inflammatory properties. Altered expression and function of PRG4 have been associated with joint inflammatory diseases, including osteoarthritis. Here we show that mast cell tryptase β cleaves PRG4 in a dose- and time-dependent manner, which was confirmed by silver stain gel electrophoresis and mass spectrometry. Tryptase-treated PRG4 results in a reduction of lubrication. Compared to full-length, cleaved PRG4 further activates NF-κB expression in cells overexpressing TLR2, -4, and -5. In the destabilization of the medial meniscus model of osteoarthritis in rat, tryptase β and PRG4 colocalize at the site of injury in knee cartilage and is associated with disease severity. When human primary synovial fibroblasts from male osteoarthritis patients or male healthy subjects treated with tryptase β and/or PRG4 are subjected to a quantitative shotgun proteomics and proteome changes are characterized, it further supports the role of NF-κB activation. Here we show that tryptase β as a modulator of joint lubrication in osteoarthritis via the cleavage of PRG4.


Conflict of interest statement

T.A.S. and G.D.J. have authored patents on rhPRG4 and hold equity in Lubris LLC, MA, USA. T.A.S. is also a paid consultant for Lubris LLC, MA, USA. R.K. also has authored patents on rhPRG4. All other authors have nothing to disclose.

Figures

Fig. 1
Fig. 1. Investigation of tryptase β-processed PRG4.
a Schematic of the experimental workflow (created with BioRender). b Silver-stained 10% SDS-PAGE gel of in vitro cleavage of human recombinant PRG4 (initial mass of PRG4 1 μg) by human recombinant tryptase β (1:100 enzyme (tryptase)/substrate (PRG4)) incubated at 5, 15, 30, 60, 120, 240 and 1080 min at 37 °C. Magenta arrow indicates cleaved PRG4. This is a representative image of an experiment that was repeated four times with similar results. c Silver-stained 10% SDS-PAGE gel of in vitro cleavage of PRG4 by tryptase at 1:10, 1:100 and 1:1000 of enzyme (tryptase)/substrate (PRG4) ratio incubated for 60 min at 37 °C. Magenta arrow indicates cleaved PRG4. This is a representative image of an experiment that was repeated four times with similar results. d Silver-stained 10% SDS-PAGE gel of in vitro cleavage of PRG4 (initial mass of PRG4 1 μg) by tryptase β at 1:100 of (tryptase)/substrate (PRG4) ratio incubated for 60 min at 37 °C with AEBSF, a serine protease inhibitor at 1, 10 and 100 μM. Magenta arrow indicates cleaved PRG4. This is a representative image of an experiment that was repeated four times with similar results. e Schematic of the ATOMS workflow (created with BioRender). PRG4 was incubated for 5 min. before being subjected to light formaldehyde labeling (CH2O, +28 Da). Tryptase β and PRG4 were incubated for 5 min. before being subjected with deuterated/heavy formaldehyde (CD2O, +34 Da). Both samples were mixed, and trypsin was added before being analyzed on an LC-MS/MS. RAW files data were analyzed by MaxQuant. f Eight different cleavage sites were identified between the heavy dimethylated sample (Tryptase β + PRG4) in comparison to the light dimethylated sample (Tryptase β + PRG4 + AEBSF) after 1 min incubation or g 5 min incubation.
Fig. 2
Fig. 2. Investigation of the lubrication of PRG4 and tryptase β-processed PRG4.
a Schematic of the experimental workflow of the lubrication test (created with BioRender). b Lubrication of tryptase β (grey), PRG4 (initial mass of PRG4 1 μg) (blue), PRG4 + tryptase β for 18 h (1:100 enzyme/substrate) (magenta), PRG4 + tryptase β + 1 mM AEBSF incubated for 18 h (1:100 enzyme/substrate) (green). The error bars denote the error of the mean ± standard deviation as obtained from 5 independent experiments. c Lubrication of PRG4 (initial mass of PRG4 1 μg) (blue), PRG4 + tryptase β incubated for 10 min (green), 30 min (orange), 1 h (pale blue), 6 h (purple), 24 h (black) and tryptase β (grey). The error bars denote the error of the mean ± standard deviation as obtained from 5 independent experiments.
Fig. 3
Fig. 3. Investigation of Tryptase β and PRG4 in the DMM rat model.
a Schematic of the experimental workflow of the destabilization of the medial meniscus (DMM) model (created with BioRender). b Schematic of the three antibodies used for immunofluorescence: tryptase β (red), mucin domain of PRG4 (blue), C-terminal domain of PRG4 (green) (created with BioRender). DAPI is show in white. PRG4 and tryptase staining in rat joints in c uninjured, d one-week post-DMM, e two weeks post-DMM, f three weeks post DMM, and g four weeks post-DMM (n = 15 total, n = 3 per groups). Scale bar = 100 μm. # indicates femur, <indicates tibia and * indicates the meniscus. h Schematic of the experimental workflow of saline and recombinant PRG4 injection (200 μg/kg) in the DMM model. i Multiplex analysis (Luminex xMAP technology) of 7 cytokines/chemokines (G-CSF, GM-CSF, IFNγ, IL1β, TNFα CCL2, and IL6) was used to profile rat serum treated with saline or PRG4 (n = 6 per group). PRG4 and tryptase staining in rat joints four weeks post-DMM in j saline- or k PRG4-injected animals (n = 3 per groups, repeated twice). Scale bar = 100 μm. # indicates femur, <indicates tibia and * indicates the meniscus.
Fig. 4
Fig. 4. NF-κB activation analysis in HEK-TLR reporter cells.
a Schematic of the experimental workflow of HEK-TLRS reported cells in HEK Blue media. Recombinant human (rh)-PRG4 (blue), rhPRG4 + tryptase β (magenta), tryptase β (dark grey), rhPRG4 + tryptase β + AEBSF (green), AEBSF (black), TNFα (pale blue), buffer (light grey) was added to HEK-TLRs cells and monitored over 24 h using the microplate reader for expression of the reporter gene (created with BioRender). All seven conditions were added in b TLR-null cells, c) TLR2−/− cells, d TLR4−/− cells and e TLR5−/− cells. TNFα was used as a positive control and buffer was used as a negative control (n = 3 in b–e). Statistical analysis was determined at 24 h by a two-tailed unpaired Student’s t test. For Fig. 4b–e, *p < 0.05, **, p < 0.01, ***, p < 0.001, and n.s., not significant were used. The error bars denote the error of the mean ± standard deviation as obtained from 3 independent experiments.
Fig. 5
Fig. 5. Single-cell RNA-sequencing analysis of an inflammatory arthritis mouse model.
a Louvain clustering and cell annotation. Using Louvain clustering, we distinguished 10 cell clusters in the mice synovial biopsies with a resolution of 0.1. b Classification included cells based on the disease status, including naive (Day 0), Day 6, Day 14, and Day 25 of glucose-6-phosphate induction (GPI). c The expression pattern of Prg4, Thy1, Tlr2, Tlr4, and Tlr5 in all clusters using UMAP. d Population distribution in percentages of scRNA-seq data of hind paw joint cells isolated at the indicated time points of GPI-induced arthritis. e The expression pattern of Prg4, Thy1, Tlr2, Tlr4, and Tlr5 genes in the synovial fluid based on the status. f Schematic representation of PRG4 and its cell signaling (created with BioRender). g Analysis using the CellPhoneDB method of the crosstalk between the synovial lining fibroblasts in the synovial fluid of naive (Day 0) and h Day 14 groups. For g and h, p values are computed from one-sided permutation test. Adjustments were made for multiple comparisons.
Fig. 6
Fig. 6. Proteomics analysis of primary human synovial fibroblasts from non-OA and OA patients.
a Workflow schematic of proteomics experimental design. Primary human synovial biopsies from non-OA and OA patients were isolated (n = 3 biological replicates, and 2 technical replicates). Primary synovial fibroblasts were sorted using CD90 (THY1). Non-OA primary fibroblasts were treated for 1 hour with PRG4 (blue), tryptase β + PRG4 1:100 enzyme to substrate ratio (magenta), tryptase β + buffer 1:100 (dark grey) or buffer (pale grey). Confluent OA primary fibroblasts were treated with buffer for 1 h (cyan). Next, cell were lysates and isotopically labeled with tandem mass tags (TMT) 6-plex and subjected to LC-MS/MS and analyzed using MaxQuant at 1% FDR. Graphic created using BioRender. b Dot plot analysis of raw and relative protein expression across the five conditions. The log2 ratio is shown as a gradient from blue to red and the log2 intensity of each protein is shown as the size of the circle. c, d Proteins identified by shotgun proteomics are represented as volcano plots. Log2 fold change using an interquartile boxplot analysis is represented on the x-axis and -log10 p value is represented on the y-axis. Two-sided analysis was performed, and it was adjusted for multiple comparisons. The complete list of proteins identified is shown in Supplementary Table 1. e Metascape analysis of different pathways between PRG4 and PRG4 + tryptase β. Accumulative hypergeometric p-values and enrichment factors were calculated and used for filtering as performed as a two-sided analysis. Remaining significant terms were then hierarchically clustered into a tree based on Kappa-statistical similarities among their gene’s memberships. Then, 0.3 kappa score was applied as the threshold to cast the tree into term clusters. f Heatmap of proteins and associated reactome pathways as determined by Metascape. Interquartile box plot and -log10 adjusted p-value analysis was used for statistics. Data analysis was accomplished using the R software. The plot was generated using the heatmap.2 function from the gplots package.
Fig. 7
Fig. 7. Proteomics and N-terminomics/TAILS analyses of synovial fluids treated with buffer or tryptase β.
a Workflow of proteomics experimental design. Human synovial fluids from non-OA patients (n = 7) were incubated for 1 h with buffer or tryptase β at 1:100. Created using BioRender. b The numbers of unique and shared peptides between TAILS and preTAILS analysis. For a complete list, see Supplementary Tables 2–6. c The numbers of statistically changing peptides using an interquartile boxplot analysis between in the preTAILS samples. For a complete list, see Supplementary Table 2. d Left, Distribution of N-terminal peptides in the TAILS enrichment. Middle, statistically changing peptides using an interquartile boxplot analysis. Right, Distribution of post-translational peptide modifications as analyzed using TopFINDER. For a complete list, see Supplementary Tables 5, 6. e Left, peptide sequence profiles of significantly elevated neo-N-terminal peptides in tryptase β-treated synovial fluids identified in the TAILS analysis using IceLogo. f Left, peptide sequence profiles of significantly elevated neo-N-terminal peptides in buffer-treated synovial fluids identified in the TAILS analysis using IceLogo. Significantly (p < 0.05) overrepresented amino acids are shown above, and underrepresented residues are shown below the x-axis. Right, Cleavage sites identified tryptase β-treated synovial fluids are depicted as heat maps from P6 to P6′ residues. Green: Upregulated. Red: Downregulated. Statistical analysis was determined by a two-tailed unpaired Student’s t test and was adjusted for multiple comparisons. g) All identified PRG4 peptides. The 1330K↓G1331 N-termini was significantly elevated in the Tryptase-treated samples. h STRING-db analysis of N-termini elevated in the Tryptase-treated samples from Supplementary Table 6. An enrichment was detected for Toll-like receptor (red), Extracellular matrix organization (green), and Immune system (blue). Metascape i pathway enrichment and j TRRUST analysis of the TAILS data and k) Metascape analysis of the preTAILS data of different pathways between buffer- and tryptase β-treated synovial fluids. Accumulative hypergeometric p-values and enrichment factors were calculated and used for filtering as performed as a two-sided analysis (for i, j and k). Remaining significant terms were hierarchically clustered into a tree based on Kappa-statistical similarities among their gene’s memberships. Then, 0.3 kappa score was applied as the threshold to cast the tree into term clusters.
Fig. 8
Fig. 8. Proteomics and N-terminomics/TAILS analyses of synovial fluids human OA and non-OA patients.
a Workflow schematic of proteomics experiments. Human synovial fluids from healthy/non-OA patients (n = 3) were compared to OA patients (n = 3). Graphic created using BioRender. b The numbers of unique and shared peptides between TAILS and preTAILS analysis. For a complete list, see Supplementary Tables 7–11. c The numbers of statistically changing peptides using an interquartile boxplot analysis between in the preTAILS samples. For a complete list, see Supplementary Table 7. d Left, Distribution of N-terminal peptides in the TAILS enrichment. Middle, The numbers of statistically changing peptides using an interquartile boxplot analysis between in the TAILS samples. Right, Distribution of post-translational peptide modifications, as analyzed using TopFINDER. For a complete list of N-termini identified, see Supplementary Tables 9–11. e All identified PRG4 peptides. The 1306R↓A1307 N-termini was significantly elevated in the OA samples as compared to non-OA/healthy synovial fluid. f STRING-db analysis of all N-termini elevated in the OA samples from Supplementary Table 11. An enrichment was detected for Activation of C3 and C5 (red), SHC-related events triggered by IGF1R (green), Scavenging by Class B Receptors (blue), and Folate metabolism (pale blue). Metascape g pathway enrichment and h TRRUST analysis of the TAILS data and i Metascape analysis of the preTAILS data of different pathways between non-OA/healthy and OA synovial fluids. Accumulative hypergeometric p-values and enrichment factors were calculated and used for filtering as performed as a two-sided analysis (for g, h and i). Remaining significant terms were then hierarchically clustered into a tree based on Kappa-statistical similarities among their gene’s memberships. Then, 0.3 kappa score was applied as the threshold to cast the tree into term clusters.
Fig. 9
Fig. 9. Mechanisms of PRG4 processing by Tryptase β.
Workflow schematic of tryptase β processing of PRG4 resulting in TLR activation and NF-κB activation in human synovial fluids in OA patients. Graphic created using BioRender.

Similar articles

Cited by

References

    1. Sanchez-Lopez E, Coras R, Torres A, Lane NE, Guma M. Synovial inflammation in osteoarthritis progression. Nat. Rev. Rheumatol. 2022;18:258–275. doi: 10.1038/s41584-022-00749-9. - DOI - PMC - PubMed
    1. Waller KA, et al. Role of lubricin and boundary lubrication in the prevention of chondrocyte apoptosis. Proc. Natl Acad. Sci. USA. 2013;110:5852–5857. doi: 10.1073/pnas.1219289110. - DOI - PMC - PubMed
    1. Kapoor M, Martel-Pelletier J, Lajeunesse D, Pelletier J-P, Fahmi H. Role of proinflammatory cytokines in the pathophysiology of osteoarthritis. Nat. Rev. Rheumatol. 2011;7:33–42. doi: 10.1038/nrrheum.2010.196. - DOI - PubMed
    1. Schumacher BL, Block JA, Schmid TM, Aydelotte MB, Kuettner KE. A Novel Proteoglycan Synthesized and Secreted by Chondrocytes of the Superficial Zone of Articular Cartilage. Arch. Biochem. Biophys. 1994;311:144–152. doi: 10.1006/abbi.1994.1219. - DOI - PubMed
    1. Das N, Schmidt TA, Krawetz RJ, Dufour A. Proteoglycan 4: From Mere Lubricant to Regulator of Tissue Homeostasis and Inflammation: Does proteoglycan 4 have the ability to buffer the inflammatory response? BioEssays. 2019;41:e1800166. doi: 10.1002/bies.201800166. - DOI - PubMed

Publication types

Grants and funding