. 2023 Apr 6;14(1):1912.
doi: 10.1038/s41467-023-37614-6.

Nasopharyngeal carcinoma cells promote regulatory T cell development and suppressive activity via CD70-CD27 interaction

Affiliations

Nasopharyngeal carcinoma cells promote regulatory T cell development and suppressive activity via CD70-CD27 interaction

Lanqi Gong et al. Nat Commun. .

Abstract

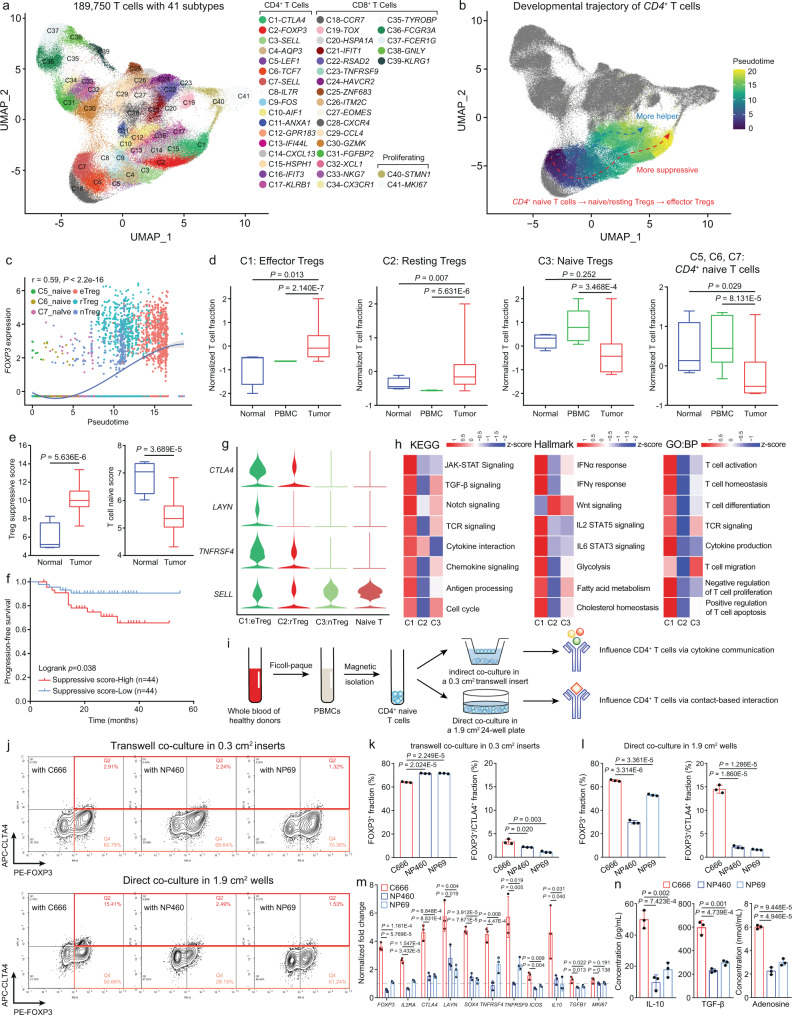
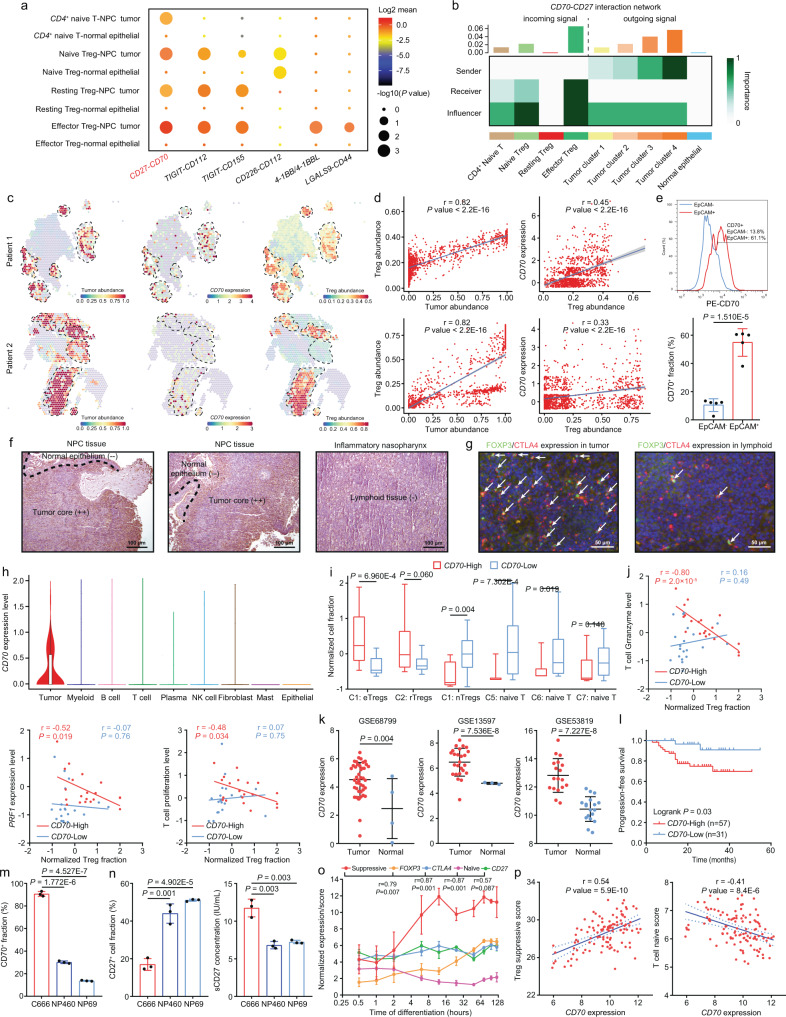
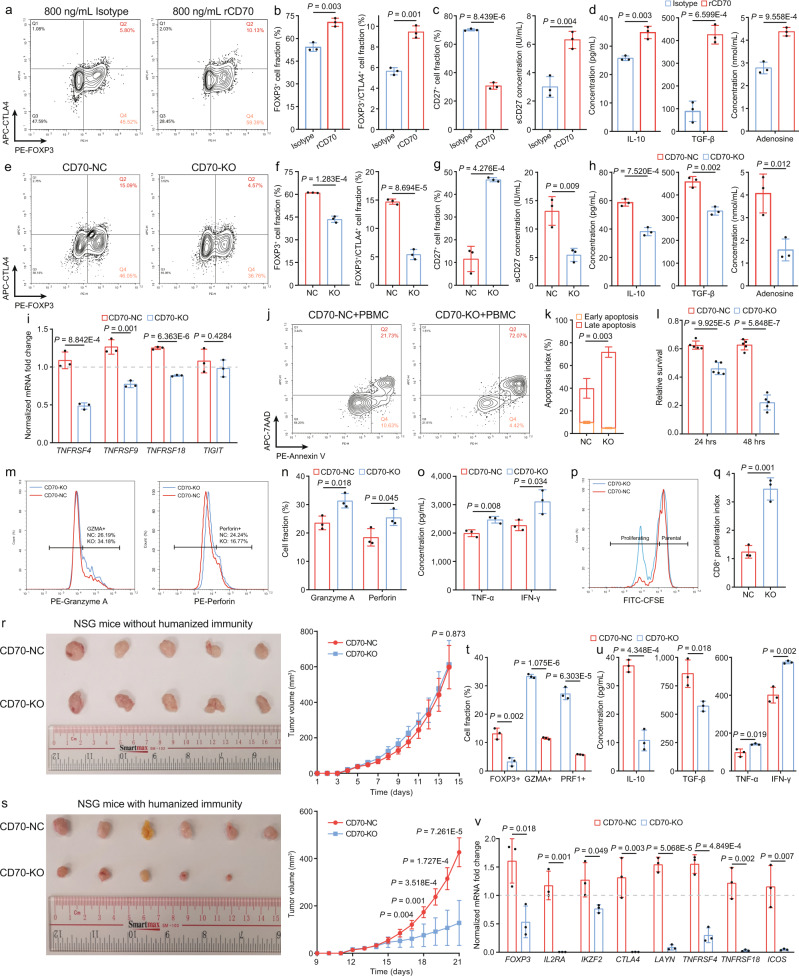
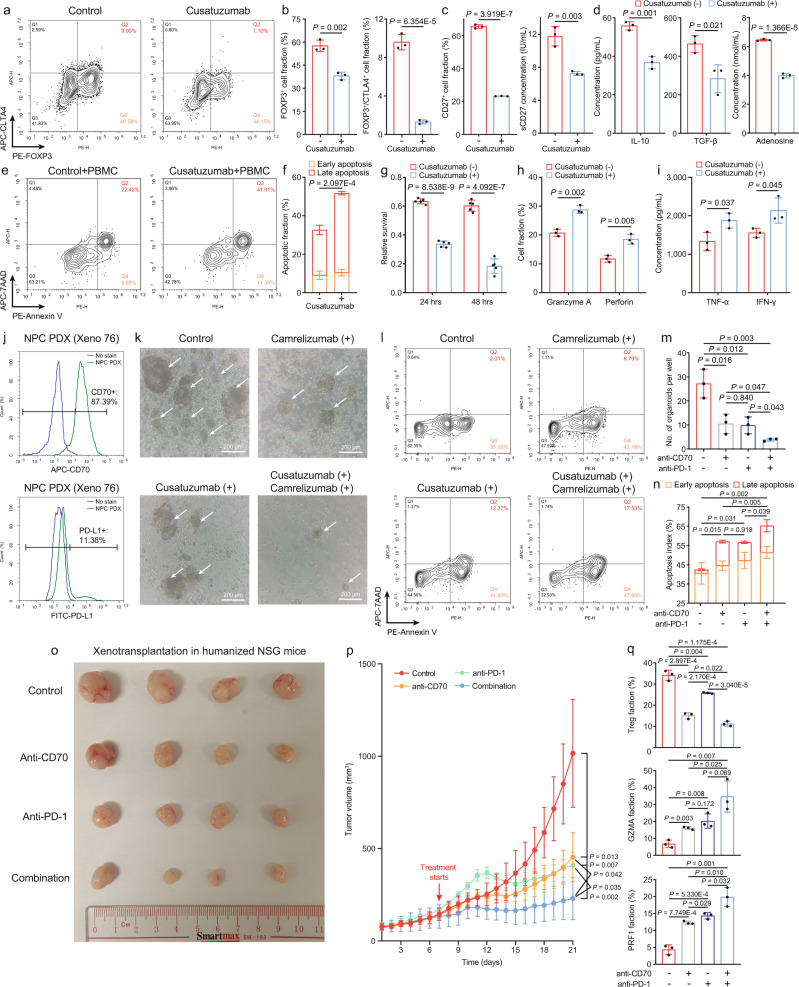
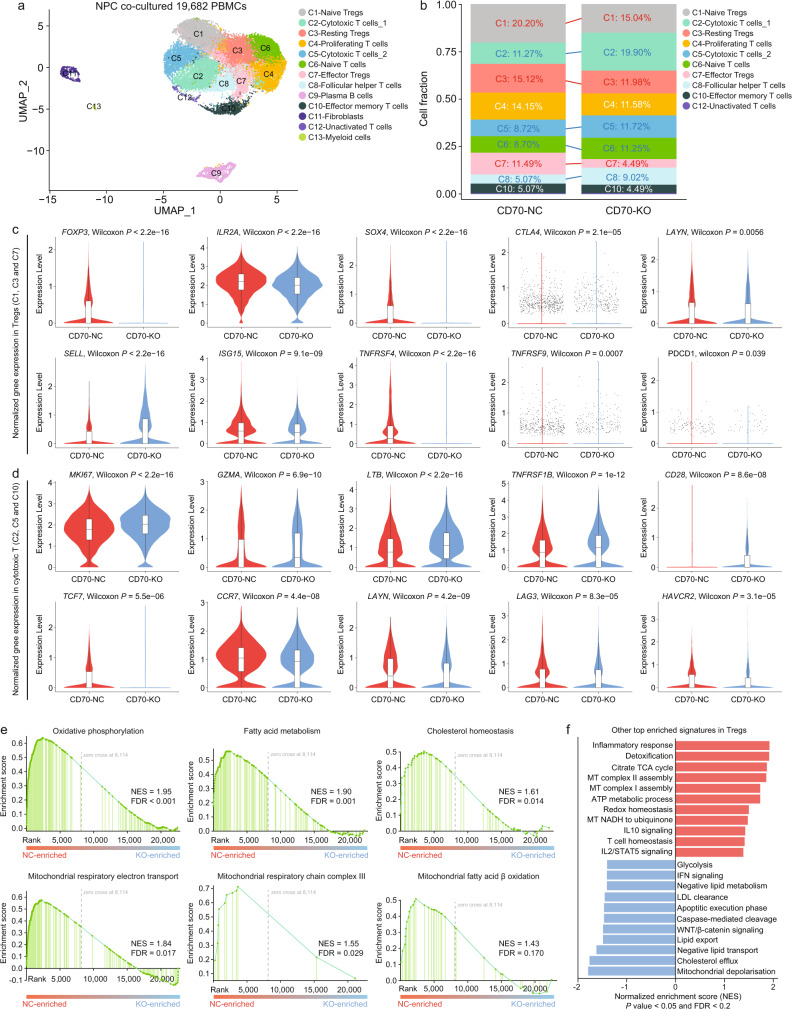
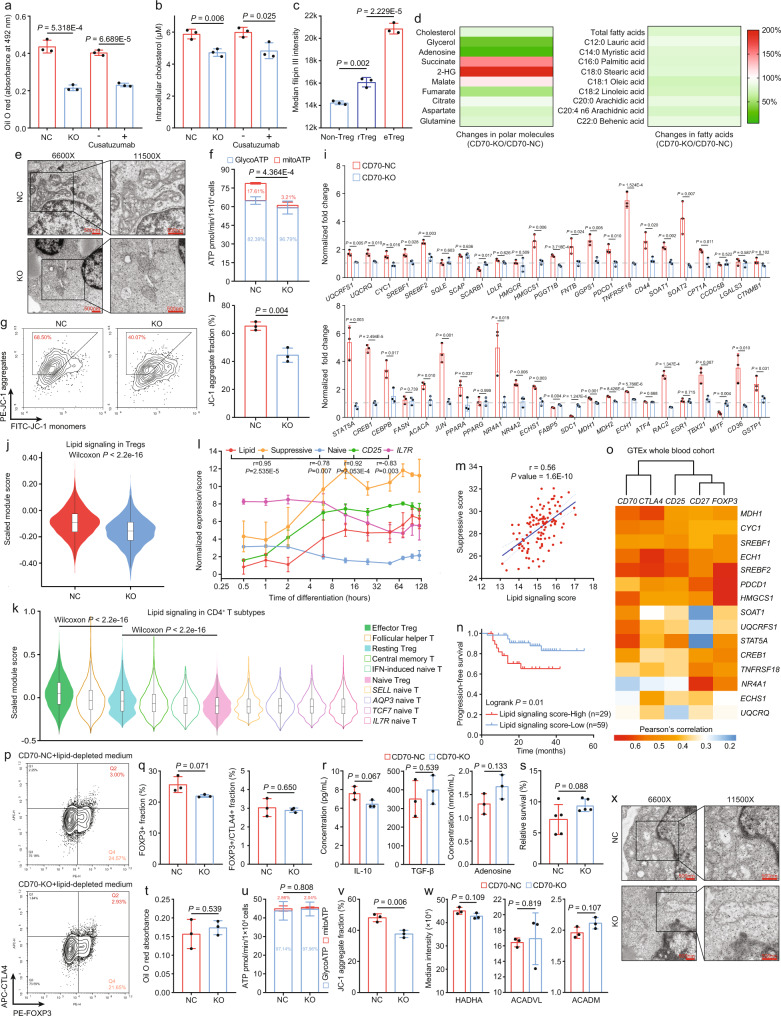
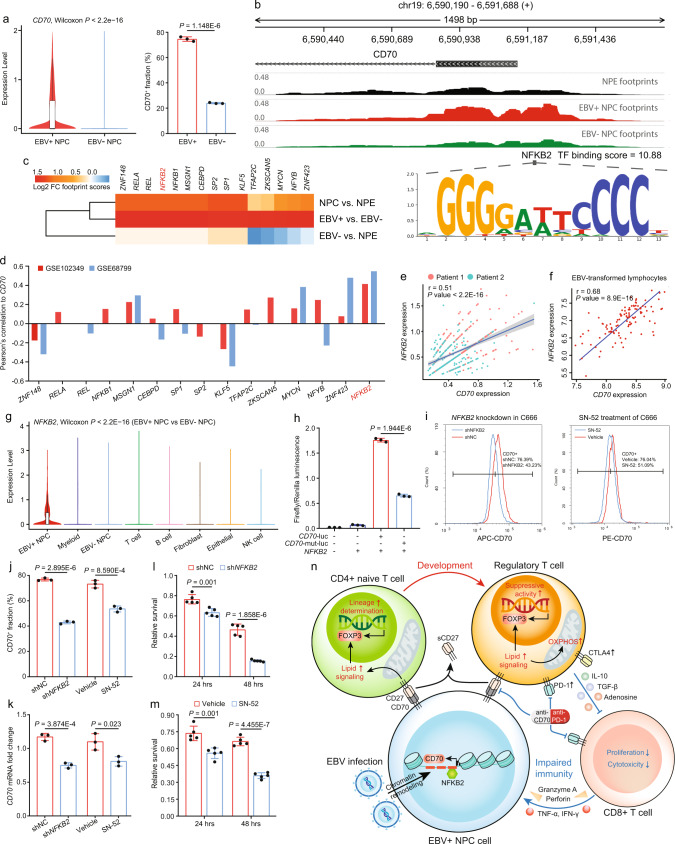
Despite the intense CD8+ T-cell infiltration in the tumor microenvironment of nasopharyngeal carcinoma, anti-PD-1 immunotherapy shows an unsatisfactory response rate in clinical trials, hindered by immunosuppressive signals. To understand how microenvironmental characteristics alter immune homeostasis and limit immunotherapy efficacy in nasopharyngeal carcinoma, here we establish a multi-center single-cell cohort based on public data, containing 357,206 cells from 50 patient samples. We reveal that nasopharyngeal carcinoma cells enhance development and suppressive activity of regulatory T cells via CD70-CD27 interaction. CD70 blocking reverts Treg-mediated suppression and thus reinvigorate CD8+ T-cell immunity. Anti-CD70+ anti-PD-1 therapy is evaluated in xenograft-derived organoids and humanized mice, exhibiting an improved tumor-killing efficacy. Mechanistically, CD70 knockout inhibits a collective lipid signaling network in CD4+ naïve and regulatory T cells involving mitochondrial integrity, cholesterol homeostasis, and fatty acid metabolism. Furthermore, ATAC-Seq delineates that CD70 is transcriptionally upregulated by NFKB2 via an Epstein-Barr virus-dependent epigenetic modification. Our findings identify CD70+ nasopharyngeal carcinoma cells as a metabolic switch that enforces the lipid-driven development, functional specialization and homeostasis of Tregs, leading to immune evasion. This study also demonstrates that CD70 blockade can act synergistically with anti-PD-1 treatment to reinvigorate T-cell immunity against nasopharyngeal carcinoma.


Conflict of interest statement

The authors declare no competing interests.

Figures

Fig. 1
Fig. 1. Polarized CD4+ T naïve-to-Treg development and activation is a tumor-specific characteristic in NPC.
a The UMAP plot of 189,750 T cells with 41 subtypes identified. b The developmental trajectories of CD4+ T cells. c The change of FOXP3 expression through the pseudotime developmental process from CD4+ naïve T cells to three Treg subtypes, modeled by two-sided polynomial regression analysis with the 95% confidence band. d The normalized fractions of CD4+ naïve T cells and three Treg subtypes in NPC tissues (n = 36) versus in NPC peripheral blood (n = 10) or INP tissues (n = 4) (two-sided unpaired t-test). e The Treg suppressive score and T cell naïve score computed from GSE68799 (tumor n = 42, normal n = 3, two-sided unpaired t-test). f The progression-free survival for NPC patients from GSE102349, stratified by the Treg suppressive score (high n = 44, low n = 44, two-sided log-rank test). g Expression of Treg-specific and naïve signatures in CD4+ naïve T cells and Treg subtypes. h Major biological signaling and activities in Treg subtypes computed by GSVA. i Illustration of the in vitro co-culture systems of CD4+ naïve T cells, NPC cells, and NPE cells. jl The fraction of total FOXP3+ Tregs, and FOXP3+/CTLA4 + activated Treg in the co-culture systems (k, transwell co-culture; l, direct co-culture) with C666 versus with NP460 or NP69 cells (n = 3, two-sided unpaired t test). m The normalized mRNA fold change of Treg lineage- and activation-specific markers in CD4+ naïve T cells co-cultured with C666 versus with NP460 or NP69 cells (n = 3, two-sided unpaired t test). n The change of immunosuppressive factors in the co-culture systems with C666 versus with NP460 or NP69 cells (n = 3, two-sided unpaired t test). The n number represents n biologically independent samples/experiments in each group. The data are presented as the mean ± SD (bar plots), median ± IQR (whiskers = 1.5 × IQR, box & whiskers plots), and KDE (violin plots).
Fig. 2
Fig. 2. CD70 + NPC cells contribute to abundant and suppressive Treg infiltration by interacting with CD4+/CD27+ T cells.
a CellPhoneDB revealed enriched ligand-receptor pairs among CD4+ naïve T cells, Tregs, NPC, and NPE cells (two-sided permutation test). b CellChat revealed NPC cells as the sender of CD70-CD27 signaling to CD4+ naïve T cells and Tregs. c Spatial co-localization of NPC cells, Tregs, and CD70 (n = 1089 and 1331). d The Pearson correlation (two-sided) between NPC cells/CD70 expression and Tregs (n = 1089 and 1331). e The CD70+ fractions in EPCAM + NPC cells and EPCAM- cells from NPC biopsies (n = 5, two-sided unpaired t test).IHC (f) and IF staining (g) showed CD70, FOXP3, and CTLA4 expression in NPC, normal epithelium and lymphoid tissues. h Expression of CD70 across cell lineages. i Normalized fractions of Treg and CD4+ naïve subtypes in CD70-high (n = 20) and CD70-low patients (tumor n = 16, normal n = 4) from scRNA-seq data (two-sided unpaired t-test). j The Pearson correlation (two-sided) between the normalized Treg fraction and average expression of granzymes, PRF1, and T-cell proliferation markers in CD70-high (n = 20) and CD70-low patients (tumor n = 16, normal n = 4) from scRNA-seq data. k Normalized CD70 expression in three NPC RNA-seq cohorts. Left: GSE68799 (tumor n = 42, normal n = 3); Middle: GSE13597 (tumor n = 25, normal n = 3); Right: GSE53819 (tumor n = 18, normal n = 18) (two-sided unpaired t test). l The progression-free survival for NPC patients from GSE102349 (high n = 57, low n = 31, two-sided log-rank test). m The fraction of CD70+ cells in C666 cells versus in NP460 or NP69 cells (n = 3, two-sided unpaired t test). n Changes of surface and sCD27 in co-culture systems with C666 versus with NP460 or NP69 cells (n = 3, two-sided unpaired t test). o The change of Treg suppressive and T naïve scores and signatures during induced Treg differentiation (n = 3, two-sided Pearson correlation analysis). p The Pearson correlation (two-sided) between the Treg/T naïve scores and CD70 expression in GSE102349 (n = 112). The n number represents n biologically independent spots/samples/experiments in each group. The data are presented as the mean ± SD (bar plots), median ± IQR (whiskers = 1.5 × IQR, box & whiskers plots), and KDE (violin plots).
Fig. 3
Fig. 3. Genetic ablation of CD70 in NPC cells reverts Treg suppressive activity and enhances CD8+ T cell function in the TME.
a, b Immunophenotyping of CD4+ naïve T cells treated with IgG antibody and recombinant CD70 antibody (rCD70, n = 3, two-sided unpaired t test). c Changes of surface and sCD27 in the co-cultured systems treated with IgG antibody and rCD70 (n = 3, two-sided unpaired t test). d The change of immunosuppressive factors in the IgG-treated and rCD70-treated co-culture systems (n = 3, two-sided unpaired t test). e, f Immunophenotyping of CD4+ naïve T cells co-cultured with CD70-NC and CD70-KO C666 cells (n = 3, two-sided unpaired t test). g Changes of surface and sCD27 in the co-cultured systems with CD70-NC and CD70-KO C666 cells (n = 3, two-sided unpaired t test). h The change of immunosuppressive factors in the CD70-NC and CD70-KO co-culture systems (n = 3, two-sided unpaired t test). i The normalized mRNA fold change of Treg activation-specific markers in CD4+ naïve T cells co-cultured with CD70-NC and CD70-KO C666 cells (n = 3, two-sided unpaired t test).T-cell cytotoxicity measured in the CD70-NC and CD70-KO (j and k, flow cytometry, n = 3; l, XTT assay, n = 5) PBMC co-culture systems (two-sided unpaired t test). The change of CD8+ T-cell cytotoxicity markers (m and n, flow cytometry), cytokines (o, ELISA) and proliferation (p and q, CFSE) in the CD70-NC and CD70-KO PBMC co-culture systems (n = 3, two-sided unpaired t test). (r, s) The CD70-NC and CD70-KO tumor growth (r, n = 5 for NSG mice; s, n = 6 for humanized mice) in immunodeficient NSG and PBMC-engrafted humanized mice (two-sided unpaired t test). The change of immunosuppressive and cytotoxic T cell subtypes (t, flow cytometry), cytokines (u, ELISA), and markers (v, qRT-PCR) in CD70-NC and CD70-KO tumors (n = 3, two-sided unpaired t-test). The n number represents n biologically independent samples/experiments in each group. The data are presented as the mean ± SD (bar plots).
Fig. 4
Fig. 4. Therapeutic inhibition of CD70 promotes anti-tumor immunity and anti-PD-1 efficacy.
a, b Immunophenotyping of CD4+ naïve T cells treated with IgG antibody and cusatuzumab (n = 3, two-sided unpaired t test). c The change of surface and sCD27 in the co-cultured systems treated with IgG antibody and cusatuzumab (n = 3, two-sided unpaired t test). d The change of immunosuppressive factors in the co-cultured systems treated with IgG antibody and cusatuzumab (n = 3, two-sided unpaired t test). T-cell cytotoxicity measured in the IgG-treated and cusatuzumab-treated (e and f, flow cytometry, n = 3; g, XTT assay, n = 5) C666/PBMC co-culture systems (two-sided unpaired t test). The change of CD8 + T-cell cytotoxicity markers (h, flow cytometry) and cytokines (i, ELISA) in IgG-treated and cusatuzumab-treated C666/PBMC co-culture systems (n = 3, two-sided unpaired t test). j Expression of CD70 and PD-L1 in NPC PDX Xeno76. T-cell cytotoxicity measured in the IgG-treated and cusatuzumab-treated (k and m, microscopy; l and n, flow cytometry) PDX/PBMC co-culture systems (n = 3, two-sided unpaired t test). o, p Tumor growth in PDX-bearing humanized mice treated with different regimens (n = 4 for each treatment group), measured from day 1 post intravenous PBMC injection (two-sided unpaired t test). q The change of Tregs and cytotoxic T cells in tumors compared between every two treatment groups (n = 3 per treatment group, two-sided unpaired t test). The n number represents n biologically independent samples/experiments in each group. The data are presented as the mean ± SD (bar plots).
Fig. 5
Fig. 5. Single-cell analysis reveals that CD70-CD27 signaling enhances lipid-driven OXPHOS in Tregs.
a The UMAP plot of 19,682 PBMCs with 13 subtypes identified. b The relative abundance of each T cell subtype in the PBMC co-culture system with CD70-NC and CD70-KO C666 cells. c Expression of Treg-specific and naïve signatures in Tregs (C1: nTregs + C3: rTregs + C7: eTregs) co-cultured with CD70-NC and CD70-KO C666 cells (n = 3731 and 3264, two-sided Wilcoxon signed-rank test). d Expression of cytotoxic, activation, naïve, and exhausted signatures in CD8+ cytotoxic T cells (C2, C5, and C10) co-cultured with CD70-NC and CD70-KO C666 cells (n = 1997 and 3741, two-sided Wilcoxon signed-rank test). e GSEA revealed enriched OXPHOS and lipid metabolism-associated signaling in NC-Tregs, compared to KO-Tregs (GSEA-computed false discovery rate). f Other top enriched hallmark, KEGG, REACTOME, and GP:BP activities (NES > 1.4/NES < −1.4, P value <0.05 and FDR < 0.2) in NC-Tregs and KO-Tregs (two-sided permutation test, the false discovery rate was computed by GSEA and used to avoid false positive pathways). The n number represents n biologically independent cells in each group. The data are presented as the median ± IQR (whiskers = 1.5 × IQR, box & whiskers plots) and KDE (violin plots).
Fig. 6
Fig. 6. Lipid signaling promotes Treg development, homeostasis, and suppressive activity.
Intracellular lipid (a) and cholesterol (b) in co-cultured CD4+ naïve T cells (n = 3, two-sided unpaired t test). c Median Filipin III intensity in each cell subtypes (n = 3, two-sided unpaired t test). d The change of intracellular metabolites in co-cultured CD4+ naïve T cells (n = 1). e Electron microscope images of co-cultured CD4+ naïve T cells. f OXPHOS and glycolysis ATP from co-cultured CD4+ naïve T cells (n = 4, two-sided unpaired t test). g, h JC-1 aggregates/monomers in co-cultured CD4+ naïve T cells (n = 3, two-sided unpaired t test). i mRNA changes of lipid signaling-associated genes in co-cultured CD4+ naïve T cells (n = 3, two-sided unpaired t test). j Lipid signaling scores in Tregs (n = 3731 and 3264, two-sided Wilcoxon signed-rank test). k Lipid signaling scores in CD4+ T cell subtypes (n = 50, two-sided Wilcoxon signed-rank test). l Changes of T-cell module scores and genes during Treg differentiation (n = 3, two-sided Pearson correlation analysis). m Pearson correlation (two-sided) between lipid and suppressive scores (n = 112). n Progression-free survival for NPC patients (high n = 29, low n = 59, two-sided log-rank test). o Pearson correlations (two-sided) between lipid/Treg-related genes in whole blood samples (n = 337). p, q Immunophenotyping of co-cultured CD4+ naïve T cells without lipid supplementation (n = 3, two-sided unpaired t test). r The change of immunosuppressive factors in lipid-depleted co-culture (n = 3, two-sided unpaired t test). s T-cell cytotoxicity in lipid-depleted co-culture (n = 5, two-sided unpaired t test). t Intracellular lipid in co-cultured CD4+ naïve T cells without lipid (n = 3, two-sided unpaired t test). u OXPHOS and glycolysis ATP from co-cultured CD4+naïve T cells without lipid (n = 4, two-sided unpaired t test). v JC-1 aggregates/monomers in co-cultured CD4+ naïve T cells without lipid (n = 3, two-sided unpaired t test). w Median intensity of FA metabolism enzymes in co-cultured CD4+ naïve T cells without lipid (n = 3, two-sided unpaired t test). x Electron microscope images of co-cultured CD4+ naïve T cells without lipid. The n number represents n biologically independent samples/cells/experiments. The data are presented as the mean ± SD (bar plots), median ± IQR (whiskers = 1.5×IQR, box & whiskers plots), and KDE (violin plots).
Fig. 7
Fig. 7. EBV infection increases chromatin accessibility at the CD70 promoter and promotes CD70 transcription via NFKB2.
a Left, the single-cell expression of CD70 in EBV+ and EBV- NPC cells (tumor sample n = 36, two-sided Wilcoxon signed-rank test); Right, the quantified CD70+ cell fractions in EBV+ and EBV- NPC43 cells (n = 3, two-sided unpaired t test). b The chromatin accessibility measured by ATAC-seq at the CD70 promoter in EBV+, EBV- NPC cells, and NPE cells. c Top 15 enriched TFs with the highest transcriptional activity in EBV+ NPC cells. d The Pearson correlation (two-sided) between each TF and CD70 in GSE102349 (n = 112) and GSE68799 (n = 42) cohorts. e The spatial co-localization of NFKB2 and CD70 expression in down-sampled spatial spots (n = 100, two-sided Pearson correlation analysis with the 95% confidence band). f The Pearson correlation (two-sided) between NFKB2 and CD70 expression in EBV-transformed lymphocytes (n = 107, with the 95% confidence band). g Expression of NFKB2 across major cell lineages in the NPC scRNA-seq cohort (n = 50, two-sided Wilcoxon signed-rank test). h Relative firefly luminescence normalized by renilla luminescence in each experimental group (n = 3, two-sided unpaired t test). i, j The change of CD70 + fraction in shNC, shNFKB2, vehicle-treated, and SN-52-treated C666 cells (n = 3, two-sided unpaired t test). k The 18s-normalized mRNA fold change of CD70 in shNC, shNFKB2, vehicle-treated, and SN-52-treated C666 cells (n = 3, two-sided unpaired t test). l T-cell cytotoxicity measured in the shNC and shNFKB2 PBMC co-culture systems (n = 5, two-sided unpaired t test). m T-cell cytotoxicity measured in PBMCs co-cultured with vehicle and SN-52-treated C666 cells (n = 5, two-sided unpaired t test). n The schematic illustration of the molecular mechanism of the EBV-NFKB2-CD70-CD27 signaling axis and feedback loop between NPC cells, CD4+ naïve T cells/Tregs, and CD8+ T cells in the NPC microenvironment. The n number represents n biologically independent spots/samples/experiments in each group. The data are presented as the mean ± SD (bar plots), median ± IQR (whiskers = 1.5 × IQR, box & whiskers plots), and KDE (violin plots).

References

    1. Yu H, et al. The global burden of nasopharyngeal carcinoma from 2009 to 2019: an observational study based on the Global Burden of Disease Study 2019. Eur. Arch. Otorhinolaryngol. 2019;279:1519–1533. doi: 10.1007/s00405-021-06922-2. - DOI - PMC - PubMed
    1. Chen YP, et al. Nasopharyngeal carcinoma. Lancet. 2019;394:64–80. doi: 10.1016/S0140-6736(19)30956-0. - DOI - PubMed
    1. Liu Z, Chen Y, Su Y, Hu X, Peng X. Nasopharyngeal carcinoma: clinical achievements and considerations among treatment options. Front. Oncol. 2021;11:635737. doi: 10.3389/fonc.2021.635737. - DOI - PMC - PubMed
    1. Lee AW, Ma BB, Ng WT, Chan AT. Management of nasopharyngeal carcinoma: current practice and future perspective. J. Clin. Oncol. 2015;33:3356–3364. doi: 10.1200/JCO.2015.60.9347. - DOI - PubMed
    1. Gong L, et al. The stromal and immune landscape of nasopharyngeal carcinoma and its implications for precision medicine targeting the tumor microenvironment. Front. Oncol. 2021;11:744889. doi: 10.3389/fonc.2021.744889. - DOI - PMC - PubMed

Publication types