. 2023 Apr 6;14(1):1933.
doi: 10.1038/s41467-023-37593-8.

Mapping the landscape of genetic dependencies in chordoma

Affiliations

Mapping the landscape of genetic dependencies in chordoma

Tanaz Sharifnia et al. Nat Commun. .

Abstract

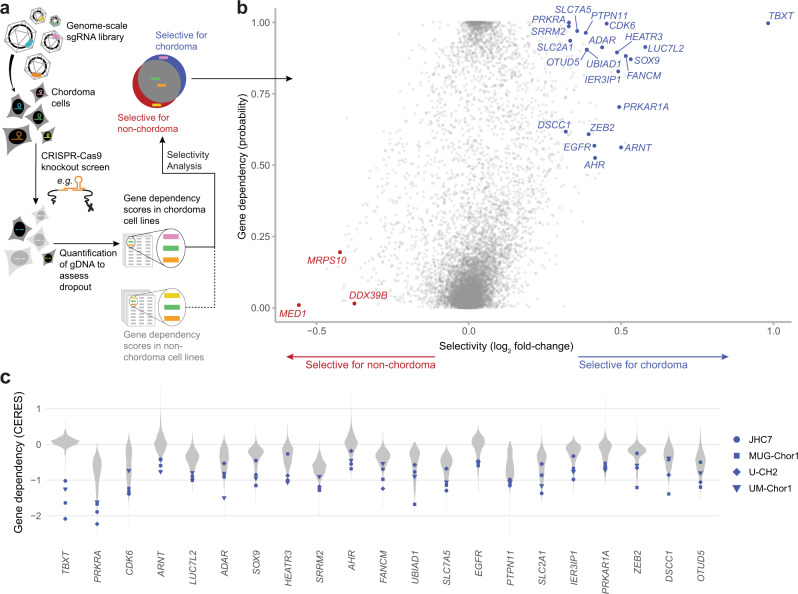
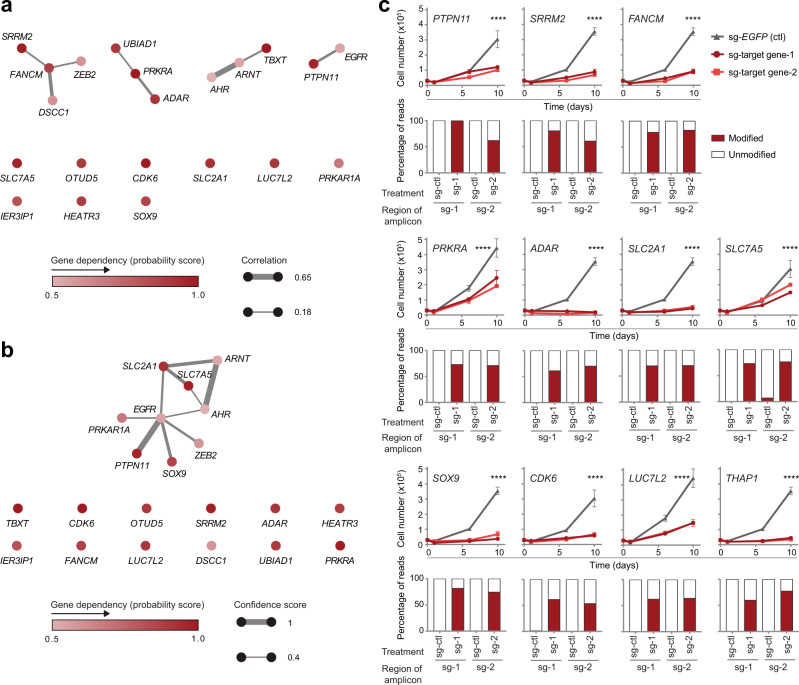
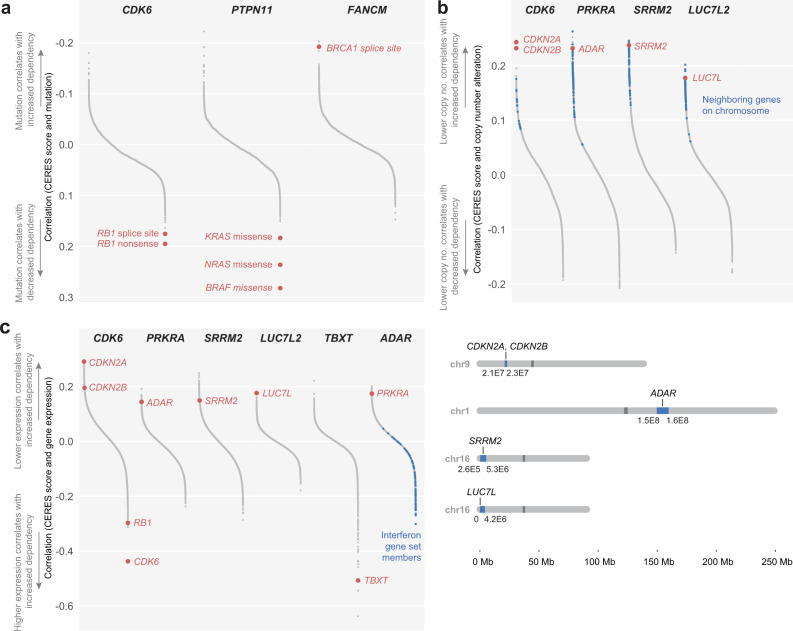
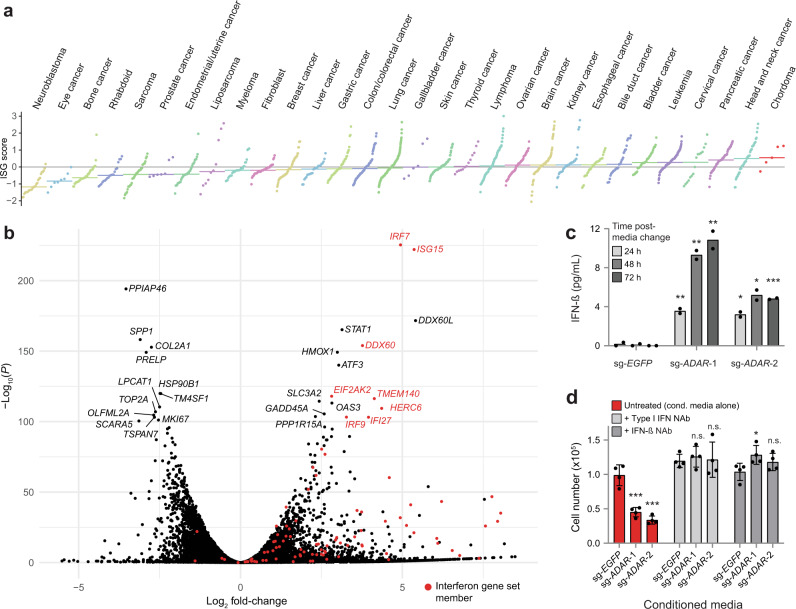
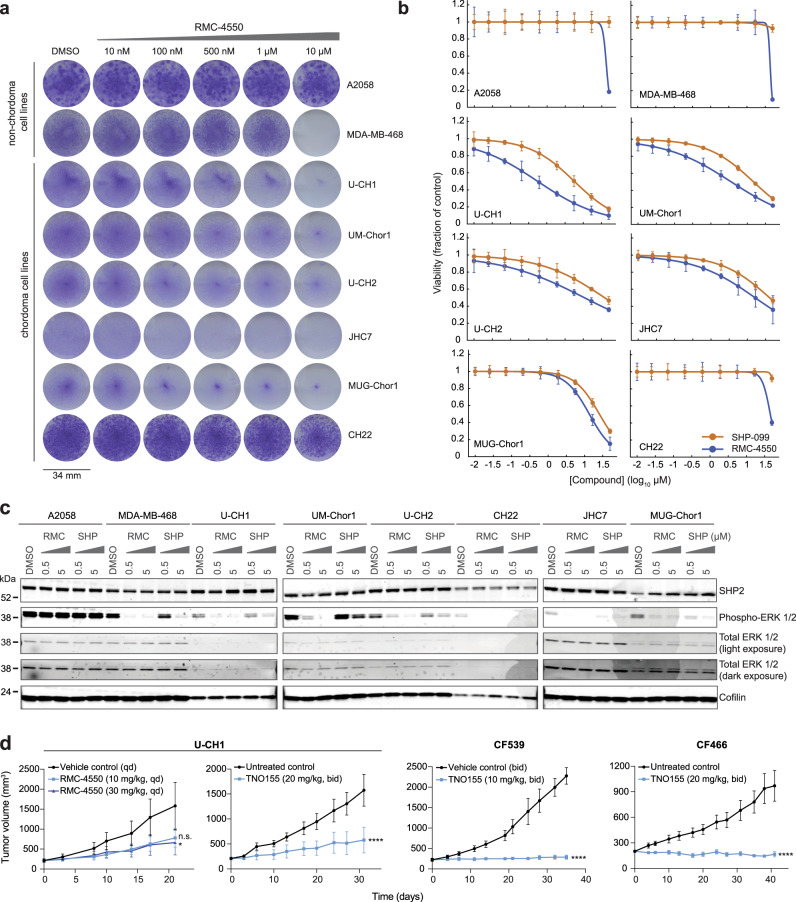
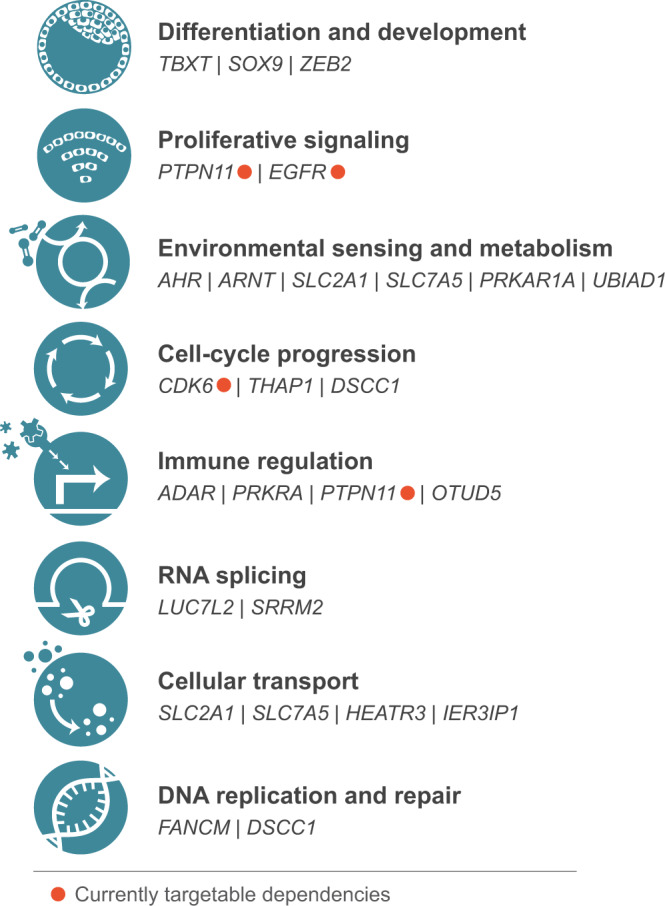
Identifying the spectrum of genes required for cancer cell survival can reveal essential cancer circuitry and therapeutic targets, but such a map remains incomplete for many cancer types. We apply genome-scale CRISPR-Cas9 loss-of-function screens to map the landscape of selectively essential genes in chordoma, a bone cancer with few validated targets. This approach confirms a known chordoma dependency, TBXT (T; brachyury), and identifies a range of additional dependencies, including PTPN11, ADAR, PRKRA, LUC7L2, SRRM2, SLC2A1, SLC7A5, FANCM, and THAP1. CDK6, SOX9, and EGFR, genes previously implicated in chordoma biology, are also recovered. We find genomic and transcriptomic features that predict specific dependencies, including interferon-stimulated gene expression, which correlates with ADAR dependence and is elevated in chordoma. Validating the therapeutic relevance of dependencies, small-molecule inhibitors of SHP2, encoded by PTPN11, have potent preclinical efficacy against chordoma. Our results generate an emerging map of chordoma dependencies to enable biological and therapeutic hypotheses.


Conflict of interest statement

M.J.W. is an employee and shareholder of Kojin Therapeutics. D.M.F. is a consultant for Incyclix Bio. F.V. receives research support from the Dependency Map Consortium, Bristol Myers Squibb, Novo Ventures, and Riva therapeutics, has participated in an advisory board of GSK, and has shares and is a consultant for Riva Therapeutics. D.E.R. receives research funding from members of the Functional Genomics Consortium (Abbvie, Bristol-Myers Squibb, Jannsen, Merck, Vir), and is a director of Addgene, Inc. W.C.H. is a consultant for ThermoFisher, Solasta, MPM Capital, Frontier Medicines, Tyra Biosciences, RAPPTA Therapeutics, KSQ Therapeutics, Jubilant Therapeutics, Function Oncology, Calyx, and Serinus Biosciences. P.A.C. is an advisor to Pfizer, Inc., Belharra Therapeutics, and Magnet Biomedicine. S.L.S. is a shareholder and serves on the Board of Directors of Kojin Therapeutics; is a shareholder and advises Jnana Therapeutics, Kisbee Therapeutics, Belharra Therapeutics, Magnet Biomedicine, Exo Therapeutics, Eikonizo Therapeutics, and Replay Bio; advises Vividian Therapeutics, Eisai Co., Ltd., Ono Pharma Foundation, F-Prime Capital Partners, and the Genomics Institute of the Novartis Research Foundation; and is a Novartis Faculty Scholar. The remaining authors declare no competing interests.

Figures

Fig. 1
Fig. 1. Genome-scale CRISPR-Cas9 screens identify a spectrum of selectively essential genes in chordoma.
a Experimental workflow of genome-scale CRISPR-Cas9 loss-of-function screens to identify selectively essential genes in chordoma. b Selective essentiality analysis identifying chordoma dependency genes. Selectivity is quantified by the log2 fold-change in mean dependency probability scores between four chordoma and 765 non-chordoma cell lines (x-axis). The y-axis depicts the median dependency probability score for the chordoma cell lines. Gene dependencies selective for chordoma/non-chordoma are indicated in blue/red (see Methods for details). c Distribution of CERES gene effect scores for the indicated genes across four chordoma cell lines (blue) and 765 non-chordoma cell lines (gray; non-chordoma cell lines were profiled as part of the Broad Institute Cancer Dependency Map). Lower CERES gene effect scores indicate higher dependency of a cell line on a given gene. Genes are ranked by decreasing selectivity for chordoma, quantified by the log2 fold-change in mean CERES scores between four chordoma and 765 non-chordoma cell lines. Source data are provided as a Source Data file. See also related Supplementary Data 1.
Fig. 2
Fig. 2. Validation of candidate chordoma dependency genes.
a Co-essentiality network for selective chordoma dependency genes. Nodes: chordoma dependency genes, colored by dependency probability scores. Edges: Pearson correlation coefficient ≥0.18 between dependency profiles for connected gene pairs, i.e., dependency probability scores across all 769 cancer cell lines; edge width scaled by correlation coefficient. For clarity, we show all genes included in the analysis by listing singletons (genes without connections exceeding our thresholds) below the connected components of the network. b STRING protein-protein interaction network for selective chordoma dependency genes. Nodes: chordoma dependency genes, colored by dependency probability scores. Edges: putative interactions with a STRING confidence score ≥0.4; edge width scaled by confidence score. c (Top rows) Proliferation of Cas9-expressing UM-Chor1 chordoma cell lines transduced with one of two distinct sgRNAs targeting a candidate dependency gene or a non-targeting sgRNA control. Points represent the mean ± s.d. (n = at least 3 biological samples measured in parallel). ****P < 0.0001, derived from a two-way analysis of variance (ANOVA). P values for the test comparing sg-EGFP and sg-target gene-1 are displayed and refer to the time × treatment interaction. Additional details of P values and effect sizes are reported in Supplementary Data 7. Graphs with identical sg-EGFP control curves reflect experiments performed in parallel on the same day. (Bottom rows) Amplicon sequencing results confirm on-target editing following sgRNA treatment. We quantified the percentage of modified (red) versus unmodified (white) reads of the targeted genomic site following sgRNA treatment of UM-Chor1-Cas9 cells (sg-EGFP non-targeting control or one of two distinct sgRNAs targeting a candidate dependency gene). The small fraction of “modified” reads observed for the sg-SLC7A5−2-targeted amplicon with sg-EGFP control treatment originates from a residual amount of single-nucleotide variation we were unable to match to genomically defined off-target amplicons. However, their distribution points to an additional off-target amplicon as the source (rather than true editing events). Source data are provided as a Source Data file.
Fig. 3
Fig. 3. Genomic and transcriptomic predictors of gene dependencies.
a Mutation correlates of selected dependency genes, ranked by increasing correlation coefficients. The direction of the y-axis was reversed to maintain consistent interpretation across all panels. b (Top) Copy-number correlates of selected dependency genes, ranked by decreasing correlation coefficients. Blue: genes neighboring the labeled correlate on the same chromosome, within a window selected for maximum enrichment of neighboring genes at the top of the correlation rank list (see Methods). (Bottom) Genomic loci of copy-number correlates and, in blue, window selected by enrichment analysis. c Gene-expression correlates of selected dependency genes, ranked by decreasing correlation coefficients. Members of the MSigDB Interferon Alpha gene set are indicated in blue. For all correlation calculations, we used pairwise-complete observations to handle occasional missing values. All comparisons included at least 719 cell lines, and over 95% of comparisons included the complete set of cell lines for which data were available (mutations: 768; gene expression: 767; copy number: 769). Full results are available at 10.6084/m9.figshare.21774746.v1. See also related Supplementary Data 3.
Fig. 4
Fig. 4. Interferon-stimulated genes are overexpressed in chordoma cells and further upregulated following ADAR gene suppression.
a Distribution of ISG core scores for chordoma cell lines and 1294 non-chordoma cancer cell lines in the CCLE, grouped by lineage annotation. Colored horizontal bars: median scores for each group. Gray horizontal line: zero-score mark. b Differential gene expression comparing the average effects of two distinct ADAR-targeting sgRNAs to a non-targeting sgRNA control in Cas9-expressing UM-Chor1 cells. Gene expression was measured with RNA sequencing. P values were derived from a Wald test and Benjamini–Hochberg adjusted. Members of the MSigDB Interferon Alpha gene set are indicated in red. c IFN-β levels in conditioned media harvested from Cas9-expressing UM-Chor1 cells transduced with the indicated sgRNAs and subsequently subjected to a media change after selection for infected cells. IFN-β levels were measured by ELISA. Data represent the mean of two technical replicates. *P < 0.05, **P < 0.01, ***P < 0.001, derived from a two-tailed, unpaired t-test. The statistical test was performed on the indicated condition and the corresponding sg-EGFP control. Additional details of P values and effect sizes are reported in Supplementary Data 7. d Cell viability of parental UM-Chor1 cells treated for 5 days with conditioned media harvested from Cas9-expressing UM-Chor1 cells transduced with the indicated sgRNAs. Treatment with conditioned media was done in the presence or absence of neutralizing antibodies (NAbs) specific to type I IFNs or IFN-β. Data represent the mean ± s.d. (n = 4 biological samples measured in parallel). n.s. not significant, *P < 0.05, ***P < 0.001, derived from a two-tailed, unpaired t-test. The statistical test was performed on the indicated condition and the corresponding sg-EGFP control. Additional details of P values and effect sizes are reported in Supplementary Data 7. Source data are provided as a Source Data file. See also related Supplementary Data 5.
Fig. 5
Fig. 5. Inhibitors of SHP2, encoded by PTPN11, represent candidate therapeutic agents against chordoma.
a Colony formation assays of chordoma and non-chordoma (negative control A2058; positive control MDA-MB-468) cell lines treated with indicated concentrations of RMC-4550 for 14 days. b Viability of chordoma and non-chordoma (negative control A2058; positive control MDA-MB-468) cell lines treated with indicated concentrations of SHP2 inhibitors RMC-4550 and SHP099 and assayed for cell viability after 6 days with CellTiter-Glo. Response data were represented by a fitted curve to the mean fractional viability at each concentration relative to vehicle-treated cells; error bars represent the s.e.m. (n = 4 biological samples measured in parallel). c Immunoblot analysis of chordoma and non-chordoma (negative control A2058; positive control MDA-MB-468) cell lines treated with indicated concentrations of RMC-4550, SHP099, or DMSO for 2 h. d Tumor proliferation in mice engrafted with chordoma cells (U-CH1 cell line-derived xenograft, CF539 PDX, or CF466 PDX) and treated with a SHP2 inhibitor (RMC-4550 or TNO155). Points represent the mean tumor volume ± s.e.m. (n = 4 (control) or 5 (compound) tumors for each arm of the U-CH1/RMC-4550 study; n = 6 (compound) or 7 (control) tumors for each arm of the U-CH1/TNO155 study; n = 6 (control) or 7 (compound) tumors for each arm of the CF539 study; n = 7 tumors for each arm of the CF466 study). n.s., not significant, *P < 0.05, ****P < 0.0001, derived from a two-way analysis of variance (ANOVA) with repeated measures. P values for the time × treatment interaction (relative to the control condition) are indicated. Additional details of P values and effect sizes are reported in Supplementary Data 7. Source data are provided as a Source Data file. See also related Supplementary Data 6.
Fig. 6
Fig. 6. Functional classification of chordoma dependency genes.
Canonical biological functions associated with chordoma dependency genes. Genes encoding proteins that are currently targetable are indicated.

References

    1. Hahn WC, et al. An expanded universe of cancer targets. Cell. 2021;184:1142–1155. doi: 10.1016/j.cell.2021.02.020. - DOI - PMC - PubMed
    1. Weinstein IB. Cancer. Addiction to oncogenes–the Achilles heal of cancer. Science. 2002;297:63–64. doi: 10.1126/science.1073096. - DOI - PubMed
    1. Lawrence MS, et al. Mutational heterogeneity in cancer and the search for new cancer-associated genes. Nature. 2013;499:214–218. doi: 10.1038/nature12213. - DOI - PMC - PubMed
    1. Tsherniak A, et al. Defining a cancer dependency map. Cell. 2017;170:564–576 e516. doi: 10.1016/j.cell.2017.06.010. - DOI - PMC - PubMed
    1. Lord CJ, Ashworth A. PARP inhibitors: synthetic lethality in the clinic. Science. 2017;355:1152–1158. doi: 10.1126/science.aam7344. - DOI - PMC - PubMed

Publication types