. 2023 Apr 6;14(1):1930.
doi: 10.1038/s41467-023-37454-4.

Glucocerebrosidase is imported into mitochondria and preserves complex I integrity and energy metabolism

Affiliations

Glucocerebrosidase is imported into mitochondria and preserves complex I integrity and energy metabolism

Pascale Baden et al. Nat Commun. .

Abstract

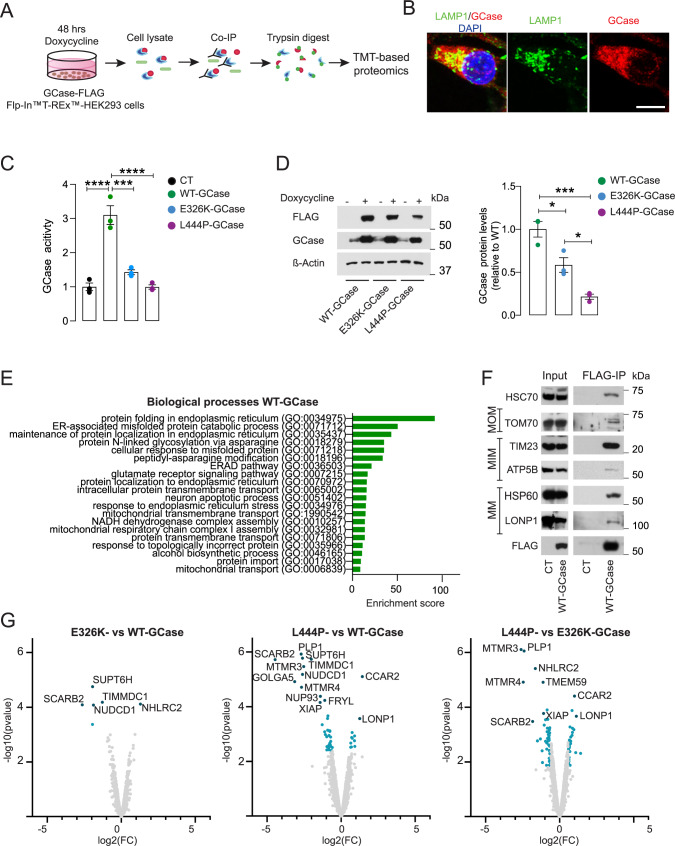
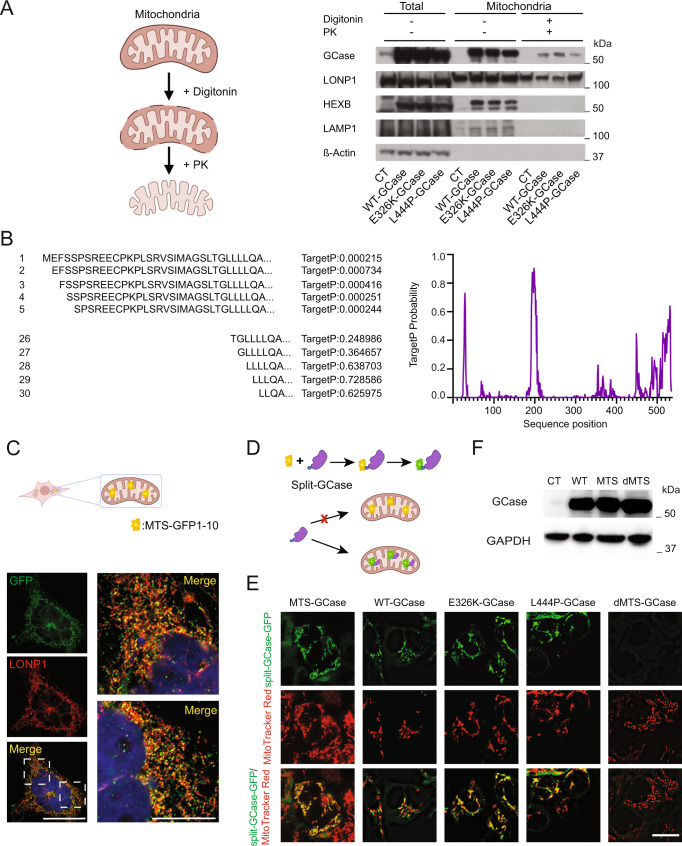
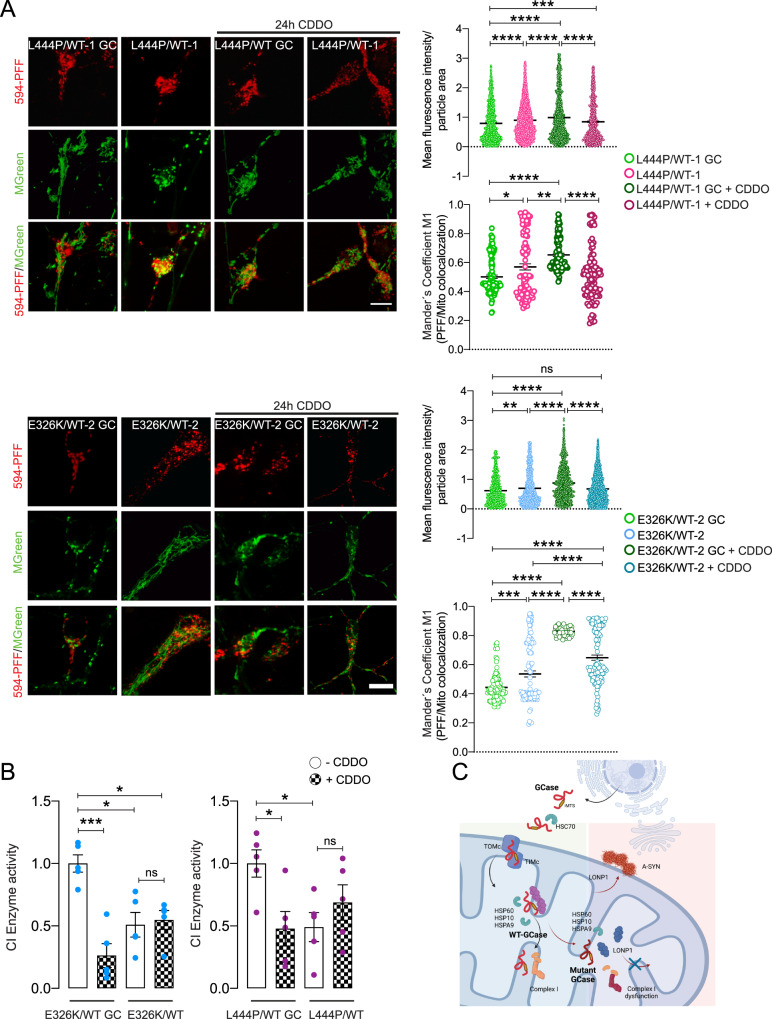
Mutations in GBA1, the gene encoding the lysosomal enzyme β-glucocerebrosidase (GCase), which cause Gaucher's disease, are the most frequent genetic risk factor for Parkinson's disease (PD). Here, we employ global proteomic and single-cell genomic approaches in stable cell lines as well as induced pluripotent stem cell (iPSC)-derived neurons and midbrain organoids to dissect the mechanisms underlying GCase-related neurodegeneration. We demonstrate that GCase can be imported from the cytosol into the mitochondria via recognition of internal mitochondrial targeting sequence-like signals. In mitochondria, GCase promotes the maintenance of mitochondrial complex I (CI) integrity and function. Furthermore, GCase interacts with the mitochondrial quality control proteins HSP60 and LONP1. Disease-associated mutations impair CI stability and function and enhance the interaction with the mitochondrial quality control machinery. These findings reveal a mitochondrial role of GCase and suggest that defective CI activity and energy metabolism may drive the pathogenesis of GCase-linked neurodegeneration.


Conflict of interest statement

The authors declare no competing interests.

Figures

Fig. 1
Fig. 1. TMT proteomics in stable T-Rex HEK cells reveals GCase mitochondrial interactors.
A Experimental plan of the TMT-based quantitative proteomic profiling of GCase interactors in T-Rex HEK cells overexpressing V5-Flag-GCase (WT, L444P, or E326K). T-Rex HEK cells expressing the empty vector were used as a control (CT). B Representative fluorescence microscopy image showing the intracellular localization of exogenous WT-GCase (V5, red) and lysosomes (LAMP1, green). Scale bar, 10 μm. C GCase activity in T-Rex HEK cells expressing WT or mutant GCase (E326K or L444P). Values are normalized to the empty vector control (CT). Mean ± SEM; one-way ANOVA with Bonferroni post hoc test; ****P < 0.0001, ***P = 0.0004; n = 3 independent experiments. D Representative western blot for FLAG and GCase in uninduced and induced T-Rex HEK cells overexpressing V5-Flag-GCase (WT, E326K, or L444P). Densitometric quantification of GCase-FLAG in T-Rex HEK cells expressing WT or mutant GCase (E326K or L444P) is shown on the right. Mean ± SEM; one-way ANOVA with Bonferroni post hoc test; ***P = 0.0009, *P = 0.0218, 0.0371, in sequence; n = 3 independent experiments. E Gene ontology pathway analysis showing the top enriched biological processes (BPs) in the WT-GCase interactome. F Representative GCase-FLAG CoIP showing the interaction between GCase and HSC70, TOM70, TIM23, ATP5B, HSP60, and LONP1. MOM mitochondrial outer membrane, MIM mitochondrial inner membrane, MM mitochondrial matrix. G Volcano plot showing differentially expressed protein interactors among WT-, E326K-, and L444P-GCase lines. Hit interactors that differ by twofold and have a false discovery rate (FDR) of ≤5% are shown using Limma-based differential analysis. Source data are provided as a Source Data file.
Fig. 2
Fig. 2. GCase is targeted to mitochondria.
A Isolated mitochondria from the control, WT-, E326K-, and L444P-GCase lines were solubilized with digitonin and subjected to digestion with proteinase K (PK), and immunoblotting was performed for the indicated markers. Images were created with BioRender.com. B TargetP probability scores of the internal mitochondrial target sequence-like sequence (iMTS-ls) of the sequences resulting from amino acid removal. To calculate the scores, we consecutively N-terminally truncated the sequences and calculated the corresponding TargetP scores for each position. C Schematic representation of mitochondrial targeting of the MTS-GFP1-10 split-GFP system and representative immunofluorescence image showing the colocalization of LONP1 with MTS-GFP1–10 48 h after doxycycline induction. Scale bar, 10 μm. Images were created with BioRender.com. D Schematic representation of the MTS-GFP1–10 split GCase GFP system. Images were created with BioRender.com. E Confocal images from MTS-GFP1–10 T-Rex HEK cells transfected with WT, E326K, or L444P GBA1-GFP11 or dMTS-GBA1. Representative fluorescence microscopy images showing the intracellular distribution of GFP (green) and mitochondria stained with MitoTracker Red. Scale bar, 10 μm. F Representative western blot showing GCase levels in T-Rex HEK cells overexpressing the empty vector (CT), WT-GCase, MTS-GCase, or dMTS-GCase. Source data are provided as a Source Data file.
Fig. 3
Fig. 3. GCase is imported into mitochondria by the mitochondrial protein import machinery and interacts with mitochondrial chaperones and proteases.
A Graphical summary showing cytosolic chaperones as well as mitochondrial import and matrix GCase interactors identified by TMT proteomics. Images were created with BioRender.com. BD Validation of WT and mutant (E326K and L444P) GCase interactions with HSC70 (B), TOM70 (C), and TIM23 (D) by coimmunoprecipitation followed by western blot analysis and densitometry quantification. Mean ± SEM; one-way ANOVA with Bonferroni post hoc test, *P = 0.0432; n = 3 independent experiments. E, F Validation of WT and mutant (E326K and L444P) GCase interactions with LONP1 (E) and HSP60 (F) by coimmunoprecipitation followed by western blot analysis and densitometry quantification. Mean ± SEM; one-way ANOVA with Bonferroni post hoc test, **P = 0.0031, 0.0059, 0.0041, in sequence; *P = 0.0225; n = 3 independent experiments. G Immunoprecipitation of endogenous GCase followed by western blot analysis demonstrating GCase interaction with mitochondrial proteins LONP1, HSP60, TIM23, TIMMDC1, and NDUFS2 in NPCs generated from L444P/L444P iPSCs and the corresponding gene-corrected isogenic control. Quantification of the LONP1/GCase interaction in L444P/L444P iPSC-derived NPCs and isogenic controls is shown on the right. Mean ± SEM; unpaired two-tailed t-test, *P = 0,048, n = 3 independent experiments. H ExM images showing LONP1 (green) and GCase (red) staining in L444P/L444P neurons and corresponding isogenic gene-corrected controls. Scale bar, 100 μm. Colocalization analysis of LONP1/GCase was performed in the neuronal soma and axons (H). Mean ± SEM; unpaired two-tailed t-test; ****P < 0.0001, *P = 0.0275. Five images were taken from n = 3 independent experiments. Source data are provided as a Source Data file.
Fig. 4
Fig. 4. GCase modulates mitochondrial CI integrity and activity in iPSC-derived neurons.
A FLAG-GCase-CoIP and western blot analysis showing the interaction between GCase and TIMMDC1 and NDUFA10 in T-Rex HEK cells overexpressing V5-Flag-GCase (WT, L444P, or E326K). B Densitometric quantification of the interaction between GCase and TIMMDC1 or NDUFA10. Mean ± SEM; one-way ANOVA with Bonferroni post hoc test; n = 3 independent experiments; TIMMDC1: **P = 0.0098, 0.0070, in sequence; NDUFA10: **P = 0.0097, *P = 0.0439. C Blue native and western blot analysis of complex I (CI) assembly into the mitochondrial supercomplex (SC) in T-Rex HEK cells overexpressing V5-Flag-GCase (WT, L444P, or E326K). Succinate dehydrogenase complex flavoprotein A (SDHA) was used as a loading control. D Densitometric quantifications of the CI-containing supercomplex in the different cell lines are shown on the right. Data were normalized by CII (SDHA). Mean ± SEM; one-way ANOVA with Bonferroni post hoc test, *P = 0.011, 0.0172, 0.0429, in sequence; n = 3 independent experiments. E Blue native analysis of CI assembly into the mitochondrial supercomplex (SC) in NPCs and DA neurons differentiated from L444P/L444P and E326K/WT iPSCs and their isogenic controls as well as GBA1 KO iPSCs. Succinate dehydrogenase complex flavoprotein A (SDHA) was used as a loading control. F Densitometric quantifications of the CI-containing supercomplex in the different cell lines are shown on the right. Data were normalized by CII (SDHA). Mean ± SEM; left panel: **P = 0.0032, unpaired two-tailed t-test; middle panel: *P = 0.0291, **P = 0.004, one-way ANOVA with Bonferroni post hoc test; right panel: ***p = 0.0008, ****p < 0.0001; one-way ANOVA with Bonferroni post hoc test; n = 4 independent experiments. G CI activity in enriched mitochondria from isogenic GBA1 mutant (E326K, L444P) and GC iPSC-derived neurons. Data were normalized to protein content and expressed relative to the isogenic control. Mean ± SEM; two-tailed t-test; ***P = 0.0008, ****P < 0.0001, *P = 0.0486; n = 5 independent experiments. Source data are provided as a Source Data file.
Fig. 5
Fig. 5. Generation and characterization of GBA1 mutant midbrain organoids.
A Schematic representation of the experimental protocol for midbrain organoid generation. B Representative brightfield images of midbrain organoids generated from L444P/L444P-1 GBA1 iPSCs and corresponding isogenic controls. Scale bar, 200 µm. C Immunostaining for β-TUBIII (green), SOX2 (red), and OTX2 (red) in 18-day-old midbrain organoids. Cell nuclei were counterstained with DAPI (blue). Scale bar, 100 µm. D Immunostaining for MAP2 (green or teal), TH (red), and FOXA2 (green) in midbrain organoids at the indicated timepoints. Cell nuclei were counterstained with DAPI (blue). Scale bar, 100 µm. E Immunostaining for A-SYN (green) and TH (red) in midbrain organoids at 42, 65, and 100 DIV. Cell nuclei were counterstained with DAPI (blue). Scale bar, 500 µm. F Quantification of TH + neurons in whole-section organoids at 42, 65, and 100 DIV was performed using RapID Cell Counter and expressed as the percentage of DAPI + cells. Mean ± SEM; unpaired two-tailed t-test; **P = 0.0011, 0.0038 in sequence; each dot represents the average of cell quantification obtained from three organoids from three different batches. At least three nonsequential cross-section tile images per organoid were quantified. G Total A-SYN levels assessed by ELISA in L444P/L444P-1 GBA1 organoids and corresponding isogenic controls at 42 DIV. Mean ± SEM; unpaired two-tailed t-test; **P = 0.0045. Each dot represents an individual midbrain organoid; three independent differentiation onsets. H Immunostaining for p-Ser129-A-SYN (green), TH (red), and MAP2 (cyan) in midbrain organoids at 100 DIV. Cell nuclei were counterstained with DAPI (blue). Scale bar, 100 µm. Source data are provided as a Source Data file.
Fig. 6
Fig. 6. scRNA-seq of GBA1 mutant midbrain organoids reveals cell-type-specific mitochondrial vulnerability.
A UMAP cluster-integration dimensionality plot showing the unsupervised clustering of GBA1 mutant midbrain organoids and isogenic controls. B Representation of the frequency of major cell clusters in GBA1 mutant midbrain organoids and isogenic controls. Cell clusters were determined by the expression of specific markers. C Dot plot showing the expression levels of the indicated cell-type-specific genes visualized in the UMAP plots. D Expression levels of the indicated synaptic genes visualized in the UMAP plots. E Gene ontology pathway analysis of the DEGs showing the top dysregulated BPs between GBA1 and isogenic midbrain organoids in DA neuronal clusters. F CI activity was measured in mitochondrial extracts from L444P/L444P GBA1 organoids and corresponding isogenic controls. Data were normalized to protein content and expressed relative to the isogenic control. Mean ± SEM; unpaired two-tailed t-test; **P = 0.0093; each dot represents an individual midbrain organoid; n = 7 from three independent differentiation onsets. G ExM images showing LONP1 (green) and GCase (red) in L444P-L444P midbrain organoids and corresponding isogenic controls. Cell nuclei were counterstained with DAPI (blue). Scale bar, 10 µm. Colocalization analysis is shown on the right. Mean ± SEM; unpaired two-tailed t-test; ****P < 0.0001; images were taken from three independent experiments. Source data are provided as a Source Data file.
Fig. 7
Fig. 7. The mitochondrial LONP1 protease contributes to GCase-linked A-SYN accumulation.
A iPSC-derived neurons of the indicated genotypes were incubated with Alexa Fluor 594-labeled A-SYN preformed fibrils (PFFs) with or without CDDO-Me treatment. Live-cell imaging was performed 24 h after treatment to assess the content of internalized A-SYN PFFs. To label mitochondria, iPSC-derived neurons were incubated with MitoTracker Green. The PFF intracellular signal was calculated using ImageJ and expressed as the fluorescence intensity normalized to the particle area. A-SYN PFF intramitochondrial accumulation was assessed by measuring the colocalization between Alexa Fluor 594 and the MitoTracker Green signal. Mean ± SEM; two-way ANOVA with Bonferroni post hoc test; L444P/WT lines, upper panel: ****P < 0.0001, ***P = 0.0004; lower panel, **P = 0.0023, *P = 0.0165, ****p < 0.0001. E326K/WT lines, upper panel, **P = 0.0054, ****P < 0.0001; lower panel, ***P = 0.0008, ****P < 0.0001; for each condition, five to eight images were acquired from n = 4 independent experiments. Data were obtained from more than 20 cells per experiment per condition. Scale bar, 10 µm. B iPSC-derived neurons of the indicated genotypes were incubated with or without CDDO-Me treatment, and CI activity was measured in mitochondrial extracts. Mean ± SEM; two-way ANOVA with Bonferroni post hoc test; left panel, ***p = 0.0004, *p = 0.019, 0.021, in sequence; right panel, *p = 0.0175, 0.0148, in sequence; n = 5 independent experiments. C Graphical representation of GCase import and function in mitochondria and the proposed role of LONP1 in WT and mutant GCase models. Source data are provided as a Source Data file. Images were created with BioRender.com.

References

    1. Neudorfer O, et al. Occurrence of Parkinson’s syndrome in type I Gaucher disease. QJM. 1996;89:691–694. doi: 10.1093/qjmed/89.9.691. - DOI - PubMed
    1. Sidransky E, et al. Multicenter analysis of glucocerebrosidase mutations in Parkinson’s disease. N. Engl. J. Med. 2009;361:1651–1661. doi: 10.1056/NEJMoa0901281. - DOI - PMC - PubMed
    1. Gan-Or Z, et al. Differential effects of severe vs mild GBA mutations on Parkinson disease. Neurology. 2015;84:880–887. doi: 10.1212/WNL.0000000000001315. - DOI - PMC - PubMed
    1. Malek N, et al. Features of GBA-associated Parkinson’s disease at presentation in the UK Tracking Parkinson’s study. J. Neurol. Neurosurg. Psychiatry. 2018;89:702–709. doi: 10.1136/jnnp-2017-317348. - DOI - PMC - PubMed
    1. Duran R, et al. The glucocerobrosidase E326K variant predisposes to Parkinson’s disease, but does not cause Gaucher’s disease. Mov. Disord. 2013;28:232–236. doi: 10.1002/mds.25248. - DOI - PMC - PubMed

Publication types