

A global analysis of the effectiveness of policy responses to COVID-19
- PMID: 37024541
- PMCID: PMC10078072
- DOI: 10.1038/s41598-023-31709-2
A global analysis of the effectiveness of policy responses to COVID-19
Abstract
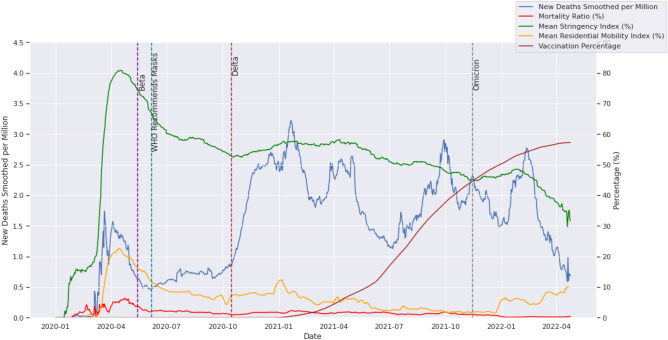
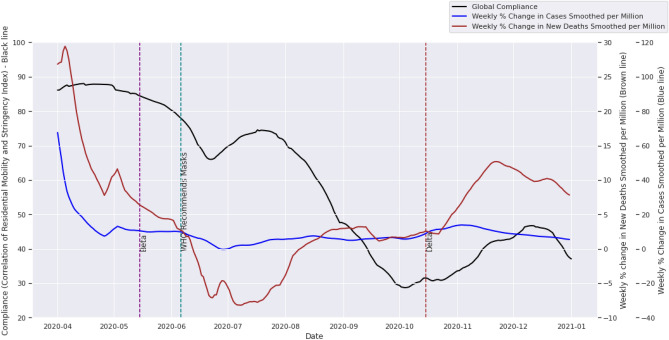
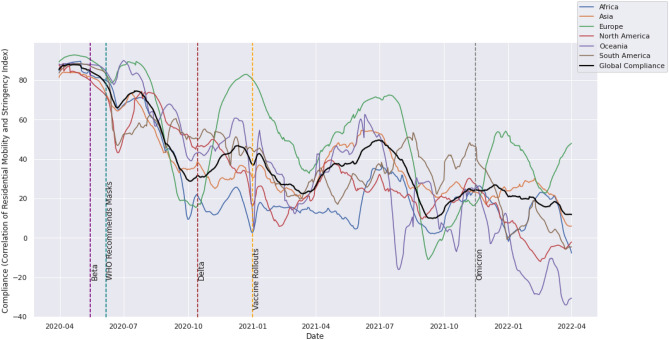
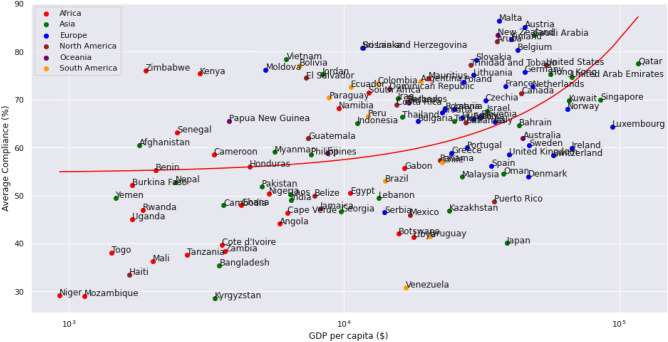
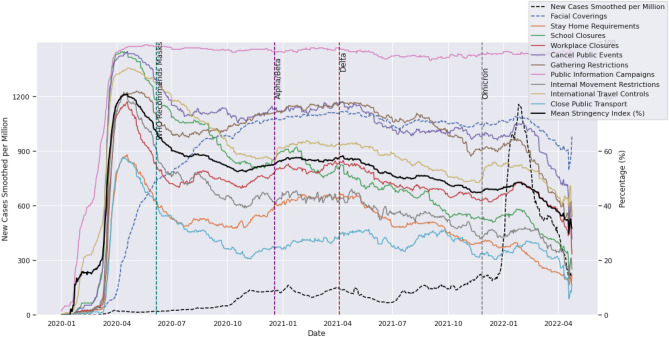
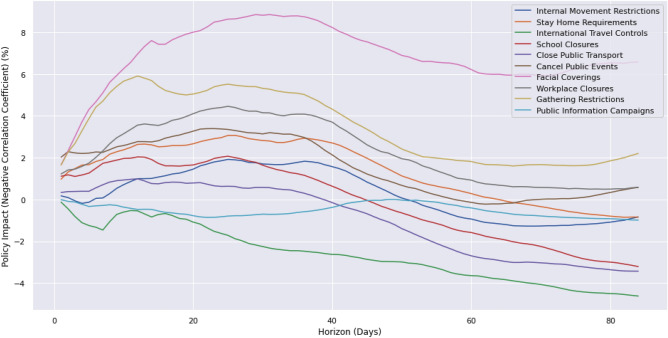
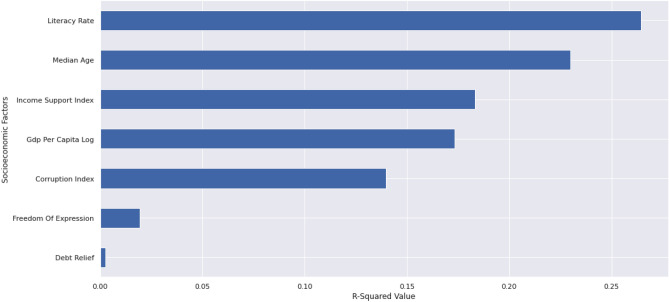
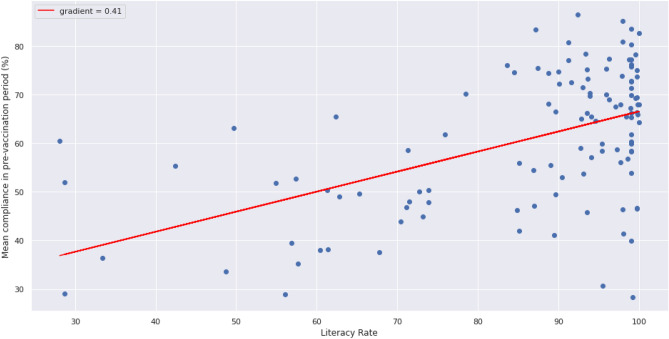
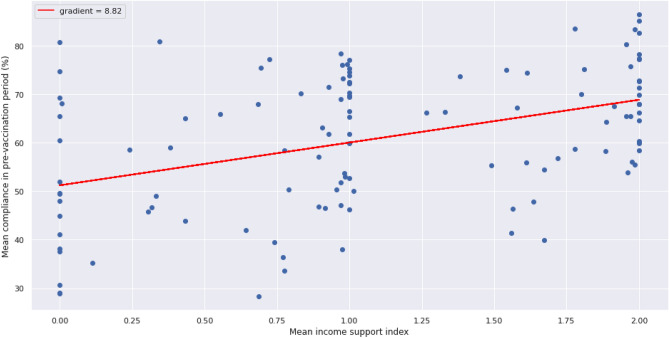
Governments implemented many non-pharmaceutical interventions (NPIs) to suppress the spread of COVID-19 with varying results. In this paper, country-level daily time series from Our World in Data facilitates a global analysis of the propagation of the virus, policy responses and human mobility patterns. High death counts and mortality ratios influence policy compliance levels. Evidence of long-term fatigue was found with compliance dropping from over 85% in the first half of 2020 to less than 40% at the start of 2021, driven by factors such as economic necessity and optimism coinciding with vaccine effectiveness. NPIs ranged from facial coverings to restrictions on mobility, and these are compared using an empirical assessment of their impact on the growth rate of case numbers. Masks are the most cost-effective NPI currently available, delivering four times more impact than school closures, and approximately double that of other mobility restrictions. Gathering restrictions were the second most effective. International travel controls and public information campaigns had negligible effects. Literacy rates and income support played key roles in maintaining compliance. A 10% increase in literacy rate was associated with a 3.2% increase in compliance, while income support of greater than half of previous earnings increased compliance by 4.8%.
© 2023. The Author(s).
Conflict of interest statement
The authors declare no competing interests.
Figures
References
-
- Hadi A, Kadhom M, Hairunisa N, Yousif E, Mohammed S. A review on COVID-19: Origin, spread, symptoms, treatment, and prevention. Biointerface Res. Appl. Chem. 2020;10:7234–7242. doi: 10.33263/BRIAC106.72347242. - DOI
-
- Cucinotta, D. and Vanelli, M. WHO declares COVID-19 a pandemic. PubMed. https://pubmed.ncbi.nlm.nih.gov/32191675/ (Accessed 1 March 2022). - PMC - PubMed
-
- Cameron-Blake, E. et al. Variation in the response to COVID-19 across the four nations of the United Kingdom. Blavatnik School of Government, University of Oxford.https://www.bsg.ox.ac.uk/sites/default/files/2020-10/BSG-WP-2020-035-v1_... (Accessed 8 March 2022).
-
- Hale, T., Webster, S., Petherick, A., Phillips, T. and Kira, B. Oxford COVID-19 government response tracker (OxCGRT). Blavatnik School of Government, University of Oxford. https://www.bsg.ox.ac.uk/research/research-projects/covid-19-government-... (Accessed 8 March 2022).
-
- Hallas, L., Hatibie, A., Majumdar, S., Pyarali, M. and Hale, T. Variation in US states' responses to COVID-19. University of Oxford. https://www.bsg.ox.ac.uk/research/publications/variation-us-states-respo... (Accessed 8 March 2022).
MeSH terms
LinkOut - more resources
Full Text Sources
Medical
