. 2023 May;55(5):807-819.
doi: 10.1038/s41588-023-01355-5. Epub 2023 Apr 6.

Genomic and transcriptomic analysis of checkpoint blockade response in advanced non-small cell lung cancer

Affiliations

Genomic and transcriptomic analysis of checkpoint blockade response in advanced non-small cell lung cancer

Arvind Ravi et al. Nat Genet. 2023 May.

Abstract

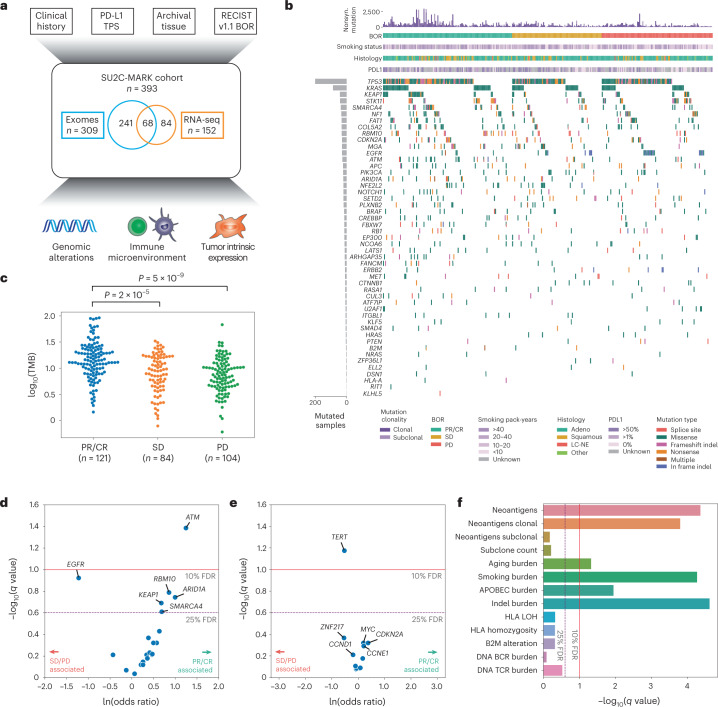
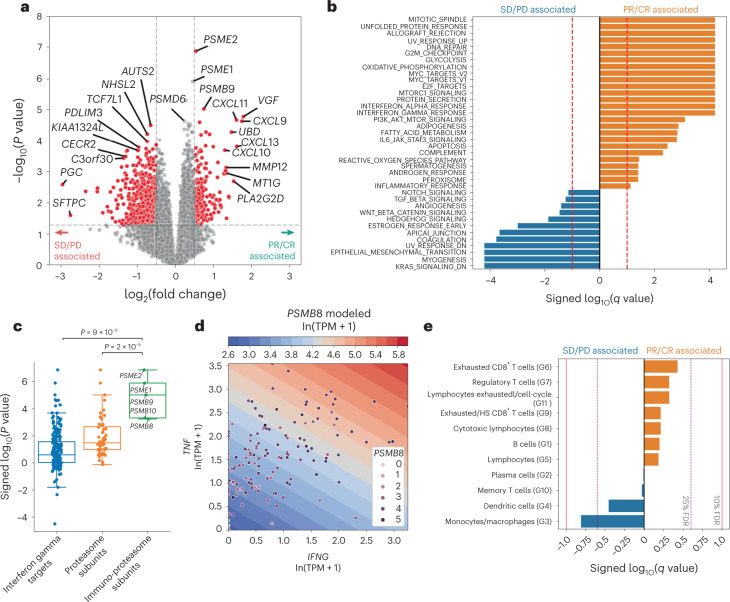
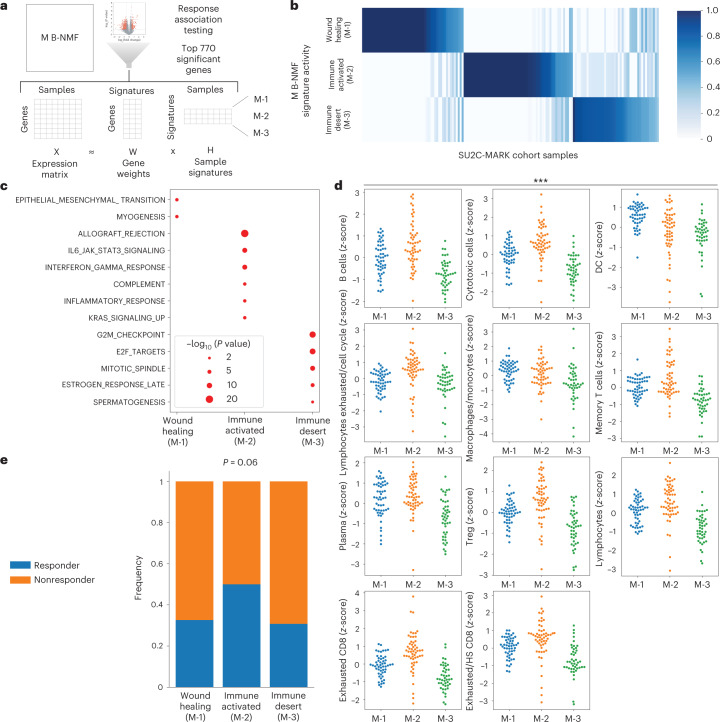
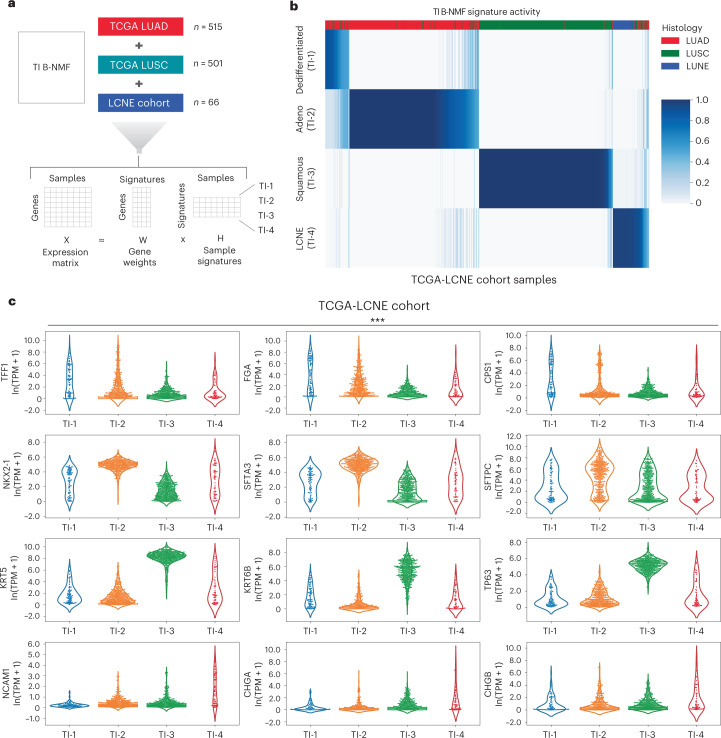
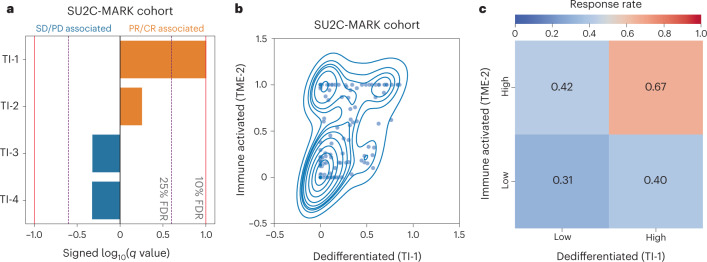
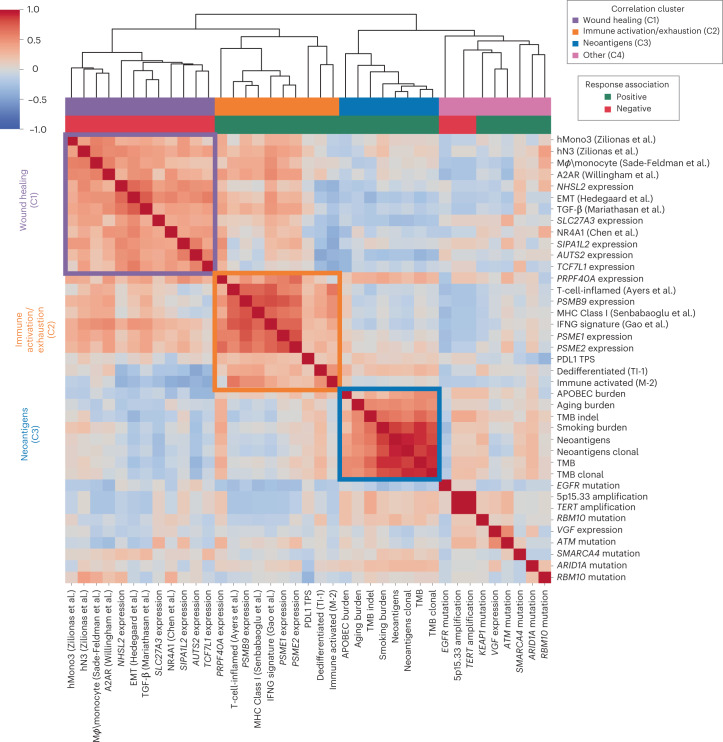
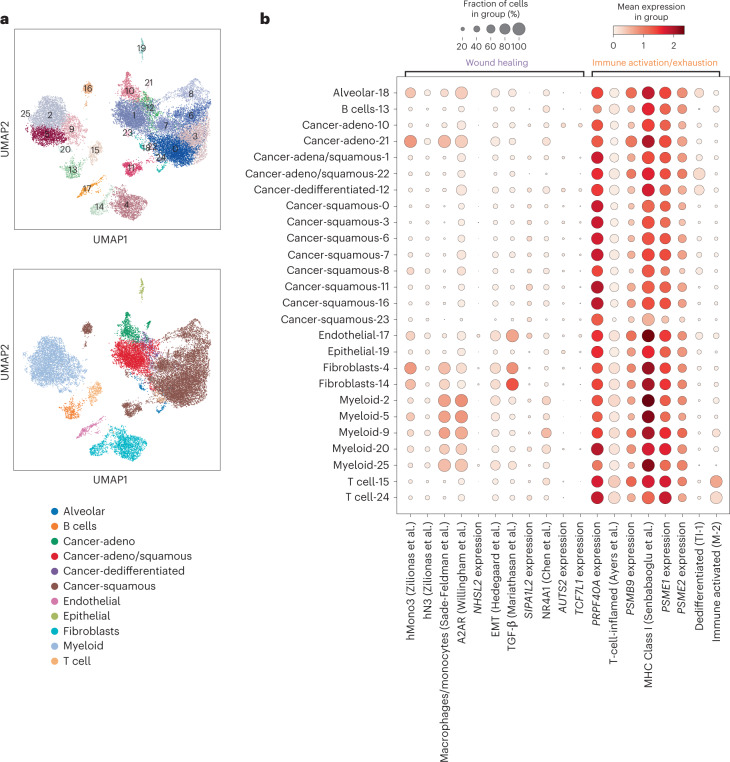
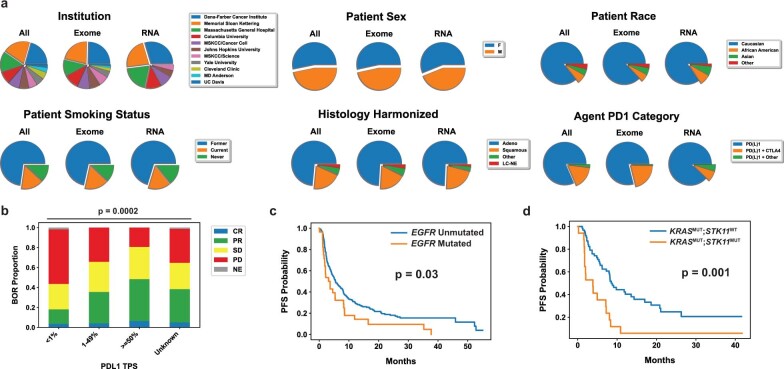
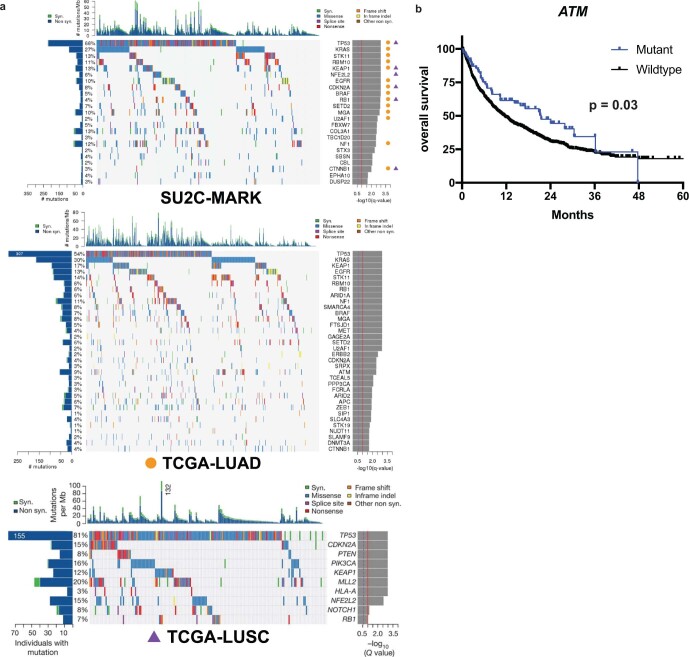
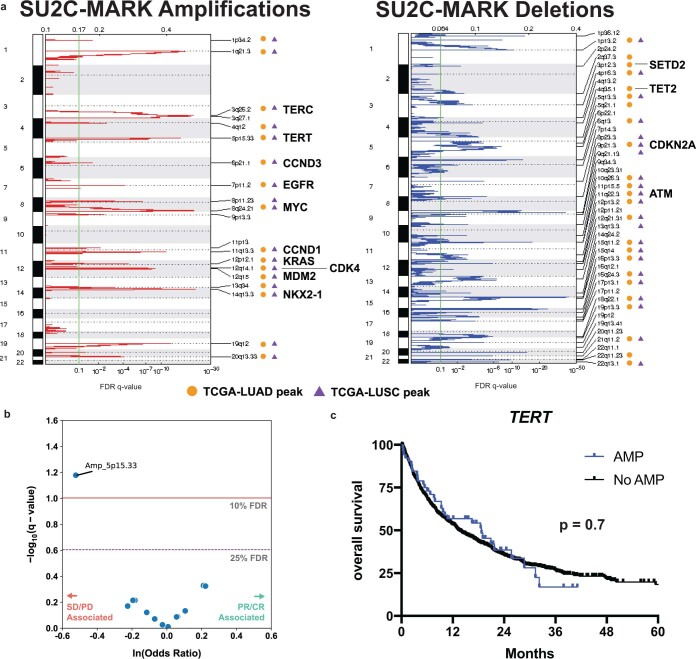
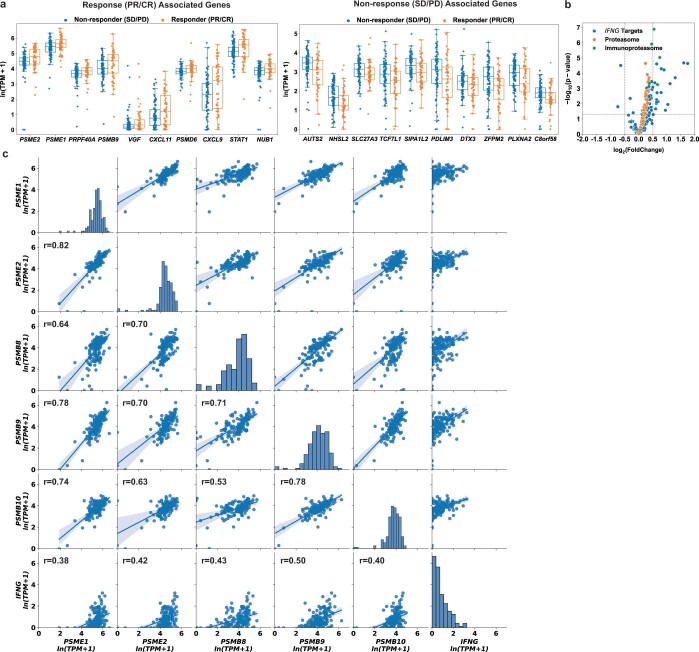
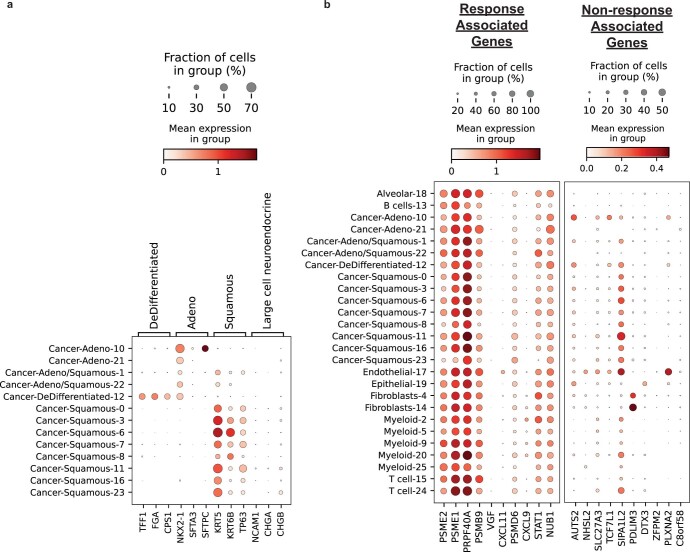
Anti-PD-1/PD-L1 agents have transformed the treatment landscape of advanced non-small cell lung cancer (NSCLC). To expand our understanding of the molecular features underlying response to checkpoint inhibitors in NSCLC, we describe here the first joint analysis of the Stand Up To Cancer-Mark Foundation cohort, a resource of whole exome and/or RNA sequencing from 393 patients with NSCLC treated with anti-PD-(L)1 therapy, along with matched clinical response annotation. We identify a number of associations between molecular features and outcome, including (1) favorable (for example, ATM altered) and unfavorable (for example, TERT amplified) genomic subgroups, (2) a prominent association between expression of inducible components of the immunoproteasome and response and (3) a dedifferentiated tumor-intrinsic subtype with enhanced response to checkpoint blockade. Taken together, results from this cohort demonstrate the complexity of biological determinants underlying immunotherapy outcomes and reinforce the discovery potential of integrative analysis within large, well-curated, cancer-specific cohorts.


Conflict of interest statement

A.R. is a founder, equity owner, and consultant at Halo Solutions and has served as a consultant at Tyra Biosciences. J.F.G. has served as a compensated consultant or received honoraria from Bristol Myers Squibb, Genentech/Roche, Ariad/Takeda, Loxo/Lilly, Blueprint, Oncorus, Regeneron, Gilead, Moderna, Mirati, AstraZeneca, Pfizer, Novartis, iTeos, Nuvalent, Karyopharm, Beigene, Silverback Therapeutics, Merck and GlydeBio; research support from Novartis, Genentech/Roche and Ariad/Takeda; institutional research support from Bristol Myers Squibb, Tesaro, Moderna, Blueprint, Jounce, Array Biopharma, Merck, Adaptimmune, Novartis and Alexo; and has an immediate family member who is an employee with equity at Ironwood Pharmaceuticals. S.S.F is an inventor on provisional patent application No. 62/866,261 related to methods for predicting outcomes of checkpoint inhibition in melanoma and his salary was partially supported by research funding from IBM. I.L. owns equity and consults for ennov1, LLC, and additionally consults for PACT Pharma. J.K. is a current employee and equity owner of GlaxoSmithKline. N.I.V. is a consultant for Sanofi/Regeneron, Oncocyte, and Lilly. P.M.F. has served as a consultant for Amgen, AstraZeneca, BMS, Daichii, F-Star, G1, Genentech, Iteos, Janssen, Novartis, Sanofi, and Surface and has received research support from AstraZeneca, Biontech, BMS, and Novartis. V.A. has received research support to Johns Hopkins from Bristol Myers Squibb and AstraZeneca. J.W.R. has served as a consultant for Boehringer Ingelheim, Novartis, Blueprint, Daiichi Sankyo, EMD Serano, Jazz Pharmaceuticals, Bristol Myers Squibb, Janssen Oncology, Beigene, Turning Point Therapeutics, Genentech and receives research funding from AstraZeneca, Spectrum, Merck, Boehringer Ingelheim, Novartis, Revolution Medicines, GlaxoSmithKline. D.L.G. is an equity owner in Exact Sciences and Nektar; consults for Sanofi, GlaxoSmithKline, Alethia Biotherapeutics, Janssen Research & Development, Eli Lilly, Menarini Ricerche, and 4D Pharma; and receives research support from Janssen Research & Development, Takeda, AstraZeneca, Astellas, Ribon Therapeutics, and NGM Biopharmaceuticals. N.A.P. is a consultant for Astrazeneca, Merck, Pfizer, Eli Lilly/LOXO, Genentech, BMS, Amgen, Mirati, Inivata, G1 Therapeutics, Viosera, Xencor, Janssen, and Boehringer Ingelheim and receives research funding from LOXO, BMS, Merck, Heat Bio, WindMIL, Genentech, Astrazeneca, Spectrum, Mirati, Altor, Jounce, and Sanofi. V.V. is a consultant for BMS, Merck, AstraZeneca, Foundation Medicine, Novartis, Iteos Therapeutics, EMD Serono and receives research funding from AstraZeneca. S.R.D. provides independent image analysis for hospital-contracted clinical research trials programs for Merck, Pfizer, Bristol Myers Squibb, Novartis, Roche, Polaris, Cascadian, Abbvie, Gradalis, Bayer, Zai laboratories, Biengen, Resonance, and Analise and receives research support from Lunit Inc, GE, Vuno and Qure AI. M.M. is a consultant for AstraZeneca, H3 Biomedicine, BMS, Sanofi, Janssen Oncology; receives research funding from Novartis; and owns intellectual property in Elsevier. A.C. is a founder, equity holder, and consultant of Darwin Health Inc. (Columbia University is also an equity holder); holds intellectual property in US patent number 10,790,040 has been awarded related to this work, assigned to Columbia University with A.C. as an inventor, and US patent application number 20210327537 has been filed, also for assignment to Columbia University with A.C. as an inventor. J.V.H. is a consultant for AstraZeneca, BioCurity Pharmaceuticals, Boehringer Ingelheim Pharma, Bristol Myers Squibb, Chugai Biopharmaceuticals, Eli Lilly & Co, EMD Serono, Inc., Genentech, Janssen, Mirati Therapeutics, OncoCyte, Reflexion, Regeneron Pharmaceuticals, Sandoz Pharmaceuticals, Sanofi US Services, Takeda, uniQure, DAVA Oncology, BrightPath Biotherapeutics, Pneuma Respiratory, Eisai, Kairos Venture Investments, GlaxoSmithKline, Gritstone Oncology, Targeted Oncology, Intellisphere, LLC, Millennium Pharmaceuticals, Inc., Catalyst Pharmaceuticals, Guardant Health, Inc., Hengrui Therapeutics, Inc., and Leads Biolabs; receives research funding from AstraZeneca, GlaxoSmithKline, Spectrum; and has intellectual property in Spectrum. R.S.H. has equity in Immunocore, and Bolt, Checkpoint Therapeutics; consults for Immunocore, Junshi Pharmaceuticals, Abbvie, ARMO, AstraZeneca, Bayer, Bolt, Bristol Myers Squibb, Candel Therapeutics, Cybrexa Therapeutics, DynamiCure Biotechnology, eFFECTOR Therapeutics, Eli Lilly, EMD Serono, Foundation Medicine, Genentech/Roche, Genmab, Gliead, Halozyme, Heat Biologics, HiberCell, I-Mab Biopharma, Immune-Onc Therapeutics, Immunocore, Infinity Pharmaceuticals, Johnson and Johnson, Loxo Oncology, Merck, Mirati Therapeutics, Nektar, Neon Therapeutics, NextCure, Novartis, Ocean Biomedical, Oncocyte Corp, Oncternal Therapeutics, Pfizer, Refactor Health, Ribbon Therapeutics, Sanofi, Seattle Genetics, Shire PLC, Spectrum, STCube, Symphogen, Takeda, Tesaro, Tocagen, Ventana Medical Systems, WindMIL Therapeutics, and Xencor; and receives research support from AstraZeneca, Eli Lilly, Genentech/Roche, and Merck. J.R.B. is a consultant for Amgen, Johnson & Johnson, Merck, Bristol Myers Squibb, Sanofi, GlaxoSmithKline, Janssen, Bluprint, AstraZeneca, Regeneron, and Eli Lilly and receives research funding from Bristol Myers Squibb. K.A.S. is a consultant for Shattuck Labs, Pierre-Fabre, EMD Serono, Clinica Alemana de Santiago, Genmab, Takeda, Merck Sharpe & Dohme, Bristol Myers Squibb, AstraZeneca, Agenus and Torque Therapeutics and receives research funding from Navigate Biopharma, Tesaro/GSK, Moderna Inc., Takeda, Surface Oncology, Pierre-Fabre Research Institute, Merck Sharpe & Dohme, Bristol Myers Squibb, AstraZeneca, Ribon Therapeutics, Akoya Biosciences, Boehringer Ingelheim and Eli Lilly. V.E.V. is a founder of Delfi Diagnostics, serves as on the Board of Directors and as a consultant for this organization, and owns Delfi Diagnostics stock, which is subject to certain restrictions under university policy. Additionally, Johns Hopkins University owns equity in Delfi Diagnostics. V.E.V. divested his equity in Personal Genome Diagnostics (PGDx) to LabCorp in February 2022. V.E.V. is an inventor on patent applications submitted by Johns Hopkins University related to cancer genomic analyses and cell-free DNA for cancer detection that have been licensed to one or more entities, including Delfi Diagnostics, LabCorp, Qiagen, Sysmex, Agios, Genzyme, Esoterix, Ventana and ManaT Bio. Under the terms of these license agreements, the University and inventors are entitled to fees and royalty distributions. V.E.V. is an advisor to Viron Therapeutics and Epitope. These arrangements have been reviewed and approved by the Johns Hopkins University in accordance with its conflict-of-interest policies. N.A.R. is an equity owner in Synthekine and Gritstone; holds positions as CMO of Synthekine and member of Board of Directors and Scientific Advisory Board of Gristone; and holds intellectual property related to Determinants of cancer response to immunotherapy (PCT/US2015/062208) licensed to Personal Genome Diagnostics. P.A.J. is an equity owner in Gatekeeper Pharmaceuticals; consults for AstraZeneca, Boehringer Ingelheim, Pfizer, Roche/Genentech, Chugai Pharmaceuticals, Eli Lilly Pharmaceuticals, Araxes Pharmaceuticals, SFJ Pharmaceuticals, Voronoi, Daiichi Sankyo, Biocartis, Novartis, Sanofi, Takeda Oncology, Mirati Therapeutics, Transcenta, Silicon Therapeutics, Syndax, Nuvalent, Bayer, Esai, Allorion Therapeutics, Accutar Biotech, and Abbvie; receives research support from AstraZeneca, Daiichi Sankyo, PUMA, Eli Lilly, Boehringer Ingelheim, Revolution Medicines, and Takeda Oncology and is a co-inventor and receives postmarketing royalties on a DFCI owned patent on EGFR mutations licensed to LabCorp. M.M.A. is a consultant for Genentech, Bristol Myers Squibb, Merck, AstraZeneca, AbbVie, Neon, Achilles, Maverick, Blueprint Medicine, Hengrui, Syndax, Ariad, Nektar, Gritstone, ArcherDX, Mirati, NextCure, Novartis, EMD Serono, Panvaxal/NovaRx, and Foundation Medicine; and is supported by research grants from Genentech, Lilly, Bristol Myers Squibb, and AstraZeneca. B.D.G. is an equity owner in Rome Therapeutics; consults for Darwin Health, Merck, PMV Pharma and Rome Therapeutics; has received research funding for Bristol Myers Squibb and Merck; and is an owner of intellectual property related to: Rna containing compositions and methods of their use (WO2016131048A1), Neoantigens and uses thereof for treating cancer (US20200232040A1), and Compositions and methods for inhibiting cancers and viruses (WO2020023776A2). M.L. is an owner of intellectual property related to: Neoantigens and uses thereof for treating cancer (WO2018136664A1). A.T.S. is an equity owner and current employee of Novartis. J.W. has equity in Tizona Pharmaceuticals, Imvaq, Beigene, Linneaus, Apricity, Arsenal IO, Georgiamune, Trieza, Maverick, Ascentage; consults for Amgen, Apricity, Ascentage Pharma, Arsenal IO, Astellas, AstraZeneca, Bayer, Bicara Therapeutics, Boehringer Ingelheim, Bristol Myers Squibb, Daiichi Sankyo, Dragonfly, Eli Lilly, F Star, Georgiamune, Idera, Imvaq, Maverick Therapeutics, Merck, Psioxus, Recepta, Tizona, Trieza, Truvax, Trishula, Sellas, Surface Oncology, Syndax, Syntalogic, Werewolf Therapeutics; receives research support from Bristol Myers Squibb and Sephora; and owns intellectual property related to: Xenogeneic DNA Vaccines, Alphavirus replicon particles expressing TRP2, Myeloid-derived suppressor cell (MDSC) assay, Newcastle Disease viruses for Cancer Therapy, Vaccinia virus mutants useful for cancer immunotherapy, Anti-PD-1 Antibody, Anti-CTLA4 antibodies, Anti-GITR antibodies and methods of use thereof, Identifying And Treating Subjects At Risk For Checkpoint Blockade Therapy Associated Colitis, Immunosuppressive follicular helper-like T cells modulated by immune checkpoint blockade, CD40 binding molecules and uses thereof, Phosphatidylserine Targeting Agents and uses thereof for adoptive T-cell therapies, Anti-CD40 agonist mAb fused to Monophosphoryl Lipid A (MPL) for cancer therapy, CAR+T cells targeting differentiation antigens as means to treat cancer. N.H. is an equity owner in BioNtech, Related Sciences/Danger Bio, and consults for Related Sciences/Danger Bio. G.G. is an equity holder in Scorpion Therapeutics; consults for Scorpion Therapeutics; receives research funding from IBM and Pharmacyclics; and is an inventor on patent applications related to MSMuTect, MSMutSig, MSIDetect, POLYSOLVER, SignatureAnalyzer-GPU and TensorQTL. M.D.H. has equity in Factorial, Immunai, Shattuck Labs, Arcus, and Avail Bio, and began as an employee and equity holder at AstraZeneca subsequent to the completion of this work; has consulted for Achilles, Adagene, Adicet, Arcus, AstraZeneca, Blueprint, BMS, DaVolterra, Eli Lilly, Genentech/Roche, Genzyme/Sanofi, Janssen, Immunai, Instil Bio, Mana Therapeutics, Merck, Mirati, Natera, Pact Pharma, Shattuck Labs, and Regeneron; has received research funding from Bristol Myers Squibb; and has intellectual property regarding a patent filed by Memorial Sloan Kettering related to the use of TMB to predict response to immunotherapy (PCT/US2015/062208), which is pending and licensed by PGDx. The remaining authors declare no competing interests.

Figures

Fig. 1
Fig. 1. Overview of the SU2C-MARK cohort and initial genomic characterization.
a, Overview of clinical and genomic data collected across the SU2C-MARK cohort (n = 393 patients). b, CoMut plot of SU2C-MARK cohort organized by response category. c, Log10 of the TMB as a function of response category. Significance was assessed via a two-sided Mann–Whitney U test. d, Volcano plot of logistic regression results for oncogenic mutations in known lung cancer drivers and binned BOR category comparing patients with a PR or CR to patients with SD or PD. ATM alterations reached significance (q < 0.1, Benjamini–Hochberg), while EGFR, RBM10, ARID1A, KEAP1 and SMARCA4 were all near significance (q < 0.25). e, Volcano plot of logistic regression results for gene-level copy number. Focal amplifications of TERT as well as the cytoband it is located on, 5p15.33 (Extended Data Fig. 3b), are associated with resistance to checkpoint blockade. f, Summary of exome-derived genomic features and logistic regression with response. Neoantigens were estimated using NetMHCpan-4.0 (ref. ) following HLA allele identification with POLYSOLVER. Subclone count was assessed via PhylogicNDT. Aging, smoking and APOBEC burdens were calculated based on the mutation burden attributable to these processes (SBS5, SBS4 and SBS13, respectively) following mutational signature analysis (Extended Data Fig. 4 and Methods). HLA was estimated via LOHHLA. B- and T-cell rearranged receptor abundance was estimated via MiXCR. LOH, loss of heterozygosity; TMB, tumor mutation burden; PR, partial response; CR, complete response; SD, stable disease; PD, progressive disease.
Fig. 2
Fig. 2. Transcriptomic features associated with response and resistance in the SU2C-MARK cohort.
a, Volcano plot of limma voom results for top response-associated genes from RNA-seq samples in the SU2C-MARK cohort (n = 152 RNA samples). Nominal P values from two-sided significance testing are shown. Cutoffs of absolute log2(fold change) > 0.5 and P < 0.05 were used to identify significantly differentially expressed genes (red). b, Hallmark GSEA of response and resistance-associated pathways from limma voom. c, Dot plot of significance values for interferon-gamma (IFN-γ) targets (n = 198 genes), proteasome subunits (n = 56 genes) and immunoproteasome subunits (n = 5 genes). Boxplot overlay depicts the 25th percentile (minima), 50th percentile (center) and 75th percentile (maxima) of distribution with whiskers bounding points within 1.5× interquartile range (Q3–Q1) from each minimum and maximum. Immunoproteasome subunits as a set showed a greater association with response than IFN-γ targets and proteasome targets (P = 7 × 10−9 and P = 4 × 10−6, respectively, two-sided Mann–Whitney U test). d, Contour plot of a linear, 2D model predicting expression of representative immunoproteasome subunit PSMB8 as a function of the inflammatory cytokines IFNG and TNF. Contour levels correspond to roughly 1.2-fold TPM increments in PSMB8 expression. Patients with high expression of both IFNG and TNF demonstrated the highest PSMB8 expression (R2 = 0.31). e, Logistic regression summary results for tumor-associated immune cell signatures derived from single-cell sequencing.
Fig. 3
Fig. 3. Derivation of M subtypes and association with checkpoint blockade response.
a, Overview of M signature generation using B-NMF. b, H-matrix of SU2C-MARK samples and normalized M signature activity from semisupervised B-NMF. c, Dot plot of hallmark GSEA results for B-NMF-derived M signatures. Nominal P values from the one-sided hypergeometric test are shown. d, Swarmplots of selected tumor-associated immune cell signatures by M clusters. Myeloid cells were generally enriched in the wound healing (M-1, n = 52 RNA samples) subtype, while most immune cell types were enriched in the immune-activated (M-2, n = 56 RNA samples) subtype and depleted in the immune desert (M-3, n = 44 RNA samples) subtype (P < 0.001 for all signatures, Kruskal–Wallis test). e, Response rate by M subtype. The immune-activated (M-2) subtype was enriched for responders compared to the wound healing (M-1) and immune desert (M-3) subtypes (P = 0.06, one-sided Fisher’s exact test).
Fig. 4
Fig. 4. Derivation of TI NSCLC transcriptional subtypes.
a, Overview of B-NMF approach to the generation of TI subtype signatures. A total of 1,082 RNA-seq samples spanning the three dominant NSCLC histologies were used as input for signature identification. Specifically, the TCGA LUAD and LUSC cohorts were used in addition to a published LCNE Cohort by George et al. to generate the combined TCGA-LCNE cohort. b, H-matrix of TCGA-LCNE samples and normalized TI signature activity. c, Violin plots of cancer subtype immunohistochemistry markers based on membership in TI clusters TI-1 (n = 81 samples), TI-2 (n = 433 samples), TI-3 (n = 447) and TI-4 (n = 55). Dedifferentiated (TI-1) samples expressed lower levels of canonical adenocarcinoma and squamous markers, but notably high levels of markers associated with neighboring endodermal lineages (top row). Significance was assessed by the Kruskal–Wallis test (***P < 0.001).
Fig. 5
Fig. 5. Association between TI signatures, M signatures and response in the SU2C-MARK cohort.
a, Logistic regression analysis summary in the SU2C-MARK cohort between TI signatures and binned response category (PR/CR versus SD/PD). The dedifferentiated (TI-1) signature showed a significant association with response (q < 0.1, logistic regression with Benjamini–Hochberg adjustment). b, Kernel density estimate plot of the association between the activities of the dedifferentiated (TI-1) signature and the previously identified immune-activated (M-2) signature. c, Response rate in the SU2C-MARK cohort binned by expression of TI-1 and M-2 signatures. Patients with both high TI-1 and high M-2 show the highest response rate.
Fig. 6
Fig. 6. Clinical, genomic and transcriptomic feature integration across the SU2C-MARK cohort.
Cross-correlation heatmap of the top response and resistance-associated features in the SU2C-MARK cohort along with a selection of signatures previously described as relevant to tumor and immune biology,–. The three strongest correlation blocks are outlined and roughly correspond to wound healing (C1), immune activation/exhaustion (C2) and neoantigens (C3). Of note, the direction of association (that is, positive or negative) with immune checkpoint blockade response was consistent for predictors within each of these highlighted correlation blocks.
Fig. 7
Fig. 7. Exploration of top SU2C-MARK transcriptomic features in single-cell data.
a, Leiden clustering of single-cell RNA-seq data from NSCLC colored by cluster ID (upper) or cell-type label (lower). Exploration of tumor markers within the cancer-specific clusters enabled further resolution into NSCLC subtypes, including recapitulation of the dedifferentiated TI-1 subtype identified earlier from bulk RNA-seq data (Cluster 12; Extended Data Fig. 8a). b, Association between cell types identified in NSCLC single-cell data and selected genes and metagenes from the wound healing (C1) and immune activation/exhaustion (C2) feature clusters in the SU2C-MARK cohort or with previously described relationships to immunotherapy response,–. Features within larger correlation blocks in bulk RNA-seq data did not always arise from the same single-cell sources (for example, TGF-β versus macrophages/monocytes in the wound healing cluster, and dedifferentiated TI-1 versus immune-activated M-2 in the immune activation/exhaustion cluster).
Extended Data Fig. 1
Extended Data Fig. 1. Extended SU2C-MARK cohort characterization and genomic predictor evaluation.
(a) Distributions of clinical characteristics in the Stand Up To Cancer - Mark Foundation (SU2C-MARK) cohort. (b) Best overall response (BOR) distribution by PDL1 tumor proportion score (PDL1 TPS) category (significance assessed by two-sided Fisher’s exact test). CR = Complete Response, PR = Partial Response, SD = Stable Disease, PD = Progressive Disease, NE = Not Evaluable. (c,d) Kaplan-Meier curves for Progression-Free Survival (PFS) in EGFR mutated vs. unmutated patients (c) and KRAS/STK11 comutated patients vs. KRAS mutant STK11 umutated patients (d). Both EGFR mutated patients and KRAS/STK11 comutated patients demonstrated decreased progression-free survival relative to their counterparts (p = 0.03 and p = 0.001, respectively, logrank test).
Extended Data Fig. 2
Extended Data Fig. 2. Extended analysis of mutated genes in the SU2C-MARK cohort and comparison to external cohorts.
(a) Significant drivers identified independently in the SU2C-MARK cohort (left) as compared to TCGA Lung Adenocarcinoma (LUAD; right upper) and TCGA Lung Squamous Cell Carcinoma (LUSC; right lower). Of note, the SU2C-MARK cohort includes a mixture of frequent drivers observed in LUAD and LUSC, consistent with it representing pan-NSCLC histologies. (b) Kaplan-Meier curves comparing checkpoint blockade treated ATM mutant patients and ATM wildtype patients in the Memorial Sloan Kettering Cancer Center (MSKCC) Impact cohort. ATM mutated patients demonstrated improved survival compared to unmutated patients (p = 0.03, logrank test).
Extended Data Fig. 3
Extended Data Fig. 3. Extended analysis of somatic copy number alterations within the SU2C-MARK Cohort.
(a) Somatic copy number alterations were analyzed using GISTIC2.0 (ref. ) to identify significantly recurrent focal amplifications and deletions. Strong overlap between the events identified in the SU2C-MARK cohort and those previously described in TCGA LUAD and LUSC was observed. A subset of validated lung cancer drivers within regions of focal copy number alteration are annotated. (b) Volcano plot of logistic regression results for focal amplifications. Focal amplification of cytoband 5p15.33 (which contains TERT) is associated with resistance to checkpoint blockade. CR = Complete Response, PR = Partial Response, SD = Stable Disease, PD = Progressive Disease. (c) Kaplan-Meier curves comparing checkpoint blockade treated patients with and without TERT amplifications (AMP) in the Memorial Sloan Kettering Cancer Center (MSKCC) Impact cohort (p = 0.7, logrank test).
Extended Data Fig. 4
Extended Data Fig. 4. Mutation signature analysis in the SU2C-MARK and TCGA-LCNE cohorts.
(a) Unsupervised mutational signature identification was performed using automatic relevance determination non-negative matrix factorization (ARD-NMF) on the combined SU2C-MARK and TCGA-LCNE cohorts. The TCGA-LCNE cohort comprises TCGA lung adenocarcinoma (LUAD), lung squamous cell carcinoma (LUSC), and published large cell neuroendocrine (LCNE) cohorts. Of the 7 signatures identified, the predominant signatures corresponded to COSMIC signatures for Aging (SBS5), Smoking (SBS4), and APOBEC (SBS13). Plots display mutational signatures identified in each sample based on mutation counts (left) as well as fraction of signature attributable mutations (right) with a shared color key for both plots. (b) Barplot of signature profiles demonstrating relative contribution from each 96-base context. Signatures were subsequently assigned to previously described COSMIC signatures based on cosine similarity.
Extended Data Fig. 5
Extended Data Fig. 5. Extended response and resistance associated genes and signatures in the SU2C-MARK Cohort.
(a) Expression of top 10 significant protein-coding transcripts associated with response (PR/CR, left; N = 52 RNA samples) and nonresponse (SD/PD, right; N = 84 RNA samples). Boxplot overlay depicts 25th percentile (minima), 50th percentile (center), and 75th percentile (maxima) of distribution with whiskers bounding points within 1.5 X interquartile range (Q3–Q1) from each minimum and maximum. PR = Partial Response, CR = Complete Response, SD = Stable Disease, PD = Progressive Disease, TPM = transcripts per million (b) Volcano plot for Limma results for cohort wide analysis subsetted to Interferon Targets, Proteasome Subunits, and Immunoproteasome Subunits. (c) Scatterplots comparing 5 inducible components of the immunoproteasome against each other as well as IFNG. Regression line and bootstrapped 95% confidence interval are displayed.
Extended Data Fig. 6
Extended Data Fig. 6. Significance testing of single cell profiling derived myeloid subsets and checkpoint blockade response in the SU2C-MARK Cohort.
Logistic regression significance values for myeloid cell signatures derived from single cell profiling (Benjamini–Hochberg q-value). hMono3 and hN3 were classified as near-significant (q < 0.25) in their association with nonresponse. PR = Partial Response, CR = Complete Response, SD = Stable Disease, PD = Progressive Disease.
Extended Data Fig. 7
Extended Data Fig. 7. Comparison of single-cell profiling derived myeloid subsets with Microenvironment (M) subtypes in the SU2C-MARK Cohort.
Swarmplot of myeloid cell signatures derived from single cell profiling across Microenvironmental subtypes. Significance of association was assessed by Kruskal–Wallis test (* p < 0.05, ** p < 0.01, *** p < 0.001).
Extended Data Fig. 8
Extended Data Fig. 8. Extended analysis of Tumor-Intrinsic (TI) subtypes.
(a) Alluvial plot of Tumor Intrinsic (TI) subtype downsampling analysis ranging from full TCGA-LCNE cohort (N = 1082) to under 50% downsample (N = 500). The TCGA-LCNE cohort comprises TCGA lung adenocarcinoma (LUAD), lung squamous cell carcinoma (LUSC), and published large cell neuroendocrine (LCNE) cohorts. Both overall distribution and individual sample membership were well preserved across downsamples. (b) Confusion matrix of TCGA-LCNE cohort comparing TI subtype assignment with study source. The novel de-differentiated (TI-1) subtype included predominantly TCGA LUAD samples, with a smaller contribution from TCGA LUSC. (c) Expression scatterplot of canonical adenocarcinoma and squamous cell carcinoma markers, NAPSA (Napsin A) and TP63 (encoding both p40 and p63), respectively, across the TCGA-LCNE Cohort. Samples are colored by TI cluster assignment, with neither de-differentiated (TI-1) nor LCNE (TI-4) samples showing strong canonical lineage marker expression. TPM = transcripts per million. (d) Tumor mutation burden (TMB) for Tumor Intrinsic subtypes TI-1 (N = 81 patients), TI-2 (N = 433 patients), TI-3 (N = 447 patients), and TI-4 (N = 55 patients) in the TCGA-LCNE Cohort. The De-differentiated (TI-1) subtype had an increased mutation burden compared to the Adeno (TI-2) and Squamous (TI-3) subtypes (p = 9 ×10⁻⁶ and p = 0.002, respectively, two-sided Mann–Whitney U test). (e) Violinplots of Tumor Intrinsic signatures by membership in Microenvironment clusters M-1 (N = 52 RNA samples), M-2 (N = 56 RNA samples), and M-3 (N = 44 RNA samples).
Extended Data Fig. 9
Extended Data Fig. 9. Evaluation of correlation in TCGA data between top SU2C-MARK predictors and assessment of their ability to further stratify clinically relevant subgroups of the SU2C-MARK cohort.
(a) Cross-correlation heatmap of the top response and resistance associated features in the SU2C-MARK cohort as assessed in TCGA LUAD and LUSC combined datasets (N = 1018),–. Correlation cluster and response association colorbars based on designations in the SU2C-MARK cohort are plotted. Unsupervised hierarchical clustering re-identifies the previously recognized feature clusters corresponding to Wound Healing (C1), Immune Activation/Exhaustion (C2), and Neoantigens (C3). Nearly all features retain their original cluster designations (the relocation of the De-Differentiated TI-1 signature may relate to its association with high mutation burden as described earlier). (b) Contribution of SU2C-MARK predictors to clinically relevant biomarker subsets. The addition of features from the Wound Healing (C1) and Immune Activation/Exhaustion (C2) clusters meaningfully stratify traditionally favorable (for example, PDL1 high) and unfavorable (for example, PDL1 low) clinical subgroups (q = 0.06 and q = 0.16, respectively, Benjamini–Hochberg adjusted logrank test). TMB = Tumor Mutation Burden. (c) Association of top genomic predictors from SU2C-MARK cohort with Progression-Free Survival (PFS) for clinically relevant subgroups of NSCLC, namely high TMB ( > 10 mut/MB, top; favorable), high PD-L1 tumor proportion score (PDL1 TPS) corresponding to PDL1 TPS ≥ 50% (middle; favorable), and low PD-L1 expression (PDL1 TPS ≤ 1%, bottom; unfavorable). Signed FDR q-values based on Benjamini–Hochberg adjustment of logrank p-values are plotted for each feature (Methods).
Extended Data Fig. 10
Cell type identification and feature analysis from previously published single cell RNA-Seq data in NSCLC. (a) Analysis of top immunohistochemistry (IHC) markers for Tumor Intrinsic (TI) subtypes in single cell non-small cell lung cancer (NSCLC) data. Leiden cluster 12 demonstrated moderate expression of all 3 IHC markers for the De-Differentiated TI-1 subtype identified from bulk RNA-Seq. Other cluster demonstrated Adeno, Squamous, or mixed Adeno/Squamous markers, with no predominantly Large Cell clusters. (b) Dotplots of the top 10 favorable (left) and unfavorable (right) single genes identified in limma voom analysis of the SU2C-MARK cohort, as expressed in single cell NSCLC data. As observed for features in the larger correlation blocks earlier (Fig. 7b), individual predictors with uncorrelated single cell profiles could be found within each category (for example, CXCL9 vs. CXCL11 among favorable predictors, and SIPA1L2 and PDLIM3 within unfavorable predictors).

References

    1. Brahmer J, et al. Nivolumab versus docetaxel in advanced squamous-cell non-small-cell lung cancer. N. Engl. J. Med. 2015;373:123–135. - PMC - PubMed
    1. Borghaei H, et al. Nivolumab versus docetaxel in advanced nonsquamous non-small-cell lung cancer. N. Engl. J. Med. 2015;373:1627–1639. - PMC - PubMed
    1. Herbst RS, et al. Pembrolizumab versus docetaxel for previously treated, PD-L1-positive, advanced non-small-cell lung cancer (KEYNOTE-010): a randomised controlled trial. Lancet. 2016;387:1540–1550. - PubMed
    1. Reck M, et al. Pembrolizumab versus chemotherapy for PD-L1-positive non-small-cell lung cancer. N. Engl. J. Med. 2016;375:1823–1833. - PubMed
    1. Paz-Ares L, et al. Pembrolizumab plus chemotherapy for squamous non-small-cell lung cancer. N. Engl. J. Med. 2018;379:2040–2051. - PubMed

Publication types

MeSH terms

Substances