. 2023 May;55(5):841-851.
doi: 10.1038/s41588-023-01366-2. Epub 2023 Apr 6.

Precise modulation of transcription factor levels identifies features underlying dosage sensitivity

Affiliations

Precise modulation of transcription factor levels identifies features underlying dosage sensitivity

Sahin Naqvi et al. Nat Genet. 2023 May.

Abstract

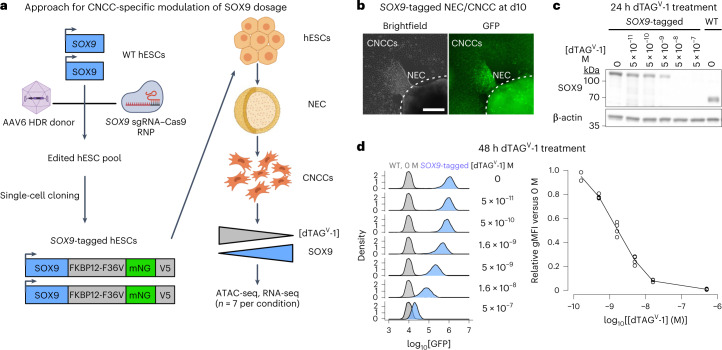
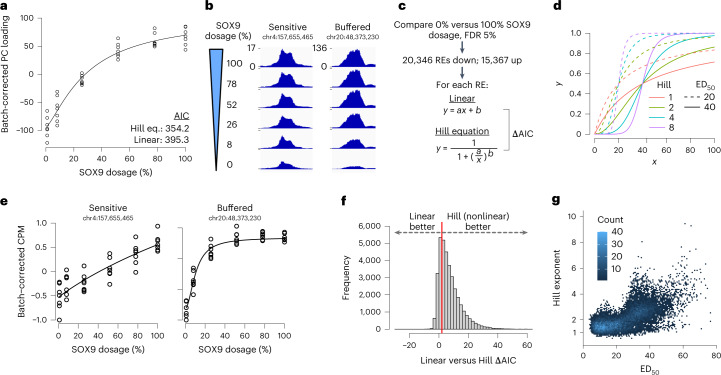
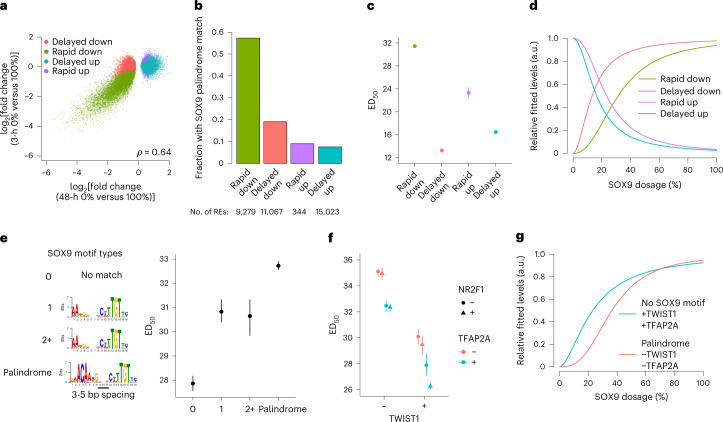
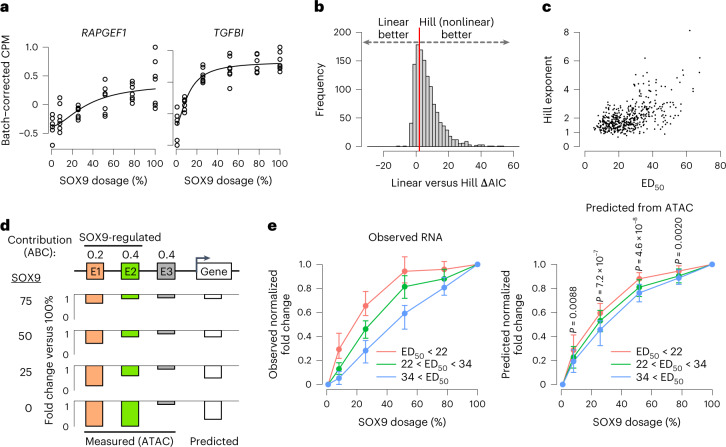
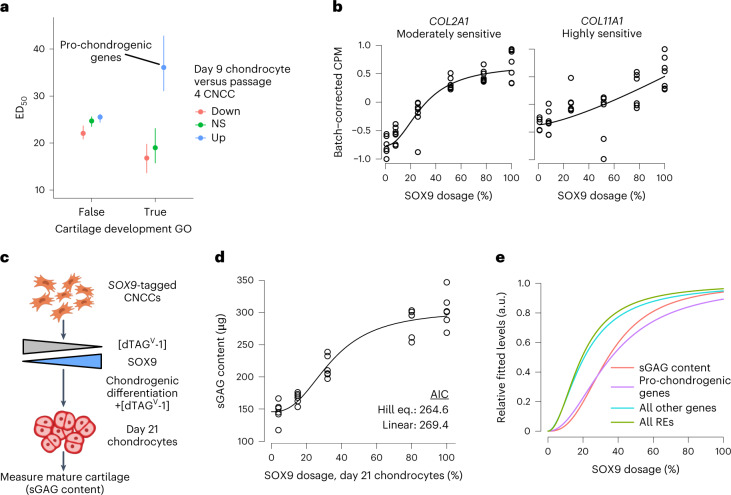
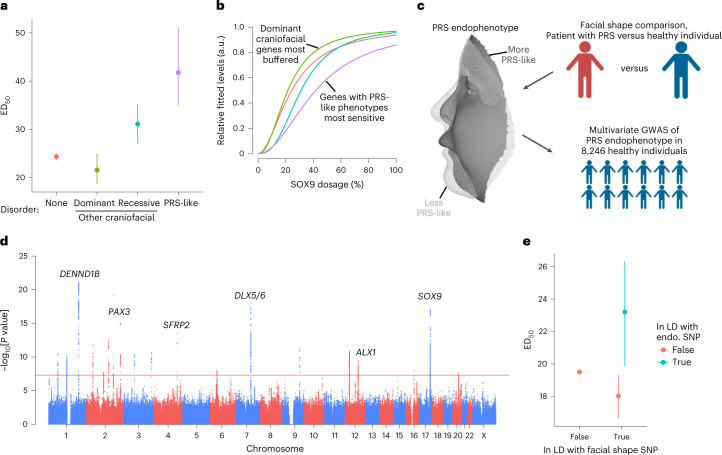
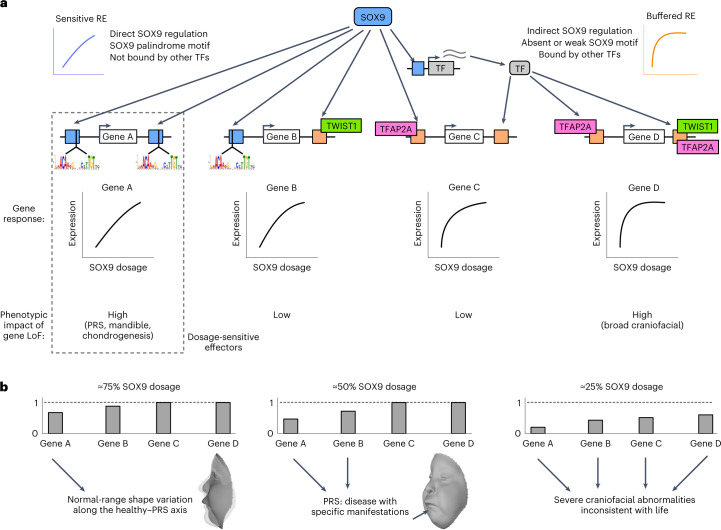
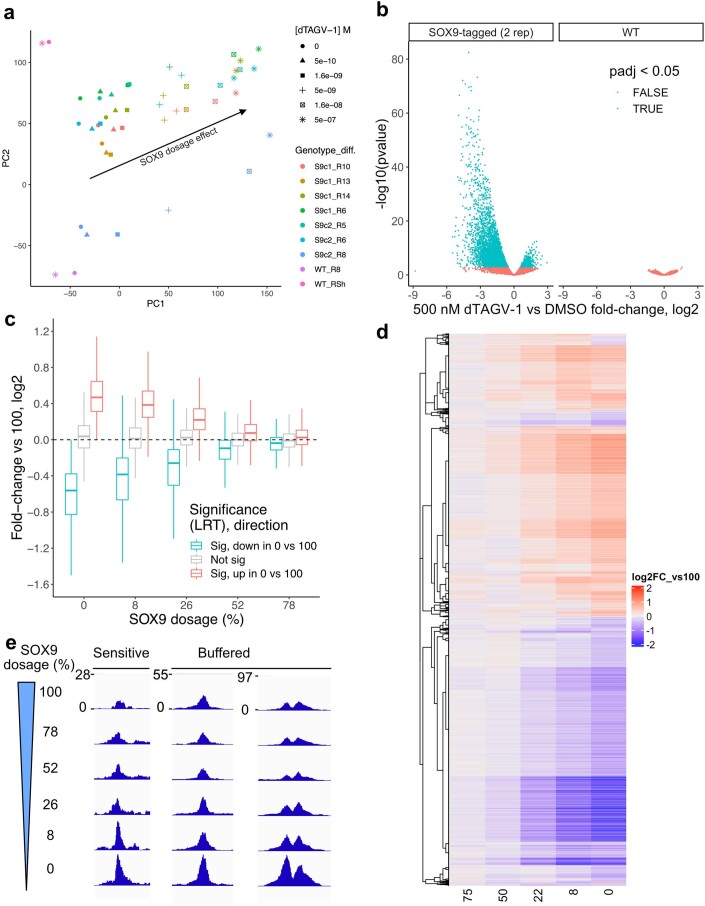
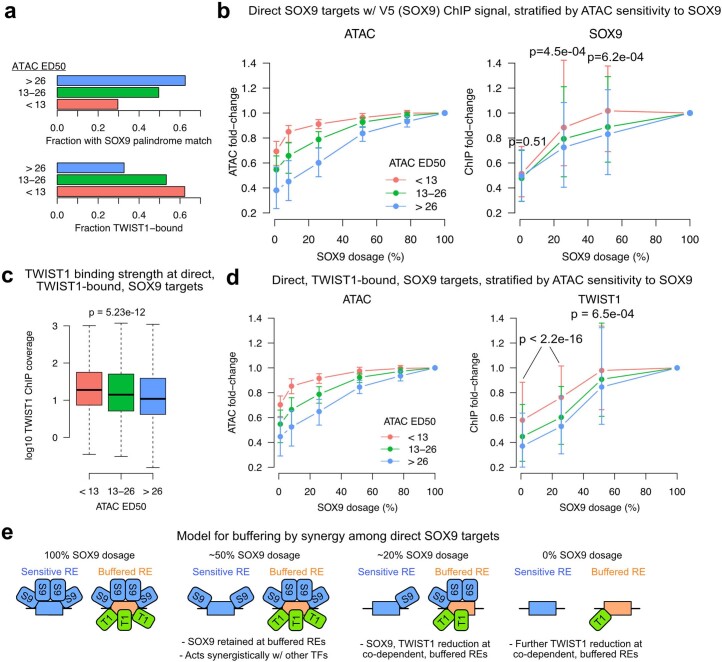
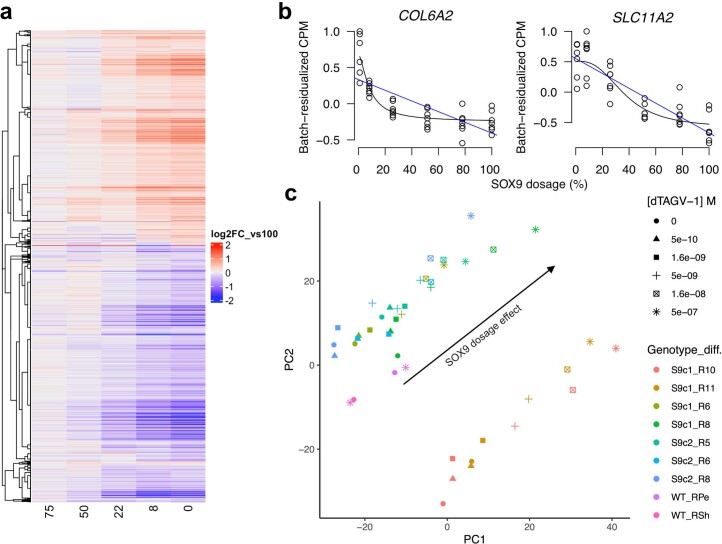
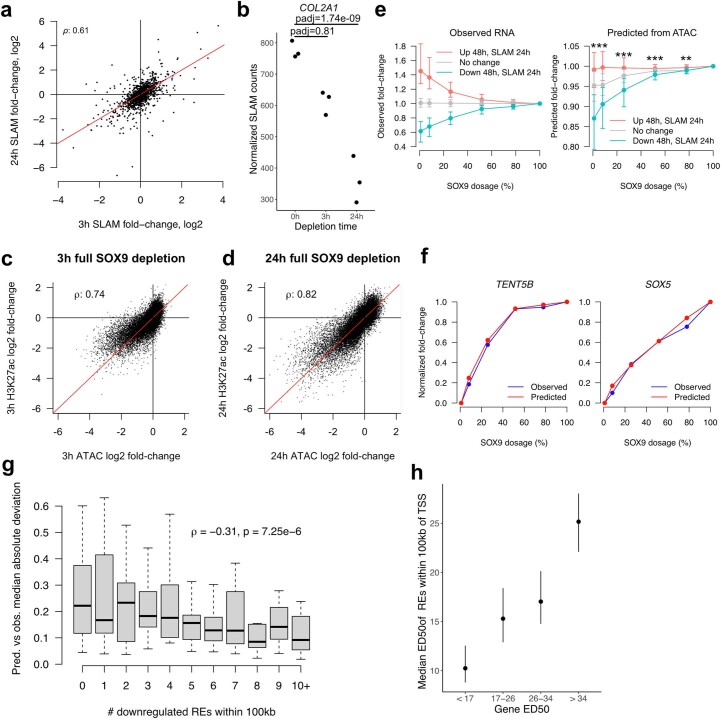
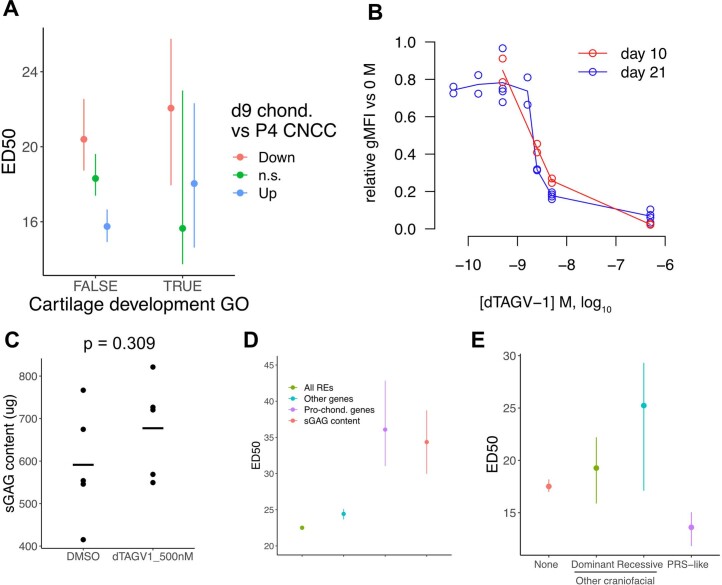
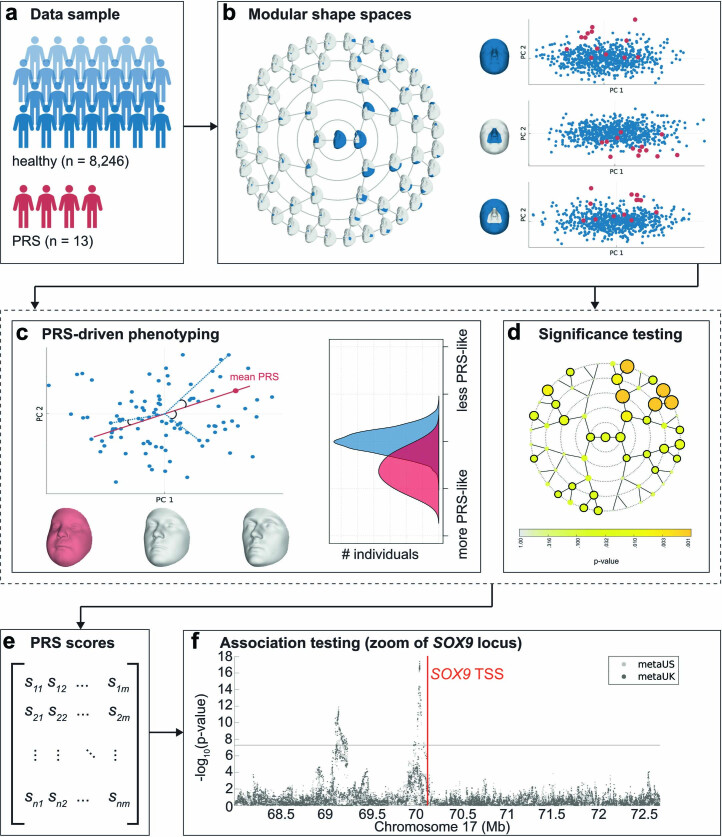
Transcriptional regulation exhibits extensive robustness, but human genetics indicates sensitivity to transcription factor (TF) dosage. Reconciling such observations requires quantitative studies of TF dosage effects at trait-relevant ranges, largely lacking so far. TFs play central roles in both normal-range and disease-associated variation in craniofacial morphology; we therefore developed an approach to precisely modulate TF levels in human facial progenitor cells and applied it to SOX9, a TF associated with craniofacial variation and disease (Pierre Robin sequence (PRS)). Most SOX9-dependent regulatory elements (REs) are buffered against small decreases in SOX9 dosage, but REs directly and primarily regulated by SOX9 show heightened sensitivity to SOX9 dosage; these RE responses partially predict gene expression responses. Sensitive REs and genes preferentially affect functional chondrogenesis and PRS-like craniofacial shape variation. We propose that such REs and genes underlie the sensitivity of specific phenotypes to TF dosage, while buffering of other genes leads to robust, nonlinear dosage-to-phenotype relationships.


Conflict of interest statement

J.W. serves on the scientific advisory board for Camp4 Therapeutics and Paratus Sciences. All other authors declare no competing interests.

Figures

Fig. 1
Fig. 1. Precise modulation of SOX9 dosage in hESC-derived CNCCs.
a, Schematic of hESC editing and CNCC-specific SOX9 titration approach using dTAG. AAV, adeno-associated virus; HDR, homology-directed repair; RNP, ribonucleoprotein; NECs, neuroectodermal spheres; mNG, mNeonGreen. b, Live-cell imaging of mNeonGreen fluorescence in attached NEC and migrating CNCCs derived from SOX9-tagged hESCs at the time of CNCC delamination from neuroepithelial spheres (day 10). Images representative of three independent differentiations. Scale bar, 200 μm. c, Western blot of SOX9 in SOX9-tagged or WT passaged mesenchymal CNCCs, treated with indicated concentrations of dTAGV-1 for 24 h. Representative of two independent experiments. d, Flow cytometry analysis of mNeonGreen fluorescence intensity at 48 h in SOX9-tagged CNCCs as a function of increasing dTAGV-1 concentrations across single cells (left, at least 7,000 cells per histogram, representative of two independent experiments for 5 × 10−11 M and four independent experiments for all other concentrations) or averaged per biological replicate (differentiation or clone, right). gMFI, geometric mean. Source data
Fig. 2
Fig. 2. Most SOX9-dependent REs are buffered in their response to SOX9 dosage changes, with a sensitive subset.
a, Loadings from PC analysis of ATAC-seq CPM of all 151,457 REs across all CNCC samples (see Extended Data Fig. 2a), corrected for differentiation batch and plotted as a function of estimated relative SOX9 dosage (shown as percentage relative to no dTAGV-1). Black line represents Hill equation fit. Points are biological (differentiation or clone) replicates. b, Example ATAC-seq browser tracks of individual RE accessibility at different SOX9 dosages (y axis, normalized coverage in 10-bp bins, identical range in all browser tracks), averaged across all replicates at each dosage. c, Schematic of approach to model nonlinearity of SOX9-dependent REs. a and b in linear model refer to slope and intercept, respectively. a and b in Hill equation refer to ED50 and Hill exponent, respectively. d, Illustration of different ED50 and Hill exponent values on theoretical Hill equation curves. e, Individual REs from b with replicates, fitted by Hill equation (black line). f, Histogram of ΔAIC of all 35,713 SOX9-dependent REs. Red line indicates ΔAIC = 2. g, Scatterplot of ED50 and Hill exponent of 23,414 SOX9-dependent REs with good fit (P < 0.05 for both parameters).
Fig. 3
Fig. 3. Features affecting sensitivity of the RE response to SOX9 dosage.
a, Scatterplots of full SOX9 depletion effect on chromatin accessibility at 48 h (x axis) versus 3 h (y axis) for all 48-h SOX9-dependent REs. b, Barplot indicating fraction of REs containing a SOX9 palindrome (3–5-bp spacing), stratified by time delay of response. c, ED50 of REs stratified by time delay of response. d, Median dosage curves based on the median fitted ED50 and Hill exponents for each group. a.u., arbitrary units. N in c,d indicated in b. e,f, ED50 of rapid-down REs (likely direct SOX9 targets) stratified by SOX9 motif type, with motif position weight matrices on the left (e), or overlap with ChIP–seq peaks for TWIST1 (x axis) TFAP2A (color) and NR2F1 (shape) (f). n of groups from left to right in e: 2,263, 1,315, 360, 5,221. n of groups from left to right in f: 1,874, 736, 985, 1,805, 774, 602, 296, 2,087. g, Median dosage curves as in d for the indicated combinations of SOX9 motif and binding of other TFs. Points and error bars in (c,e,f) represent median and 95% confidence intervals as computed by 200 bootstraps (see Methods).
Fig. 4
Fig. 4. RE dose–response curves partially predict the shape of gene dose–response curves.
a, Examples of genes with sensitive (left) or buffered (right) responses to SOX9 dosage changes, as assessed by RNA-seq. Black lines represent Hill equation fits. b, Histogram of ΔAIC of all 1,232 SOX9-dependent genes, calculated as in Fig. 2c. Red line indicates ΔAIC = 2. c, ED50 and Hill exponent of 832 SOX9-dependent genes with good fit (P < 0.05 for both parameters). d, Schematic of approach to predict RNA level changes based on ABC contribution scores and fold changes of REs at each SOX9 dosage. e, Distributions of observed (left) or predicted (right) fold changes versus full SOX9 dosage at each concentration, normalized to full-depletion fold change and stratified by ED50 (colors). Only genes transcriptionally downregulated by 24-h full SOX9 depletion (assessed by metabolic labeling, SLAM-seq) are analyzed. n of groups by color: red, 66; green, 77; blue, 57. Points and error bars represent median and 25th and 75th percentiles of distribution. Indicated P values are from two-sided Kruskal–Wallis test comparing distributions of the three colored groups.
Fig. 5
Fig. 5. The pro-chondrogenic program is sensitive to SOX9 dosage.
a, ED50 of SOX9-downregulated genes stratified by presence in the ‘Cartilage development’ Gene Ontology (GO) category (x axis), and expression change in chondrocytes compared to CNCCs (color, data from ref. ). n of groups from left to right: 157, 269, 241, 6, 4, 11. Points and error bars represent median and 95% confidence intervals as computed by 200 bootstraps (see Methods). b, Examples of known pro-chondrogenic genes that are moderately or highly sensitive to SOX9 dosage. c, Schematic of approach to titrate SOX9 dosage during 21-day chondrogenic differentiation. d, Sulfated glycosaminoglycan (sGAG, representative of mature cartilage) content at day 21 of chondrogenesis as a function of SOX9 dosage as estimated in Extended Data Fig. 9b. Black curve represents Hill equation fit. e, Median dosage curves based on fitted ED50 and Hill exponents for all REs and genes, pro-chondrogenic genes (purple, labeled group in a) and sGAG content (from d).
Fig. 6
Fig. 6. Genes and REs associated with PRS-like phenotypes are uniquely sensitized to SOX9 dosage.
a, ED50 of SOX9-downregulated genes stratified by craniofacial disorder association. PRS-like associations as defined by Perrine et al. 2020 (ref. ). n of groups from left to right: 665, 13, 6, 8. b, Median dosage curves (based on both ED50 and Hill exponent) of the same groups from a. c, Schematic of approach to conduct a multivariate GWAS on a PRS-defined endophenotype in healthy human individuals. d, Manhattan plot of PRS endophenotype GWAS. Red line indicates genome-wide significance. Candidate genes near top GWAS signals are labeled. e, ED50 of REs stratified by linkage disequilibrium (LD, r2 > 0.5) with any facial shape GWAS lead SNP (x axis, as defined in Naqvi, Hoskens et al. 2022 (ref. ) and further with any lead SNP associated with the PRS endophenotype GWAS from d (color). n of groups from left to right: 35,450, 209, 54. Points and error bars in a,e represent median and 95% confidence intervals as computed by 200 bootstraps (see Methods).
Fig. 7
Fig. 7. Dosage-sensitive effectors transmit the effect of quantitative changes in SOX9 dosage to provide phenotypic specificity.
a, Schematic indicating which features make REs sensitive (blue) or buffered (orange) to SOX9 dosage. Dosage-sensitive effectors are REs and genes mediating changes in cellular behaviors as a result of quantitative changes to their activity or expression, and thus with high phenotypic impact (dashed rectangle), as compared to sensitive genes with low phenotypic impact (gene B) or phenotypically impactful genes that are buffered (gene D). LoF, loss of function. b, Schematic of gene expression changes in response to the indicated SOX9 dosages based on sensitivities from a. Arrows indicate the contribution of the gene to phenotype.
Extended Data Fig. 1
Extended Data Fig. 1. Endogenous C-terminal tagging of SOX9.
(a) Genome editing of WT hESCs to derive SOX9-tagged hESCs. Top, schematic depicting primer (arrow) locations for clonal genotyping of the SOX9 locus. SOX9LHA-FKBP12FV36-mNG-V5-SOX9RHA is the full homology-directed repair template provided by AAV6, so the right primer is located outside the homology arm. Bottom, agarose gel images of PCR using depicted primers on 48 analyzed hESC clones nucleofected with SOX9 sgRNA-Cas9 RNP and transduced with tag-containing AAV6. * clones with bi-allelic knock-in. (b) Single-cell distributions of mNeonGreen fluorescence (at least 7,000 cells per histogram) between two SOX9-tagged clones from two CNCC replicates. Representative of two independent experiments. Source data
Extended Data Fig. 2
Extended Data Fig. 2. Effects of SOX9 dosage changes on chromatin accessibility.
(a) Principal component analysis of ATAC-seq counts per million (CPM) of all 151,457 REs across all CNCC samples. Shapes indicate the dTAGV-1 concentration treated for 48 h. Colors indicate the combination of hESC line from which CNCCs were derived and differentiation batch (S9c1/2 = SOX9-tagged clone1/2). Arrow indicates the SOX9 dosage effect. (b) Volcano plot of 500 nM dTAGV-1 treatment on two SOX9-tagged (left) or two WT (right) CNCC differentiation replicates for all 151,457 REs. -log10(p-value) (y-axis) represents the unadjusted two-sided p-value from DESeq2, point color represents Benjamini-Hochberg adjusted p-value. (c) Distributions of fold-changes versus full (100) SOX9 dosage for all REs for which SOX9 dosage explains a significant (5% FDR; red, 16,538; blue, 27,334) or nonsignificant (grey, n = 107,585) amount of variance (likelihood ratio test, LRT), stratified by the direction of change in full SOX9 depletion. Boxplot center represents median, box bounds represent 25th and 75th percentiles, and whiskers represent 5th and 95th percnetiles. (d) Same fold-change values as in (c) for a random subset (n = 10,000) of significant REs, plotted as a heatmap and clustered by row based on Kendall distance. (e) Example ATAC-seq browser tracks of individual RE accessibility at different SOX9 dosages (y-axis, normalized coverage in 10 bp bins), averaged across all replicates at each dosage.
Extended Data Fig. 3
Extended Data Fig. 3. Fitted ED50 values are well-correlated with orthogonally calculated measures of sensitivity.
For all SOX9-dependent REs with good Hill equation fits (p < 0.05 for both ED50 and Hill exponent), correlation between either ED50 (left, Spearman ρ −0.961) or Hill exponent (right, Spearman ρ −0.457) and buffering index calculated at 50% SOX9 dosage. See Methods for details on calculation of buffering index – 0 means no buffering (effect of 100 to 50% SOX9 dosage on RE accessibility is 50% of effect of 100 to 0% SOX9 dosage), 100 means full buffering (no effect of 100 to 50% SOX9 dosage on RE accessibility, but substantial effect of 100 to 0% SOX9 dosage).
Extended Data Fig. 4
Extended Data Fig. 4. Rapidly responding REs are likely direct targets of SOX9.
(a) mNeonGreen fluorescence intensity (at least 5,000 cells per histogram) in SOX9-tagged or WT CNCCs with the times of treatment by dTAGV-1. (b) V5 ChIP-seq signal from CNCCs with V5-tagged SOX9 present (‘SOX9-tagged V5’) or absent (‘WT’) plotted over sets of SOX9-dependent REs as defined in Fig. 3a. (c) Hill exponent of rapid down REs stratified by SOX9 motif type, with motif position weight matrices as in Fig. 3e. N of groups from left to right: 2,263, 1,315, 360, 5,221. (d) For the SOX9 palindrome motif at with a 0–10 bp spacing between the inverted repeats (y-axis), rapid down REs were stratified on the basis of that motif match. N of blue color groups from bottom to top: 448, 1,249, 1,010, 1,740, 2,628, 1,593, 1,157, 931, 839, 1,249, 1,233. N of red color groups from bottom to top: 7,532, 7,933, 8,200, 7,410, 6,458, 7,568, 8,034, 8,289, 8,371,. Points and error bars represent median and 95% confidence intervals as computed by bootstrap (see Methods).
Extended Data Fig. 5
Extended Data Fig. 5. Additional features affecting sensitivity of the RE response to SOX9 dosage changes among direct SOX9 targets.
ED50 of rapid down SOX9-dependent REs, stratified by (a) magnitude of change in response to full SOX9 depletion, (b) presence of Coordinator (TWIST1), NR2F1, or TFAP2A sequence motif matches, baseline levels of (c) H3K27ac or (d) chromatin accessibility, or (e) the combination of SOX9 motif type and TWIST1/TFAP2A binding by ChIP-seq. For (a), (c), and (d), higher deciles mean higher values, and N of each decile is 928 (except for deciles 1 and 6 for which N = 927). For (b), N of groups from left to right: 1,539, 879, 1,735, 1,200, 1,693, 718, 952, 563. For (e), N of red circle groups from left to right: 578, 353, 87, 1,603; N of blue circle groups from left to right: 660, 389, 110, 1,712; N of red triangle groups from left to right: 454, 208, 54, 650; N of blue triangle groups from left to right: 691, 375, 107, 1,248. Points and error bars represent median and 95% confidence intervals as computed by bootstrap (see Methods).
Extended Data Fig. 6
Extended Data Fig. 6. Binding of SOX9 and TWIST1 in response to SOX9 dosage changes.
(a) Fractions of rapidly downregulated REs with SOX9 palindrome match (top) or TWIST1 binding (bottom), stratified by ATAC-seq sensitivity (ED50) to SOX9 dosage (colors). N of groups by color: red, 823; green, 2,473; blue, 5983. (b) Distributions of ATAC-seq (left) or SOX9 (V5) ChIP-seq (right) fold-changes vs full SOX9 dosage at each concentration for rapidly downregulated REs with SOX9-dependent ChIP-seq signal (DESeq2 log2FoldChange < 0 in 0 vs 100 SOX9 dosage), stratified based on ATAC-seq sensitivity to SOX9 dosage (colors). N of groups by color: red, 106; green, 391; blue, 666. P-values from two-sided Kruskal-Wallis tests comparing each instance of three groups. (c) Unperturbed TWIST1 ChIP-seq signal at TWIST1-bound, rapidly downregulated REs stratified based on ATAC-seq sensitivity to SOX9 dosage (colors). N of groups by color: red, 513; green, 1318; blue, 1956. Boxplot center represents median, box bounds represent 25th and 75th percentiles, and whiskers represent 5th and 95th percentiles. (d) TWIST1 ChIP-seq fold-changes vs full SOX9 dosage at same groups of REs as in (c). In (b) and (d), points and error bars represent median and 25th and 75th percentiles of distribution. (e) Models for RE buffering by synergistic TF functions. P-values from two-sided Kruskal-Wallis tests comparing each instance of three groups.
Extended Data Fig. 7
Extended Data Fig. 7. Effects of SOX9 dosage changes on gene expression.
(a) Heatmap of fold-changes versus full (100) SOX9 dosage for all all genes for which SOX9 dosage explains a significant (5% FDR) amount of variance (likelihood ratio test), clustered by row based on Kendall distance (b) Examples of genes upregulated in response to SOX9 depletion with buffered (left) or sensitive (right) responses. Black and blue lines represent Hill and linear fits, respectively (c) Principal component analysis of RNA-seq counts per million (CPM) across all SOX9-tagged and WT CNCC samples. Shapes indicate the dTAGV-1 concentration treated for 48 h. Colors indicate the combination of hESC line from which CNCCs were derived and differentiation batch (S9c1/2 = SOX9-tagged clone1/2). Arrow indicates the SOX9 dosage effect.
Extended Data Fig. 8
Extended Data Fig. 8. Measuring and predicting response of transcriptionally regulated SOX9 target genes.
(a) Scatterplot of effects of full SOX9 depletion for 3 h (x-axis) versus 24 h (y-axis) on nascent transcription, as assayed by SLAM-seq, for all SOX9-dependent genes (that is responding to full SOX9 depletion for 48 h in RNA-seq). Y = x line in red. (b) Effects of full SOX9 depletion on transcription of COL2A1, a known direct target of SOX9. Points represent SLAM-seq counts from biological replicates, adjusted p-value calculated by DESeq2. (c, d) For all REs responding to full depletion of SOX9 at 48 h, the effects of 3 h (c) or 24 h (d) full SOX9 depletion on chromatin accessibility (ATAC-seq, x-axis) or H3K27ac levels (ChIP-seq, y-axis) is plotted. (e) Distributions of observed (left) or predicted (right) fold-changes vs full SOX9 dosage at each concentration, stratified based on direction of transcriptional response to full SOX9 depletion (colors). N of groups by color: red, 184; grey, 10,339; blue, 197. Points and error bars represent median and 25th and 75th percentiles of distribution. ** p = 2.1e-12, *** p < 2.2e-16, two-sided Kruskal-Wallis test comparing the three groups. (f) Examples of predictions for a buffered (left) or sensitive (right) gene. (g) Median absolute deviation between observed and predicted dosage response curves for transcriptionally downregulated genes, stratified by number of SOX9-downregulated REs within 100 kb of TSS. Spearman rho for correlation and associated two-sided p-value are shown. N of groups from left to right: 227, 238, 173, 162, 105, 77, 55, 35, 32, 26, 49. Boxplot center represents median, box bounds represent 25th and 75th percentiles, and whiskers represent 5th and 95th percentiles. (h) Median ED50 of REs within 100 kb of the TSS of transcriptionally downregulated genes stratified by sensitivity to SOX9 dosage. N of groups from left to right: 27, 27, 27, 28. Points and error bars represent median and 95% confidence intervals as computed by bootstrap (see Methods). All reported correlation coefficients in this figure are Spearman rho values.
Extended Data Fig. 9
Extended Data Fig. 9. Effects of SOX9 dosage on chondrogenesis.
(a) ED50 of SOX9-upregulated genes stratified by presence in the ‘Cartilage development’ Gene Ontology (GO) category (x-axis), and expression change in chondrocytes compared to CNCCs (color, data from Long et al.). N of groups from left to right: 94, 217, 204, 3, 9, 17. Points and error bars in (a,e) represent median and 95% confidence intervals as computed by bootstrap (see Methods). (b) Fluorescence intensity at day 10 (red) or 21 (blue) of chondrogenesis in SOX9-tagged chondrocytes as a function of dTAGV-1 concentration. gMFI, geometric mean. (c) Sulfated glycosaminoglycan (sGAG, representative of mature cartilage) at day 21 of chondrogenesis in WT CNCCs treated with DMSO or 500 nM dTAGV-1 (N = 5 for each group). Bars represent mean, p-value from two-sided T-test. (d) Fitted ED50 values for all SOX9-downreguated REs (N = 20,346) and other genes (N = 688), pro-chondrogenic genes (N = 11), and sGAG content (experiment depicted in Fig. 5d with N = 6 replicates per SOX9 concentration). Points (median) and error bars (95% confidence) for genes and REs computed by bootstrap, ED50 point estimate and 95% confidence interval for sGAG content estimated from Hill equation model fit. (e) ED50 by craniofacial disorder association for genes upregulated upon SOX9 depletion. Gene-craniofacial disorder associations determined as in Fig. 6a. N of groups from left to right: 508, 20, 9, 5. Points and error bars represent median and 95% confidence intervals as computed by bootstrap (see Methods).
Extended Data Fig. 10
Extended Data Fig. 10. Endophenotype definition approach and GWAS in healthy individuals.
(a) The study sample consisted of 8,246 healthy, unrelated European-ancestry individuals and 13 patients with Pierre Robin Sequence (PRS). (b) Global-to-local segmentation of 3D facial shape obtained using hierarchical spectral clustering of the European cohort. For each of the facial segments (n = 63) a shape space is established based on the larger European cohort (blue dots) using PCA, describing the main axes of variation in the data. The PRS facial shapes (red dots) are then aligned and projected onto each segment-derived PCA space. (c) Per facial segment, a PRS-driven univariate trait is defined as the vector passing through the global European average facial shape (center) and the PRS average (red dot). Each trait or direction (red line) represents a complex shape transformation that codes for PRS-characteristic facial features, as displayed by the three facial morphs (right = typical PRS face; middle = average face; left = opposite or anti-face). In a leave-one-out approach, each individual was scored on the PRS-driven facial traits by computing the cosine of the angle between the vector going from the global European average to each participant (blue dotted lines), and the vector from the global European average to the average PRS projection (red line). Scores range from 0 to 2, with scores close to 0 indicating the presence of facial features similar to those typically observed in PRS, whereas scores close to 2 correspond to features opposite to PRS. (d) To test the significance of the PRS-driven trait in each facial segment, the sample of PRS were compared to a matched control sample of equal size drawn from the larger European cohort using partial least squares regression and a p-value was generated by a 10,000-fold permutation test. In 30 out of 63 facial segments a significant difference (p < =0.05, black encircled segments) was observed between the PRS sample and healthy controls. (e) The scores on each of the 30 significant traits were combined into a single phenotype matrix ([8246 ×30]) (f) and subsequently tested for genotype-phenotype associations in a multivariate GWAS meta-analysis approach using canonical correlation analyses. Association statistics (y-axis) per SNP (x-axis) are displayed in the Manhattan plot zoomed into the SOX9 locus in two different cohorts (color). Location of the SOX9 transcription start site (TSS) is indicated in red. Horizontal line represent genome-wide significance.

References

    1. Spitz F, Furlong EEM. Transcription factors: from enhancer binding to developmental control. Nat. Rev. Genet. 2012;13:613–626. - PubMed
    1. Waddington CH. Canalization of development and genetic assimilation of acquired characters. Nature. 1959;183:1654–1655. - PubMed
    1. Frankel N, et al. Phenotypic robustness conferred by apparently redundant transcriptional enhancers. Nature. 2010;466:490–493. - PMC - PubMed
    1. Osterwalder M, et al. Enhancer redundancy provides phenotypic robustness in mammalian development. Nature. 2018 doi: 10.1038/nature25461. - DOI - PMC - PubMed
    1. Kasowski M, et al. Variation in transcription factor binding among humans. Science. 2010;328:232–235. - PMC - PubMed

Publication types

Substances