. 2023 Apr 6;6(1):248.
doi: 10.1038/s42003-023-04590-y.

Chemical and genomic characterization of a potential probiotic treatment for stony coral tissue loss disease

Affiliations

Chemical and genomic characterization of a potential probiotic treatment for stony coral tissue loss disease

Blake Ushijima et al. Commun Biol. .

Abstract

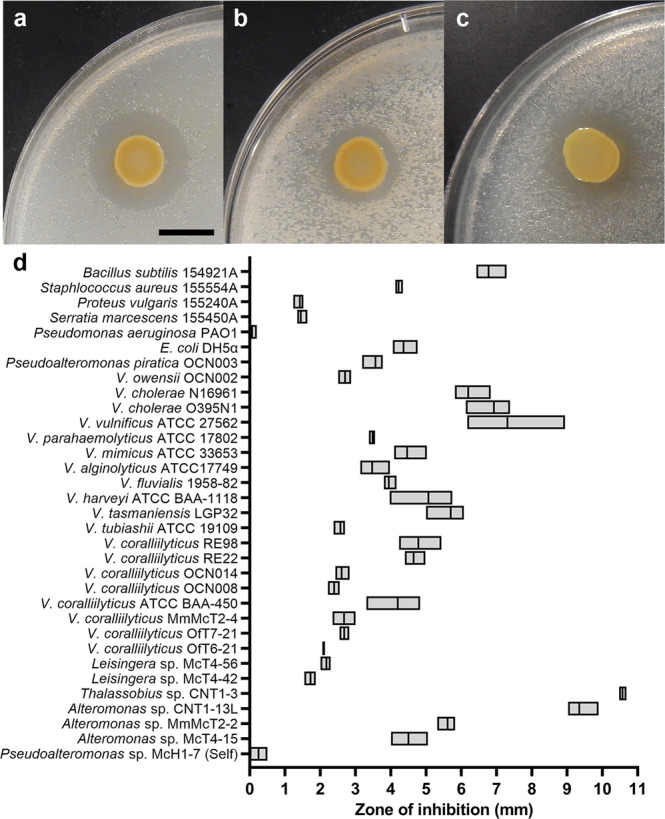
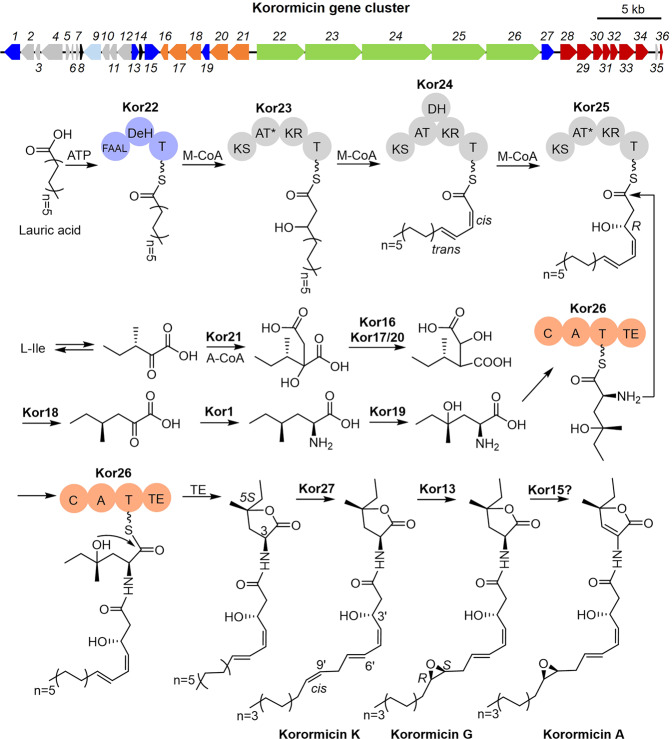
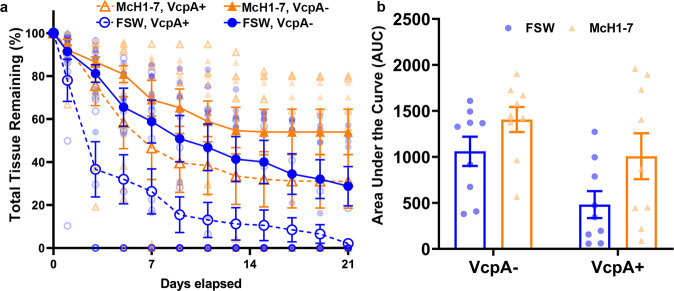
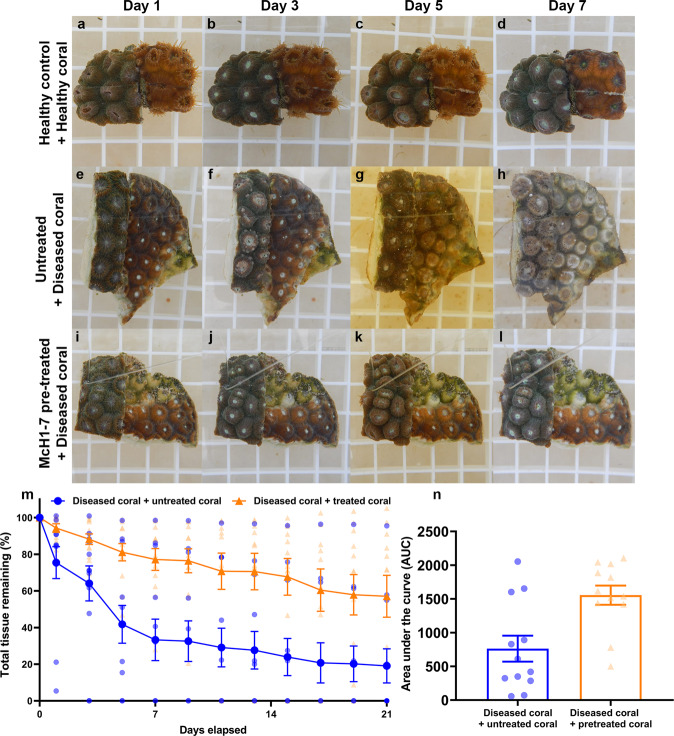
Considered one of the most devastating coral disease outbreaks in history, stony coral tissue loss disease (SCTLD) is currently spreading throughout Florida's coral reefs and the greater Caribbean. SCTLD affects at least two dozen different coral species and has been implicated in extensive losses of coral cover. Here we show Pseudoalteromonas sp. strain McH1-7 has broad-spectrum antibacterial activity against SCTLD-associated bacterial isolates. Chemical analyses indicated McH1-7 produces at least two potential antibacterials, korormicin and tetrabromopyrrole, while genomic analysis identified the genes potentially encoding an L-amino acid oxidase and multiple antibacterial metalloproteases (pseudoalterins). During laboratory trials, McH1-7 arrested or slowed disease progression on 68.2% of diseased Montastraea cavernosa fragments treated (n = 22), and it prevented disease transmission by 100% (n = 12). McH1-7 is the most chemically characterized coral probiotic that is an effective prophylactic and direct treatment for the destructive SCTLD as well as a potential alternative to antibiotic use.


Conflict of interest statement

The authors declare no competing interests.

Figures

Fig. 1
Fig. 1. Inhibitory activity of isolate McH1-7.
Zone of inhibition (ZOI) of McH1-7 spotted onto target strains a Alteromonas sp. McT4-15, b Leisingera sp. McT4-56, or c Vibrio coralliilyticus OfT6-21. The black scale bar represents 10 mm. d Boxplot of ZOI measurements of the radius in mm of McH1-7 on different target strains. The boxes represent the range for three replicates and the middle line indicates the median.
Fig. 2
Fig. 2. The putative biosynthetic pathway of korormicins.
The 52-kb kor gene cluster was identified from the genome of Pseudoalteromonas sp. McH1-7. The PKSs and NRPSs are shown in green, while the genes involved in the formation of the nonproteinogenic amino acid (2 S)-2-NH2-4-OH-4-methylhexanoate are in orange. Genes in the operon of NADH:ubiquinone reductase assembly (NQR) are presented in dark red, while those in dark blue may encode modification enzymes. Two transcriptional regulators are in black, and the rest are in gray. The proposed pathway is supported by the predicted functions of gene products in the identified kor gene cluster.
Fig. 3
Fig. 3. Direct treatment of SCTLD with McH1-7.
ah Representative photos of diseased M. cavernosa treated with filtered seawater (FSW) (ad) or McH1-7 (eh). Photos represent days 1, 5, 8, and 11 of the experiment. In this example, the FSW treatment represents 100% tissue loss after 11 days (d), while the McH1-7 treatment represents 5% tissue loss after 11 days (panel h). i Average percentage of total tissue remaining on M. cavernosa colonies treated with FSW (blue circles) or McH1-7 (orange triangles) over time (mixed-effects model ANOVA; treatment P = 0.020, time P < 0.0001, interaction P = 0.083; n = 22). The error bars represent the standard error of the mean. j Area under the curve (AUC) calculations for the diseased M. cavernosa treated with FSW or McH1-7 (paired t test, P = 0.002, n = 22 each treatment).
Fig. 4
Fig. 4. The relationship between VcpA assay result and McH1-7 efficacy.
a Average percent of total tissue remaining on diseased M. cavernosa that are VcpA and exposed to just FSW (blue solid line with closed blue circles) or McH1-7 (orange solid line with closed orange triangles) as well as was VcpA+ fragments exposed to FSW (blue dashed line with open blue circles) or McH1-7 (orange dashed line with open orange triangles). b Area under the curve (AUC) calculations for percent total tissue remaining on the diseased M. cavernosa that are VcpA and exposed to just FSW (blue bar) or McH1-7 (orange bar) as well as VcpA+ fragments exposed to FSW (blue bar) or McH1-7 (orange bar). Two-way ANOVA of the disease progression rates showed that VcpA status (P = 0.005, n = 9) and treatment (P = 0.029, n = 9) did have an effect, and there was no significant interaction (P = 0.523, n = 9). The error bars represent the standard error of the mean.
Fig. 5
Fig. 5. Protection from disease transmission with McH1-7.
ad Photos of control M. cavernosa consisting of a healthy fragment pre-treated with McH1-7 (left) in contact with an untreated healthy fragment (right), eh untreated healthy fragment (left) in contact with a diseased fragment (right), and il) a healthy fragment pre-treated with McH1-7 (left) in contact with a diseased fragment (right). Photos represent days 1, 3, 5, and 7 of the experiment. m Average percentage of total tissue remaining on diseased M. cavernosa colonies in contact with untreated healthy fragments (blue circles) or McH1-7 treated healthy fragments (orange triangles) over time (mixed-effects model ANOVA; treatment P = 0.004, time P < 0.001, interaction P < 0.0001; n = 12). n Area under the curve (AUC) calculations for the diseased M. cavernosa in contact with untreated fragments (blue bar) or fragments pre-treated with McH1-7 (orange bar) (paired t test, P = 0.0001, n = 12). The error bars represent the standard error of the mean.
Fig. 6
Fig. 6. Detection of korormicin gene copies over time after inoculation with Pseudoalteromonas McH1-7.
Points show the mean copy number per ng of DNA of the Kor23 gene from triplicate reactions of ddPCR and the standard error is shown by the error bars. “Pre” indicates samples taken before inoculation with the probiotic strain McH1-7. “Post” indicates samples taken one hour after inoculation in water samples only. Each M. cavernosa genotype was cut into six fragments prior to the experiment and one fragment was sacrificed at each time for genetic analysis. Note the difference in the y-axis scales, as higher copy numbers were detected in the water compared to tissue samples.

References

    1. Precht WF, Gintert BE, Robbart ML, Fura R, van Woesik R. Unprecedented disease-related coral mortality in Southeastern Florida. Sci. Rep. 2016;6:31374. doi: 10.1038/srep31374. - DOI - PMC - PubMed
    1. Knowlton, N. et al. Rebuilding coral reefs: a decadal grand challenge. 1–55 10.53642/NRKY9386 (2021).
    1. Walton, C. J., Hayes, N. K. & Gilliam, D. S. Impacts of a regional, multi-year, multi-species coral disease outbreak in Southeast Florida. Front. Mar. Sci.5, 323 (2018).
    1. Spadafore R, Fura R, Precht WF, Vollmer SV. Multi-variate analyses of coral mortality from the 2014–2015 stony coral tissue loss disease outbreak off Miami-Dade county, Florida. Front. Mar. Sci. 2021;8:723998. doi: 10.3389/fmars.2021.723998. - DOI
    1. Alvarez-Filip L, Estrada-Saldívar N, Pérez-Cervantes E, Molina-Hernández A, González-Barrios FJ. A rapid spread of the stony coral tissue loss disease outbreak in the Mexican Caribbean. PeerJ. 2019;7:e8069. doi: 10.7717/peerj.8069. - DOI - PMC - PubMed

Publication types