

Ketorolac modulates Rac-1/HIF-1α/DDX3/β-catenin signalling via a tumor suppressor prostate apoptosis response-4 (Par-4) in renal cell carcinoma
- PMID: 37024613
- PMCID: PMC10079967
- DOI: 10.1038/s41598-023-32627-z
Ketorolac modulates Rac-1/HIF-1α/DDX3/β-catenin signalling via a tumor suppressor prostate apoptosis response-4 (Par-4) in renal cell carcinoma
Abstract
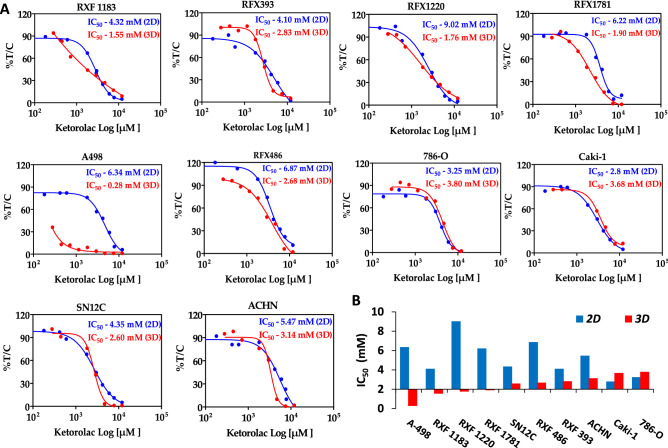
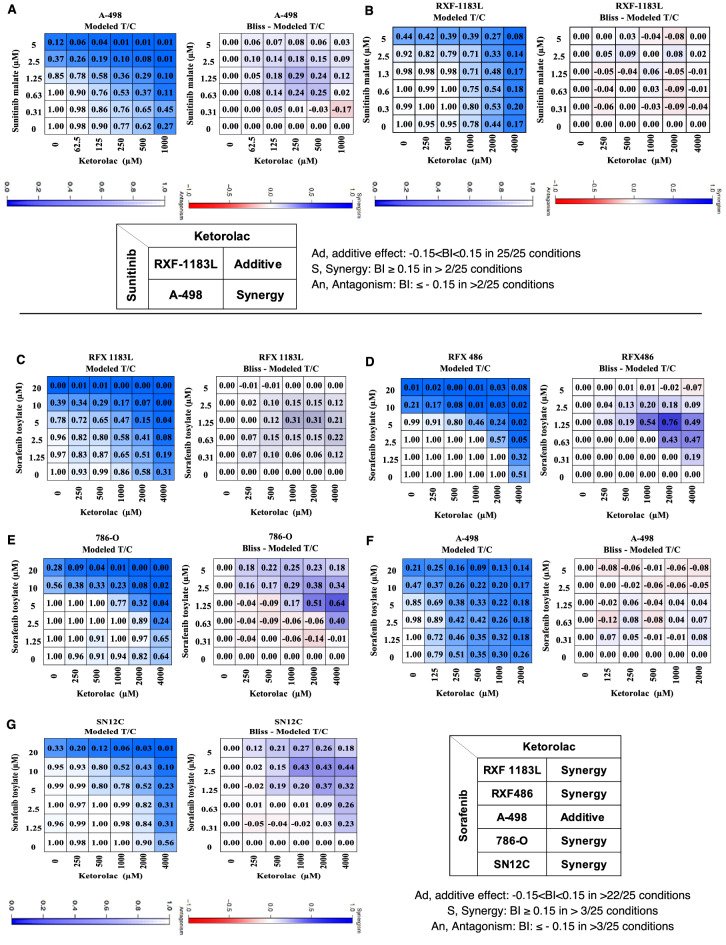
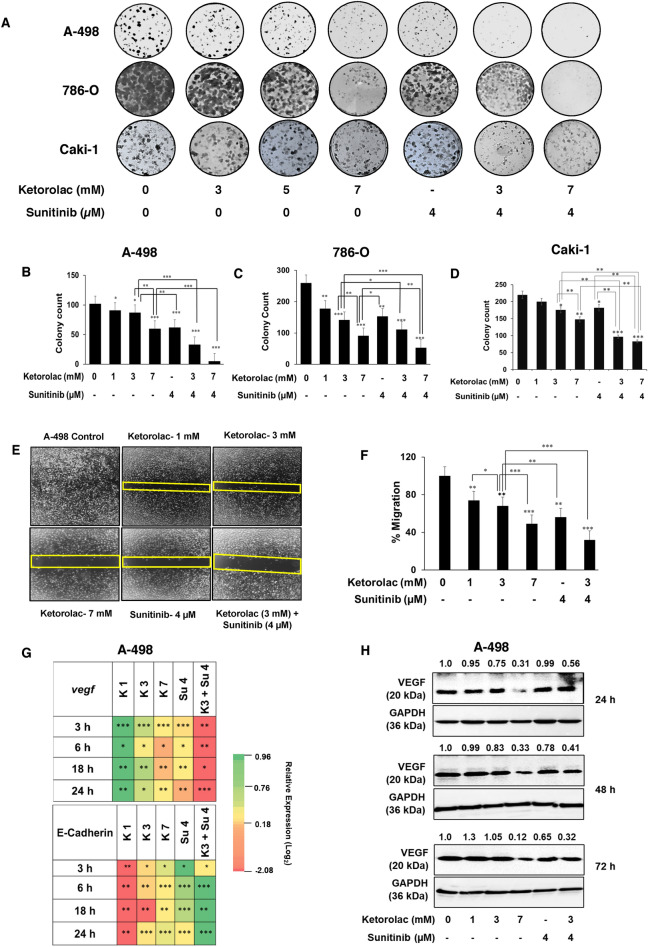
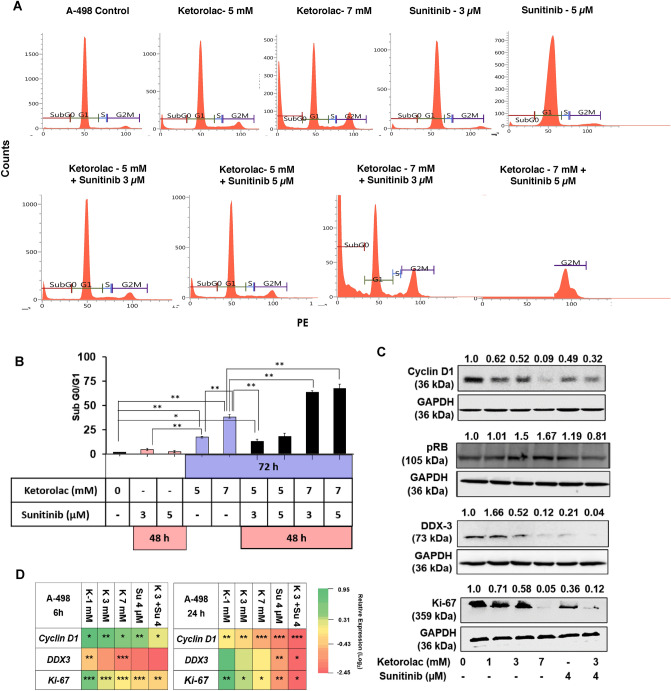
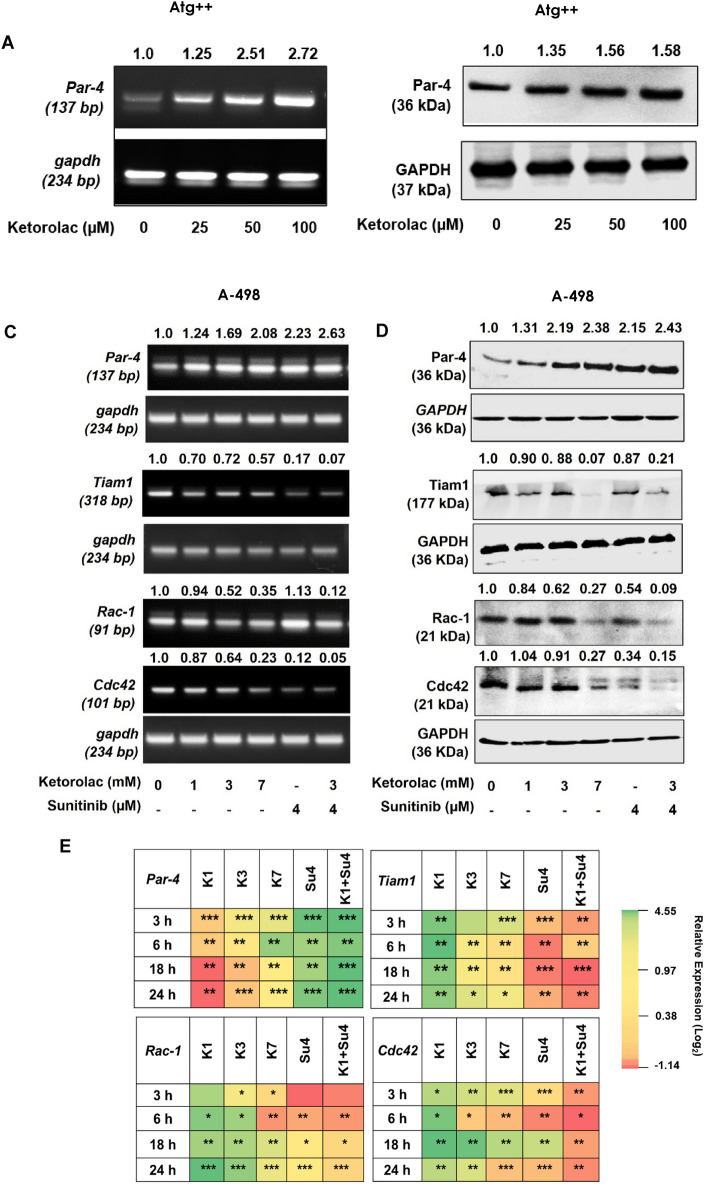
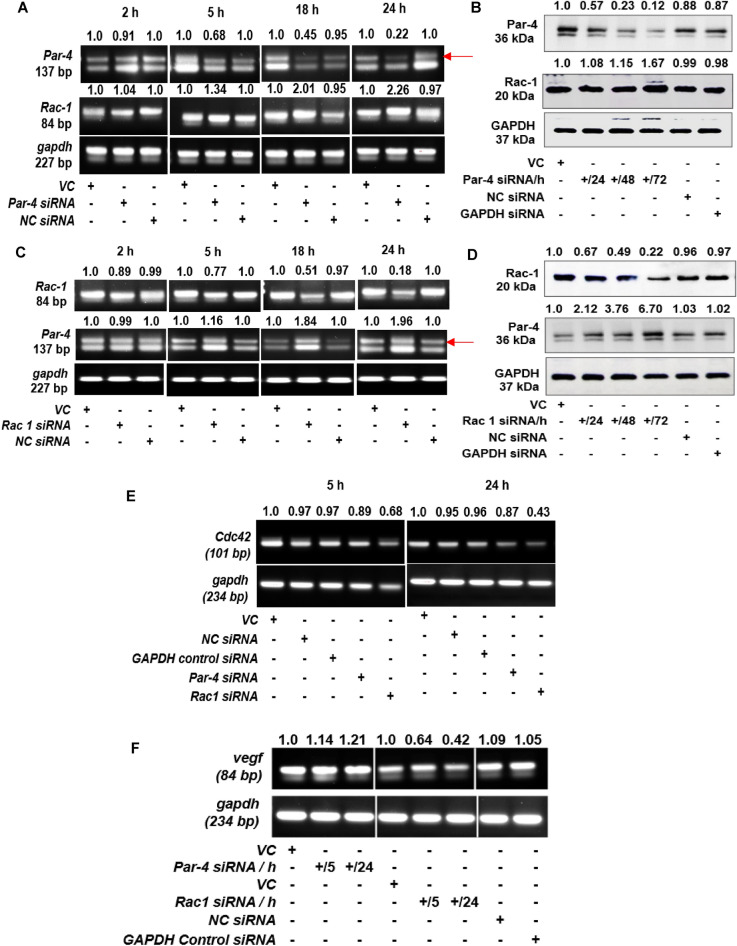
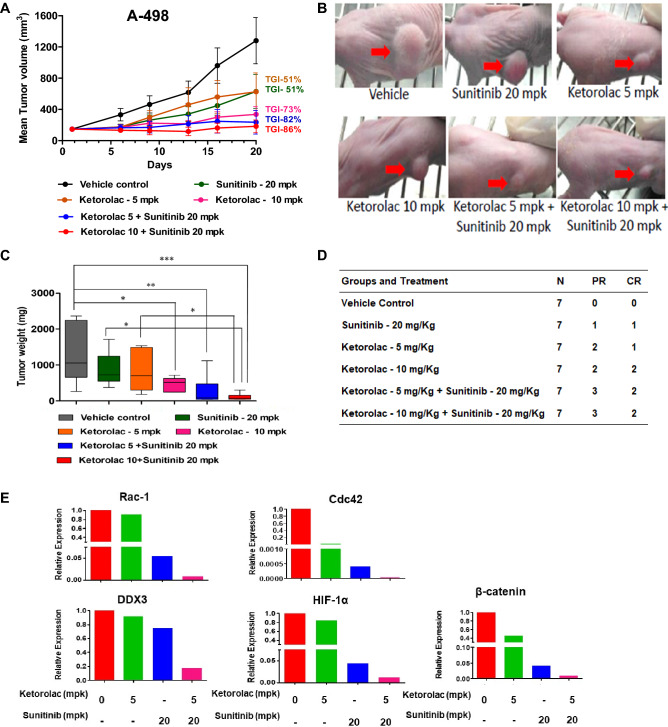
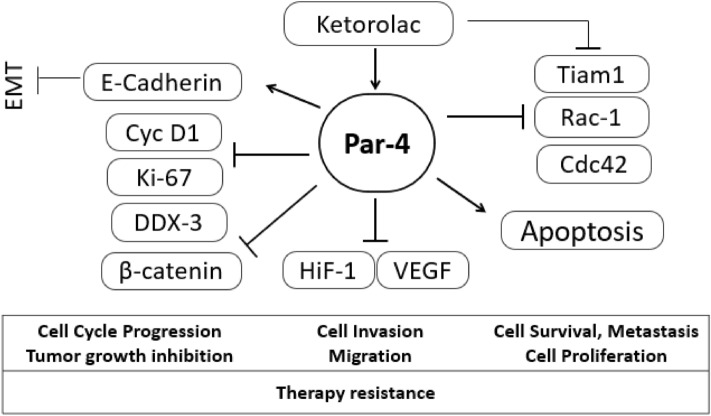
Renal cell carcinoma (RCC) is the most difficult-to-treat form of kidney cancer with a median 5-year survival of 10% under metastatic setting. In RCC, although cytoreductive nephrectomy is common, approximately 20-30% of patients will develop recurrent cancer after surgery, which highlights the need for an effective therapy. Rho-GTPases viz, Rac-1 and Cdc42 are the central regulators of cancer cell migration and invasion and thus metastasis in multiple cancer types. Hence, we elucidated the role of Ketorolac, a modulator Rho-GTPases against RCC through potentiation of tumor suppressor Par-4. The effect of Ketorolac alone and in combination on proliferation, apoptosis, cell-cycle progression, migration, tumor inhibition and their related markers were studied. Moreover, Ketorolac's impact on metastasis by influencing Rac-1/HIF-1α/DDX3/β-catenin signalling was studied with respect to its ability to modulate the expression of tumor suppressor Par-4, and this mechanism was confirmed by siRNA knockdown studies. Ketorolac induced cytotoxicity in a panel of renal cells including patient derived tumor cells with IC50 2.8 to 9.02 mM and 0.28 to 3.8 mM in monolayer and anchorage independent clonogenic assays respectively. Ketorolac caused significant down regulation of proliferation (Ki-67, Cyclin D1, pRB and DDX3), migration/invasion (Rac-1, Cdc42, and Tiam1), and angiogenesis (HIF-1α and VEGF) markers as studied by gene and protein expression. Moreover, it caused a significant upregulation of tumor suppressor Par-4 known to be downregulated in RCC. This mechanism was further confirmed by using siRNA knockdown studies where we could demonstrate a negative relation between the expression of Par-4 and Rac-1/Cdc42. Importantly, Ketorolac alone and in combination with Sunitinib showed tumor growth inhibition (TGI) of 73% and 86% respectively in xenograft model. This anti-tumor activity was further corroborated by down regulation of Rac-1/Cdc42/HIF-1α/DDX3/β-catenin signalling. This is the first report which implicates the role of Ketorolac against RCC by acting as a small molecule secretagogue causing upregulation of Par-4 in autocrine and paracrine manner. Consequently, these findings suggest that Par-4 can serve as a valuable therapeutic target and a prognostic marker for the treatment of RCC.
© 2023. The Author(s).
Conflict of interest statement
The authors declare no competing interests.
Figures
Similar articles
-
Renal cancer cells lacking hypoxia inducible factor (HIF)-1alpha expression maintain vascular endothelial growth factor expression through HIF-2alpha.Carcinogenesis. 2007 Mar;28(3):529-36. doi: 10.1093/carcin/bgl143. Epub 2006 Aug 18. Carcinogenesis. 2007. PMID: 16920734
-
Prolyl hydroxylase 2 dependent and Von-Hippel-Lindau independent degradation of Hypoxia-inducible factor 1 and 2 alpha by selenium in clear cell renal cell carcinoma leads to tumor growth inhibition.BMC Cancer. 2012 Jul 17;12:293. doi: 10.1186/1471-2407-12-293. BMC Cancer. 2012. PMID: 22804960 Free PMC article.
-
TGFBI-promoted adhesion, migration and invasion of human renal cell carcinoma depends on inactivation of von Hippel-Lindau tumor suppressor.Urology. 2012 Apr;79(4):966.e1-7. doi: 10.1016/j.urology.2011.12.011. Epub 2012 Feb 15. Urology. 2012. PMID: 22341602
-
Rho-associated kinase 1 inhibition is synthetically lethal with von Hippel-Lindau deficiency in clear cell renal cell carcinoma.Oncogene. 2017 Feb 23;36(8):1080-1089. doi: 10.1038/onc.2016.272. Epub 2016 Nov 14. Oncogene. 2017. PMID: 27841867 Free PMC article.
-
ELR510444 inhibits tumor growth and angiogenesis by abrogating HIF activity and disrupting microtubules in renal cell carcinoma.PLoS One. 2012;7(1):e31120. doi: 10.1371/journal.pone.0031120. Epub 2012 Jan 25. PLoS One. 2012. PMID: 22295124 Free PMC article.
Cited by
-
miR-590-5p/Tiam1-mediated glucose metabolism promotes malignant evolution of pancreatic cancer by regulating SLC2A3 stability.Cancer Cell Int. 2023 Nov 28;23(1):301. doi: 10.1186/s12935-023-03159-3. Cancer Cell Int. 2023. PMID: 38017477 Free PMC article.
-
Trial watch: beta-blockers in cancer therapy.Oncoimmunology. 2023 Nov 27;12(1):2284486. doi: 10.1080/2162402X.2023.2284486. eCollection 2023. Oncoimmunology. 2023. PMID: 38126031 Free PMC article.
-
The Tumor Suppressor Par-4 Regulates Adipogenesis by Transcriptional Repression of PPARγ.Cells. 2024 Sep 5;13(17):1495. doi: 10.3390/cells13171495. Cells. 2024. PMID: 39273065 Free PMC article.
-
Perioperative Immunosuppressive Factors during Cancer Surgery: An Updated Review.Cancers (Basel). 2024 Jun 22;16(13):2304. doi: 10.3390/cancers16132304. Cancers (Basel). 2024. PMID: 39001366 Free PMC article. Review.
-
Antitumor Efficacy of Arylquin 1 through Dose-Dependent Cytotoxicity, Apoptosis Induction, and Synergy with Radiotherapy in Glioblastoma Models.Biomedicines. 2024 Apr 19;12(4):907. doi: 10.3390/biomedicines12040907. Biomedicines. 2024. PMID: 38672261 Free PMC article.
References
-
- Ofori EO, Bin Alhassan BA, Ayabilah EA, Maison POM, Asante-Asamani A, Atawura H, Akakpo PK, Imbeah EG, Ofori PW. An unusual outcome of papillary renal cell carcinoma with lung metastases: A case report and review of literature. Afr. J. Urol. 2021;27:5. doi: 10.1186/s12301-020-00103-z. - DOI
Publication types
MeSH terms
Substances
LinkOut - more resources
Full Text Sources
Medical
Research Materials
Miscellaneous
