. 2023 May;8(5):946-957.
doi: 10.1038/s41564-023-01347-5. Epub 2023 Apr 6.

Viruses interact with hosts that span distantly related microbial domains in dense hydrothermal mats

Affiliations

Viruses interact with hosts that span distantly related microbial domains in dense hydrothermal mats

Yunha Hwang et al. Nat Microbiol. 2023 May.

Abstract

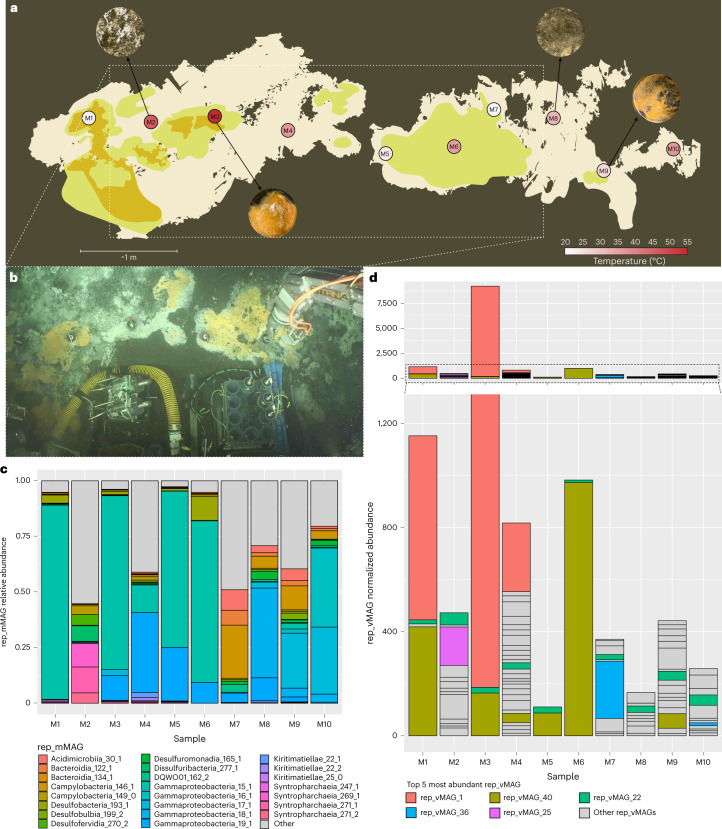
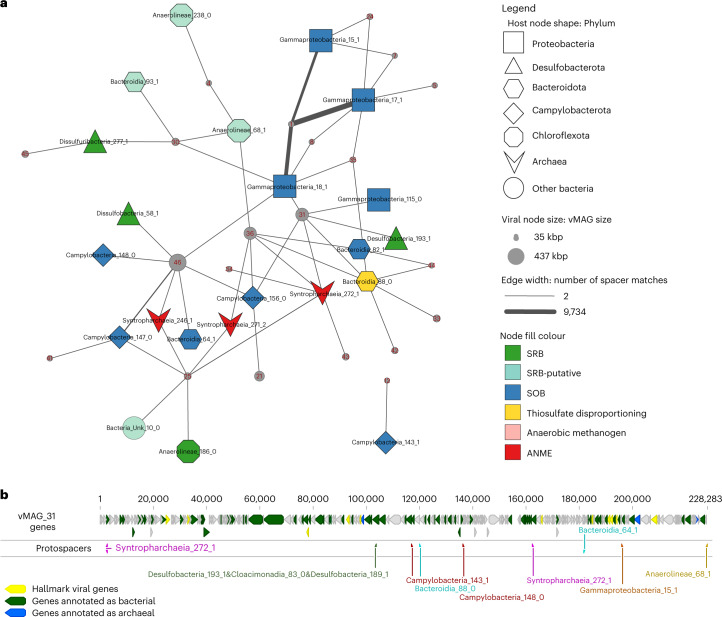
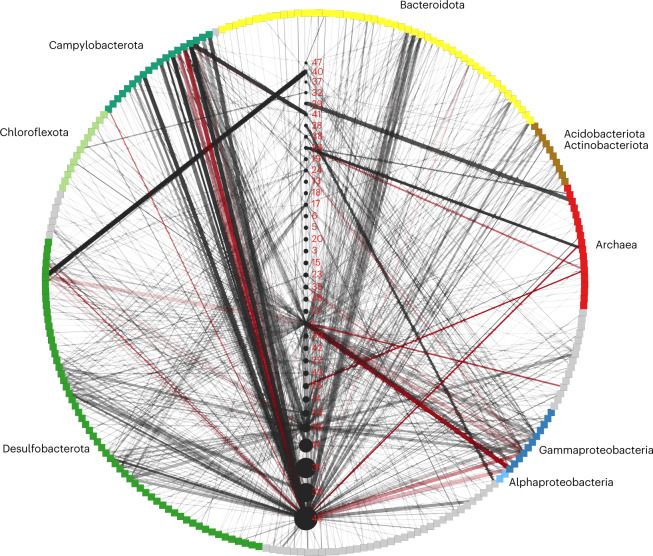
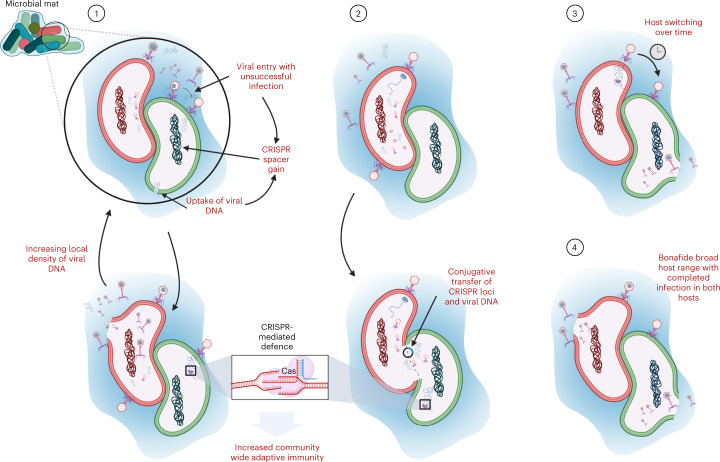
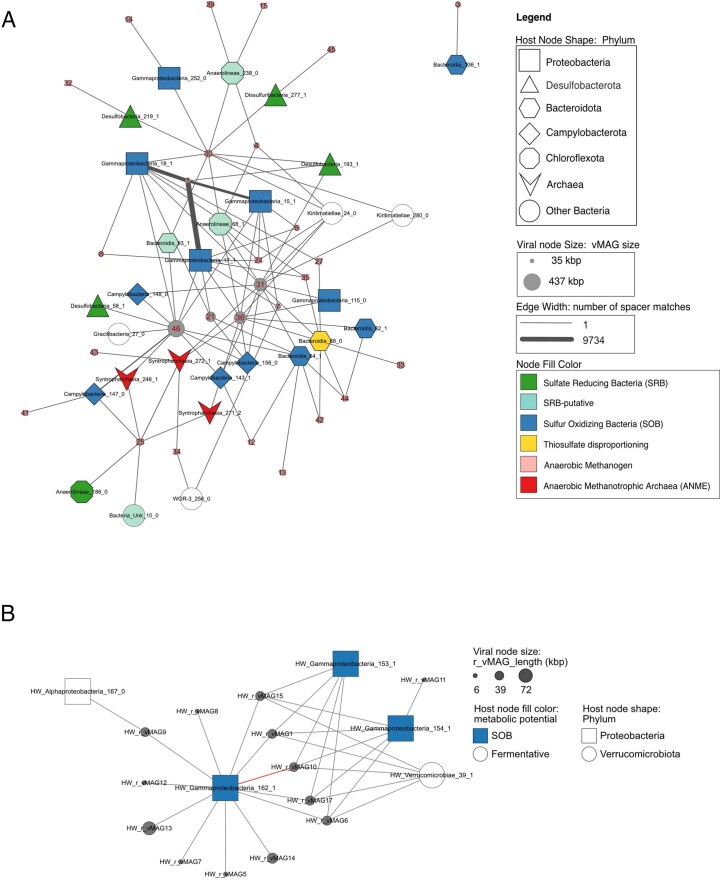
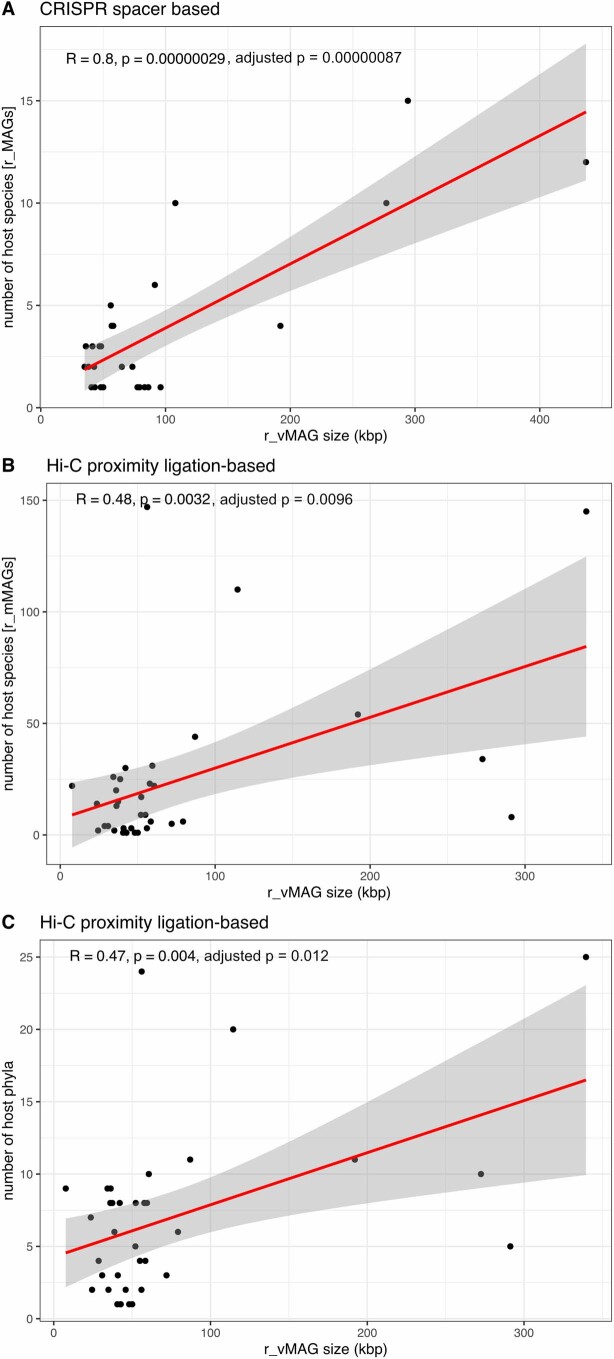
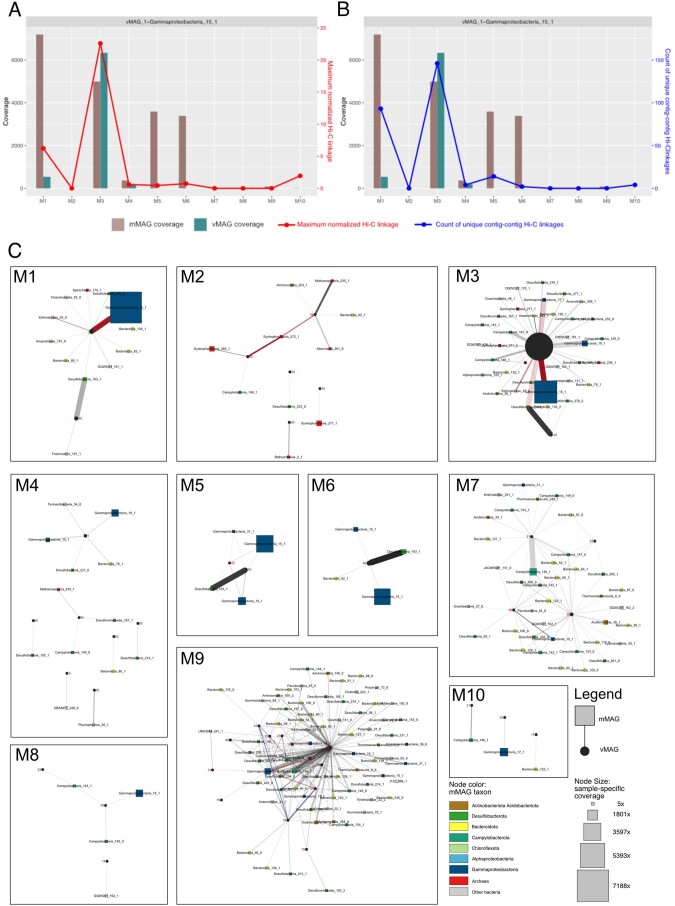
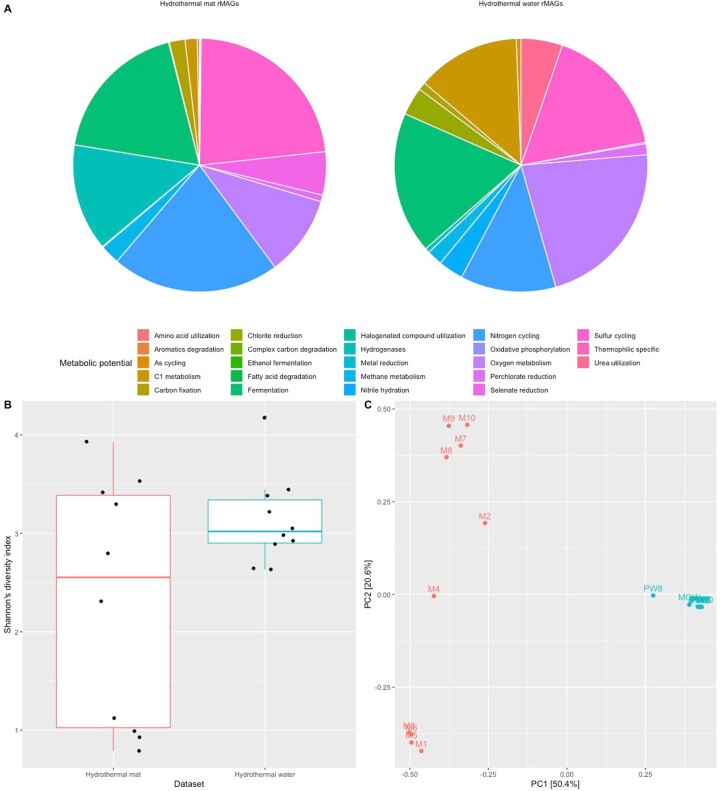
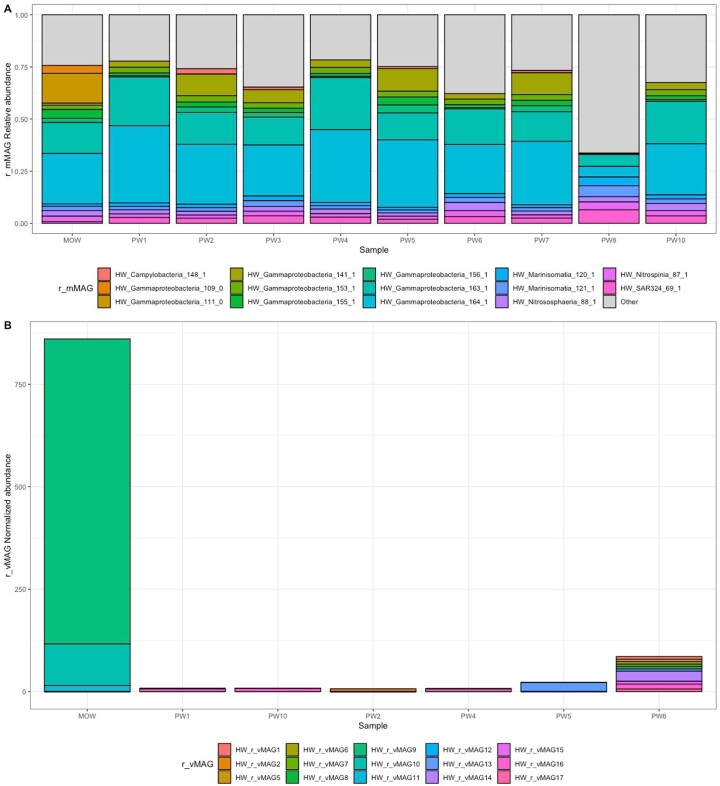
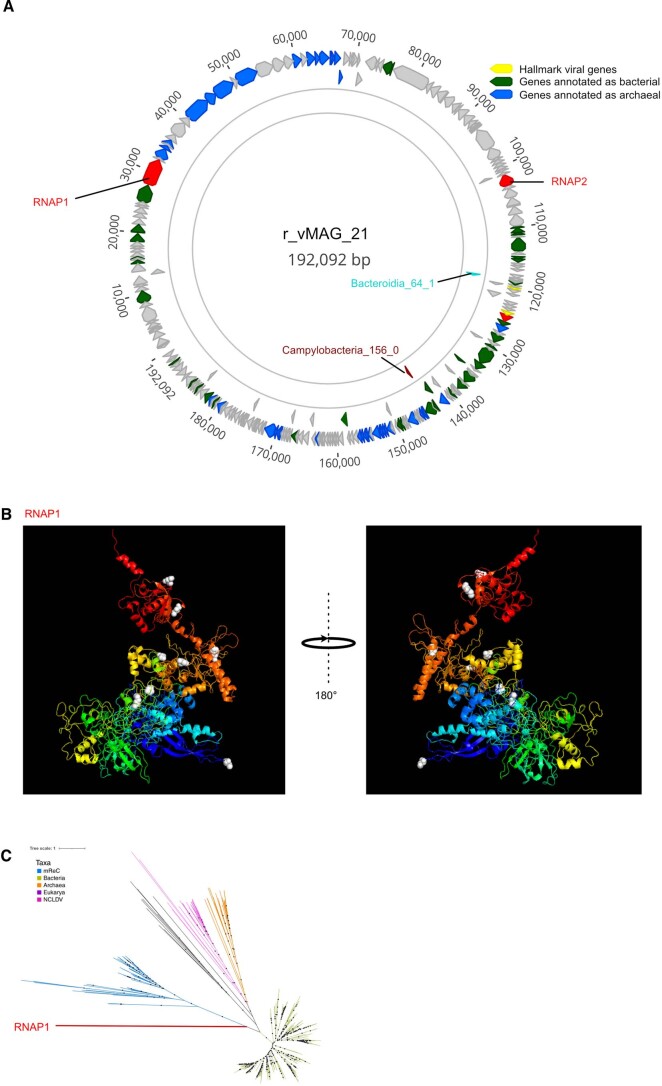
Many microbes in nature reside in dense, metabolically interdependent communities. We investigated the nature and extent of microbe-virus interactions in relation to microbial density and syntrophy by examining microbe-virus interactions in a biomass dense, deep-sea hydrothermal mat. Using metagenomic sequencing, we find numerous instances where phylogenetically distant (up to domain level) microbes encode CRISPR-based immunity against the same viruses in the mat. Evidence of viral interactions with hosts cross-cutting microbial domains is particularly striking between known syntrophic partners, for example those engaged in anaerobic methanotrophy. These patterns are corroborated by proximity-ligation-based (Hi-C) inference. Surveys of public datasets reveal additional viruses interacting with hosts across domains in diverse ecosystems known to harbour syntrophic biofilms. We propose that the entry of viral particles and/or DNA to non-primary host cells may be a common phenomenon in densely populated ecosystems, with eco-evolutionary implications for syntrophic microbes and CRISPR-mediated inter-population augmentation of resilience against viruses.


Conflict of interest statement

The authors declare no competing interests.

Figures

Fig. 1
Fig. 1. Highly heterogeneous yet contiguous deep-sea hydrothermal mat.
a, Visual schematic of the sampled microbial mat. Sampling locations are illustrated on the basis of the three main colours (orange, yellow and white) observed during sampling. Distances and shapes are approximate and were reconstructed using the high-resolution videos and photos taken during the ROV Jason dive. Pushcore locations are coloured on the basis of in situ temperature. Different morphologies of some of the sampled mat materials are shown with photos taken shipboard during sampling of the pushcores. b, Top view of the middle section (approximately outlined as a dashed box in a) of the sampled mat. c, Relative abundances of the top 10 most abundant rep_mMAG (species-level, 97% ANI cut-off) in each sample. d, Normalized abundances of 47 high-quality or complete rep_vMAGs (95% ANI cut-off) in each sample. The top 5 most abundant rep_vMAGs are coloured.
Fig. 2
Fig. 2. Pruned historical host-virus interactions based on CRISPR spacer-to-protospacer matches.
a, Spacer-to-protospacer matches between rep_mMAGs and rep_vMAGs, where at least two distinct matches were found are represented with an edge. CRISPR repeats that were found in multiple rep_mMAG were excluded in this network. The edge width corresponds to the number of distinct matches. Shape and colour of host nodes denote host phylum and putative metabolisms, respectively. Size of viral nodes are scaled to the corresponding rep_vMAG length. b, Visualization of protospacer matches along a viral contig with spacers that are associated with CRISPRs specific to at least eight hosts belonging to different phyla and domains.
Fig. 3
Fig. 3. Hi-C proximity ligation informed in situ host-virus interactions network.
Network visualization of rep_mMAGs and rep_vMAGs based on normalized Hi-C contacts. rep_mMAGs are positioned in a circle, in square nodes, with the colours representing taxonomic classification (grey: other). rep_vMAGs are positioned vertically in increasing rep_vMAG size in black circular nodes along the centre. rep_vMAG IDs are denoted with red labels (for example, 1 refers to rep_vMAG_1). Thickness of the edges represents the number of contig-to-contig linkages, while the darkness of the edges correlates with the maximal normalized strength of the Hi-C contacts between any two contigs in a host-virus pair. Host-virus pairs that were previously detected using CRISPR-spacer matches are coloured in red.
Fig. 4
Fig. 4. Four proposed models for host-virus interactions in ecosystems with high microbial density and metabolic interdependence.
Red and green cells represent phylogenetically distant and metabolically independent hosts (for example, ANME-SRB). Blue shading represents an EPS matrix that limits diffusion of viral and extracellular DNA. In the first model, we illustrate the possibility of ‘promiscuous’ viral adsorption and entry into a non-primary host cell (green), which results in a CRISPR-spacer gain event. Alternatively, the limited dispersal potential due to the EPS may result in an increased local density of viral particles and viral DNA following a lysis event of the primary host (red). Consequently, this can lead to a higher likelihood of a non-primary host cell’s natural uptake of viral DNA, also resulting in a spacer gain event. In the second model, we present the possibility of contact-based transfer of CRISPR arrays and viral DNA. This would also result in a gain of a CRISPR-spacer event by a non-primary host cell (green). In both models, this results in CRISPR-mediated augmented community-wide immunological memory and resilience. In the third model, we present the possibility of viral host switching over time, from primary host (red) at T = 0 to its nearest syntrophic partner (green) as the initial host evolves against the virus. Finally, in the last model, we consider the possibility of a bonafide broad host range with successful viral infection in both hosts.
Extended Data Fig. 1
Extended Data Fig. 1. Hydrothermal mat microbial and viral taxonomic diversity and principal coordinate analysis (PCoA).
Shannon’s diversity index (A) and PCoA (B) rep_mMAGs and Shannon’s diversity index (C) and PcoA (D) for rep_vMAGs in samples M1-10. PCoA plots show samples colored according to the position across the transect (leftmost: red, rightmost: blue) and the percentage of variance explained by each axis is shown in the corresponding axis labels.
Extended Data Fig. 2
Extended Data Fig. 2. rep_vMAG taxonomic diversity relative to the reference viral genomes.
Larger red nodes are viruses assembled in this study. Colors of reference viral genome nodes are according to family level classifications used in the vCONTACT2 database.
Extended Data Fig. 3
Extended Data Fig. 3. Mat viral genome annotations.
Auxiliary metabolic genes and host-virus arms race in viral gene content. Putative auxiliary metabolic genes (AMGs; red) in rep_vMAG_36 (A) and rep_vMAG_12 (B), and defense system genes (green) in rep_vMAG_13 (C). These genes are flanked by hallmark phage genes (yellow) and other notable genes found in phages (orange). Locations of protospacers are shown in the bottom track and labeled according to the rep_mMAG the CRISPR is binned in.
Extended Data Fig. 4
Extended Data Fig. 4. Network visualization of rep_mMAGs and their CRISPRs (repeats).
Larger nodes represent rep_mMAG, where the node shape denotes the phylum the rep_mMAG belongs to, the node size is correlated to the rep_mMAG size and the node color corresponds to the genome-informed metabolic capabilities. SRB: Sulfur reducing bacteria, SOB: Sulfur oxidizing bacteria, SRB-putative: Putative sulfate reducing bacteria encoding aprAB and/or dsrD. ANME: Anaerobic methanotrophic archaea.
Extended Data Fig. 5
Extended Data Fig. 5. CRISPR-based immunity networks (extended).
(A) Unpruned historical host-virus interactions based on CRISPR-spacer to protospacer matches, including host virus interactions for which only one distinct spacer-to-protospacer match was found. CRISPR repeats that were found in multiple rep_mMAG were excluded in this network. The edge width corresponds to the number of distinct matches. Color and shape of host nodes denote host phylum and putative metabolisms respectively. Size of viral nodes are scaled to the corresponding rep_vMAG length. (B) CRISPR-spacer to protospacer matches in hydrothermal water samples. Network was visualized using a less stringent threshold (spacer length >20 bp) than in Fig. 3 (spacer length >25 bp and each edge representing two distinct matches). Only interaction with spacer length >25 bp is highlighted with the red edge. Viral nodes are scaled to the rep_vMAG length, and rep_mMAGs with genomic capacity to carry out sulfur oxidation are colored in blue.
Extended Data Fig. 6
Extended Data Fig. 6. Correlations between vMAG size and ‘host range’.
(A) Correlation between the number of hosts a rep_vMAG can be linked with using CRISPR spacer based matches and the corresponding rep_vMAG size. (B, C) Correlation between the number of hosts (B) and host phyla (C) a rep_vMAG can be linked to using Hi-C proximity ligation-based matches and the corresponding rep_vMAG size. Shaded region of error denotes 95% confidence level interval for predictions from a linear model ("lm"). Correlations were calculated using two-sided Pearson correlation test (n = 36). The p-values are multiple hypothesis corrected using bonferroni correction (k = 3).
Extended Data Fig. 7
Extended Data Fig. 7. Extended Hi-C analysis.
(A, B) Change in the read-mapping coverages of rep_vMAG_1 and Gammaproteobacteria_15_1 across samples. Overlaid is the intensity (A: maximum normalized Hi-C linkages between the viral and host contigs, B: count of unique Hi-C linked pairs of viral and host contigs) of Hi-C linkages between the host-virus pair across samples. (C) Sample-specific Hi-C proximity ligation, for host and viral MAGs for which sample-specific abundances could be reliably calculated using read mapping (coverage >5, breadth >0.7). Viral nodes (circular) are labeled according to the corresponding rep_vMAG ID. microbial nodes are colored according to the taxon, using the same color scheme as the main Fig. 3. Node sizes correspond to the sample-specific read-mapping coverages. Thickness of the edges represent the number of contig-to-contig linkages, while the darkness of the edges correlates to the maximal normalized strength of the Hi-C contacts between any two contigs in a host-virus pair. Host-virus pairs that were previously detected using CRISPR-spacer matches are colored in red. Identified Hi-C linkages between viruses are noted with blue edges.
Extended Data Fig. 8
Extended Data Fig. 8. Comparison between ten hydrothermal mat metagenomes and ten hydrothermal water metagenomes.
(A) Metabolic gene content annotated and categorized using METABOLIC in binned rep_mMAGs from the two metagenomes. (B) Shannon diversity indices between the two sample sets. No statistically significant differences were detected (Welch’s t-test, n = 20 biologically independent samples, two-sided, p > 0.05). Box plot shows the quartiles (25, 50, 75 percentiles) with the upper and lower whiskers showing the max and min value within 1.5 times the interquartile respectively. (C) Principal coordinate analyses of the rep_mMAGs in the two datasets; hydrothermal mat samples are colored in red and hydrothermal water samples are colored in blue. The percentage of variance explained by each axis is shown in the axis label.
Extended Data Fig. 9
Extended Data Fig. 9. Microbial and viral composition of the hydrothermal water samples.
(A) Relative abundances of top ten more abundant rep_mMAGs from hydrothermal waters samples. (B) Normalized abundances of high quality and complete rep_vMAGs in hydrothermal water samples. Only rep_vMAGs detected at >5 coverage and >0.7 breadth using read mapping are shown and proviruses are excluded.
Extended Data Fig. 10
Extended Data Fig. 10. Viral DNA-directed RNA-polymerase subunit (RNAP) undergoing diversifying selection.
(A) Genomic context of RNAP1 undergoing selection. Note the presence of a non-homologous RNAP gene encoding beta subunit found in the same viral genome. (B) Predicted structure and locations of non-synonymous polymorphisms (visualized with white sphere). (C) Placement of the RNAP1 sequence in the tree previously published by Weinheimer and Aylward (2020), where it distantly clusters with sequences from mReC (multimeric RNAP-encoding Caudovirales). Branches strongly supported with at least 95 for ultrafast bootstrap are marked with black circles.

Similar articles

Cited by

References

    1. Flemming H-C, Wuertz S. Bacteria and archaea on Earth and their abundance in biofilms. Nat. Rev. Microbiol. 2019;17:247–260. doi: 10.1038/s41579-019-0158-9. - DOI - PubMed
    1. Hug LA, Co R. It takes a village: microbial communities thrive through interactions and metabolic handoffs. mSystems. 2018;3:e00152-–17. doi: 10.1128/mSystems.00152-17. - DOI - PMC - PubMed
    1. Pires DP, Melo LDR, Azeredo J. Understanding the complex phage-host interactions in biofilm communities. Annu. Rev. Virol. 2021;8:73–94. doi: 10.1146/annurev-virology-091919-074222. - DOI - PubMed
    1. Koskella B, Meaden S. Understanding bacteriophage specificity in natural microbial communities. Viruses. 2013;5:806–823. doi: 10.3390/v5030806. - DOI - PMC - PubMed
    1. Göller PC, et al. Multi-species host range of staphylococcal phages isolated from wastewater. Nat. Commun. 2021;12:6965. doi: 10.1038/s41467-021-27037-6. - DOI - PMC - PubMed

Publication types