. 2023 Apr 6;3(1):49.
doi: 10.1038/s43856-023-00269-x.

Deep learning-based polygenic risk analysis for Alzheimer's disease prediction

Collaborators, Affiliations

Deep learning-based polygenic risk analysis for Alzheimer's disease prediction

Xiaopu Zhou et al. Commun Med (Lond). .

Abstract

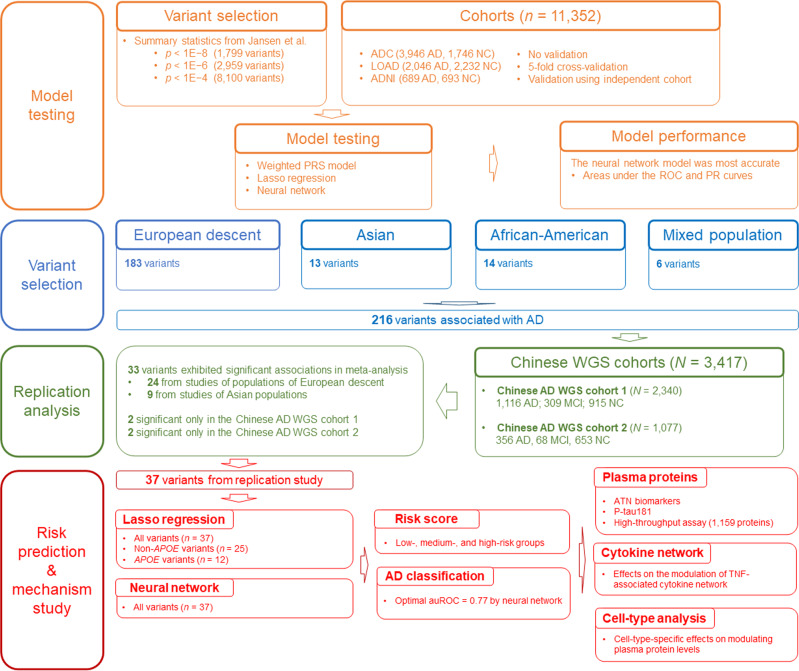
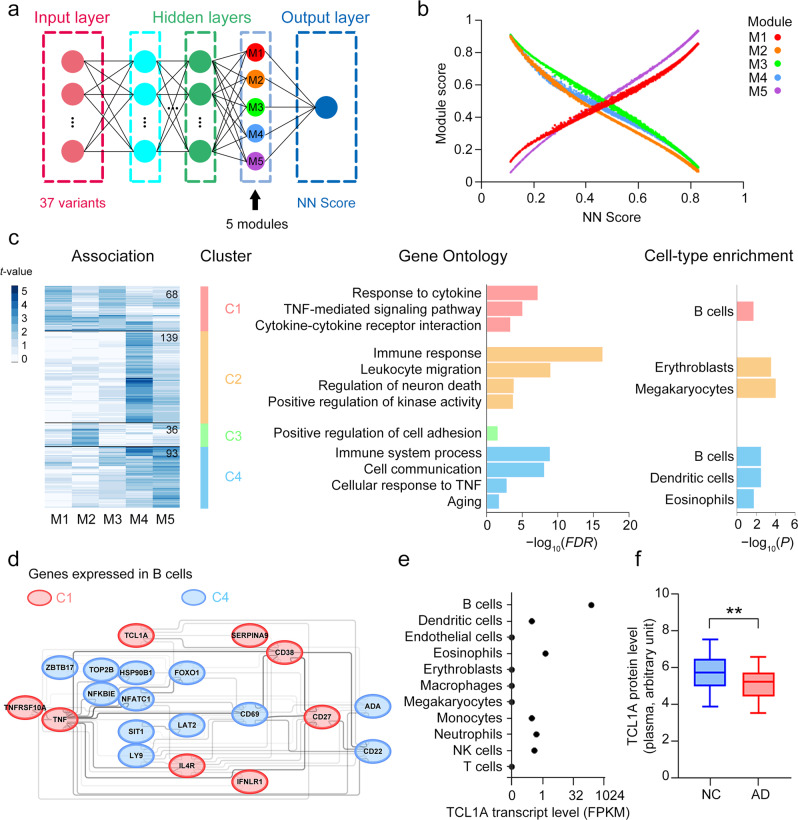
Background: The polygenic nature of Alzheimer's disease (AD) suggests that multiple variants jointly contribute to disease susceptibility. As an individual's genetic variants are constant throughout life, evaluating the combined effects of multiple disease-associated genetic risks enables reliable AD risk prediction. Because of the complexity of genomic data, current statistical analyses cannot comprehensively capture the polygenic risk of AD, resulting in unsatisfactory disease risk prediction. However, deep learning methods, which capture nonlinearity within high-dimensional genomic data, may enable more accurate disease risk prediction and improve our understanding of AD etiology. Accordingly, we developed deep learning neural network models for modeling AD polygenic risk.

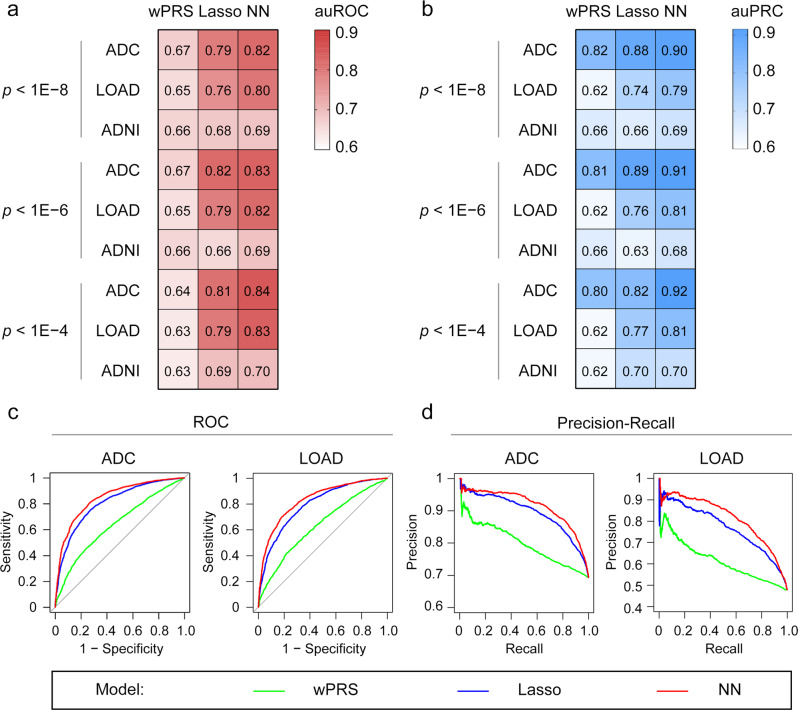
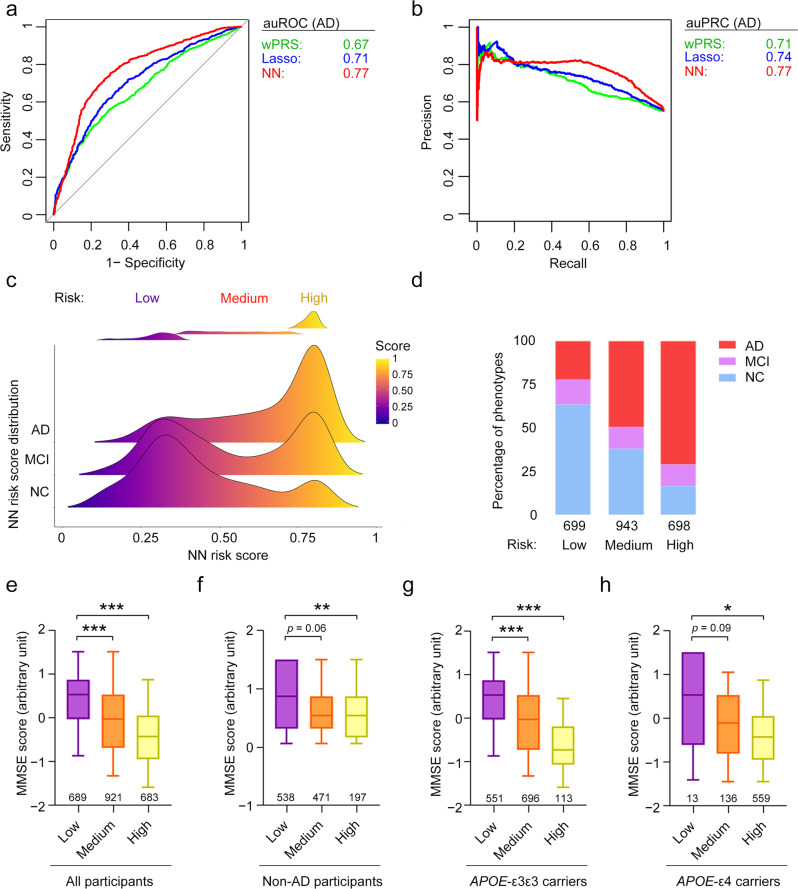
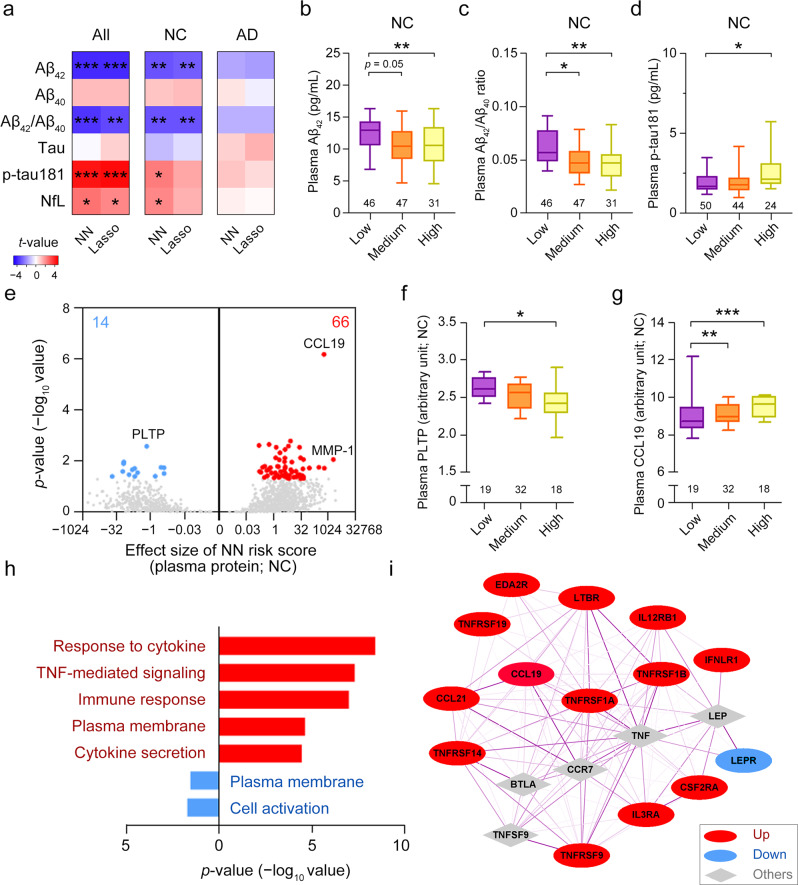
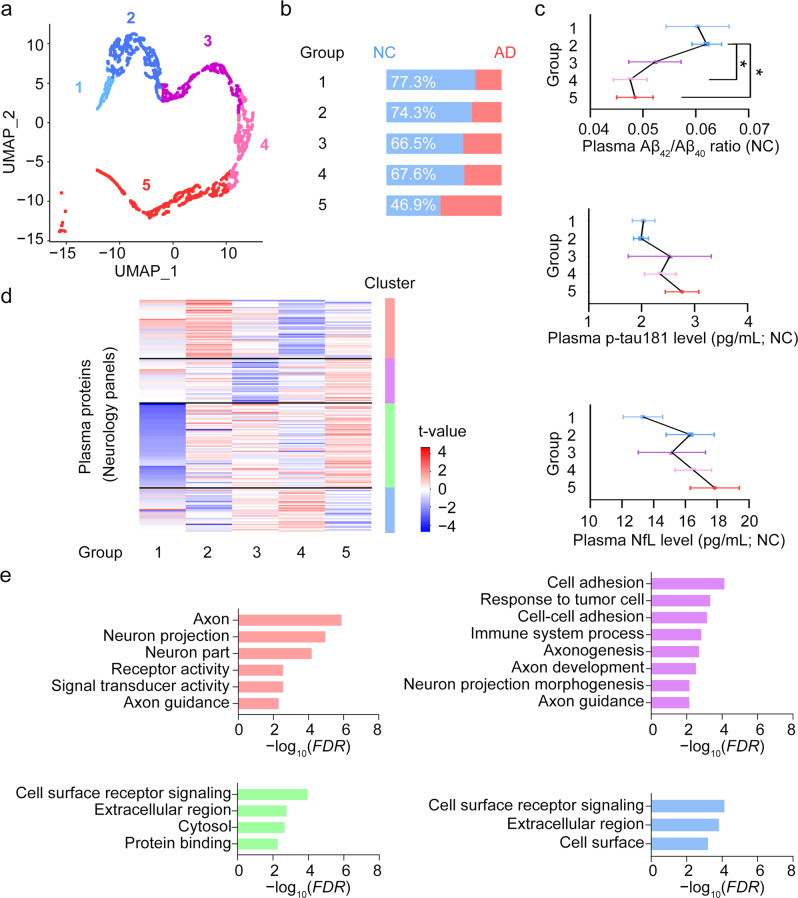
Methods: We constructed neural network models to model AD polygenic risk and compared them with the widely used weighted polygenic risk score and lasso models. We conducted robust linear regression analysis to investigate the relationship between the AD polygenic risk derived from deep learning methods and AD endophenotypes (i.e., plasma biomarkers and individual cognitive performance). We stratified individuals by applying unsupervised clustering to the outputs from the hidden layers of the neural network model.

Results: The deep learning models outperform other statistical models for modeling AD risk. Moreover, the polygenic risk derived from the deep learning models enables the identification of disease-associated biological pathways and the stratification of individuals according to distinct pathological mechanisms.

Conclusion: Our results suggest that deep learning methods are effective for modeling the genetic risks of AD and other diseases, classifying disease risks, and uncovering disease mechanisms.

Plain language summary

Polygenic diseases, such as Alzheimer’s disease (AD), are those caused by the interplay between multiple genetic risk factors. Statistical models can be used to predict disease risk based on a person’s genetic profile. However, there are limitations to existing methods, while emerging methods such as deep learning may improve risk prediction. Deep learning involves computer-based software learning from patterns in data to perform a certain task, e.g. predict disease risk. Here, we test whether deep learning models can help to predict AD risk. Our models not only outperformed existing methods in modeling AD risk, they also allow us to estimate an individual’s risk of AD and determine the biological processes that may be involved in AD. With further testing and optimization, deep learning may be a useful tool to help accurately predict risk of AD and other diseases.


Conflict of interest statement

The authors declare no competing interests.

Figures

Fig. 1
Fig. 1. Study schematic.
Schematic diagram showing the study design. AD, Alzheimer’s disease; ADC, National Institute on Aging Alzheimer’s Disease Center cohort; ADNI, Alzheimer’s Disease Neuroimaging Initiative cohort; ATN, amyloid-beta, tau, and neurofilament light polypeptide; auROC, area under the receiver operating characteristic curve; lasso, least absolute shrinkage and selection operator; LOAD, Late Onset Alzheimer’s Disease Family Study cohort; MCI, mild cognitive impairment; n, number of samples or variants; NC, normal control; NN, neural network; PR, precision–recall; PRS, polygenic risk score; p, p-values; p-tau181, tau phosphorylated at threonine-181; ROC, receiver operating characteristic; TNF, tumor necrosis factor; WGS, whole-genome sequencing.
Fig. 2
Fig. 2. Application of the weighted polygenic risk score, lasso, and neural network models for Alzheimer’s disease risk classification.
a, b Performance of the wPRS, lasso, and NN models for classifying patients with AD as indicated by (a) auROCs and (b) auPRCs. The variant pools used for model construction were selected according to the p-value cutoffs shown on the left side of each panel. c, d Representative plots showing the AD risk classification accuracy of different models constructed using variants with p < 1E−4 in individual cohorts. c ROC curves and d PR curves showing AD risk classification accuracy in different cohorts. AD, Alzheimer’s disease; ADC, National Institute on Aging Alzheimer’s Disease Center cohort; ADNI, Alzheimer’s Disease Neuroimaging Initiative cohort; auPRC, area under the precision–recall curve; auROC, area under the receiver operating characteristic curve; lasso, least absolute shrinkage and selection operator; LOAD, Late Onset Alzheimer’s Disease Family Study cohort; NN, neural network; p, p-value; PR, precision–recall; ROC, receiver operating characteristic; wPRS, weighted polygenic risk score.
Fig. 3
Fig. 3. Polygenic risk analysis for Alzheimer’s disease in the Chinese population.
a ROC and b PR curves of the polygenic score classification of patients with AD in Chinese WGS cohort 1. c Distribution of polygenic risk scores derived from the NN model for each phenotype group. The definitions of the low-, medium-, and high-risk groups are shown in the upper panel. d Percentages of each phenotype group in the low-, medium-, and high-risk groups. eh Associations between polygenic risk score and MMSE score in e all participants, f non-AD participants (i.e., NCs plus patients with MCI), g APOE-ε3 homozygous carriers, and h APOE-ε4 carriers. Data are presented as box-and-whisker plots. Boxes indicate the 25th to 75th percentiles, and whiskers indicate the 10th and 90th percentiles. The numbers of individuals in the corresponding group are shown at the bottom of each plot. Robust linear regression model: ***p < 0.001, **p < 0.01, *p < 0.05. AD, Alzheimer’s disease; auPRC, area under the precision–recall curve; auROC, area under the receiver operating characteristic curve; lasso, least absolute shrinkage and selection operator; MCI, mild cognitive impairment; MMSE, Mini–Mental State Examination; NC, normal control; NN, neural network; p, p-values; PR, precision–recall; ROC, receiver operating characteristic; wPRS, weighted polygenic risk score.
Fig. 4
Fig. 4. Modulatory effects of polygenic risk for Alzheimer’s disease on plasma protein biomarkers in normal controls.
a Associations between the polygenic risk scores derived from the corresponding models and the levels of plasma ATN biomarkers (i.e., Aβ42, Aβ40, Aβ42/Aβ40 ratio, tau, p-tau181, and NfL) in all participants, NCs, and patients with AD. bd Plasma Aβ42 level (b), Aβ42/Aβ40 ratio (c), and p-tau181 level (d) in NCs stratified according to polygenic risk score group. e Volcano plots showing the associations between polygenic risk scores and plasma protein levels obtained from the high-throughput assay. f, g Levels of the candidate plasma proteins f PLTP and g CCL19 in NCs stratified according to polygenic risk score group. h Overrepresented Gene Ontology terms for plasma proteins associated with polygenic risk scores (p < 0.05). i Protein–protein interaction network of cytokines associated with polygenic risk scores. The gray nodes are the five proteins most strongly associated with the other nodes. Line color and thickness indicate the interaction strength of the connected nodes (darker and thicker lines denote stronger interactions). bd, f, g Data are presented as box-and-whisker plots. Boxes indicate the 25th to 75th percentiles, and whiskers indicate the 10th and 90th percentiles; numbers of individuals in the corresponding group are shown at the bottom of each plot. Robust linear regression: ***p < 0.001, **p < 0.01, *p < 0.05; robust linear regression model. e, h, i Colors denote plasma proteins or results derived from proteins that were positively (red) or negatively (blue) correlated with polygenic risk scores. Aβ, amyloid-beta; AD, Alzheimer’s disease; CCL19, chemokine ligand 19; MCI, mild cognitive impairment; NC, normal control; NfL, neurofilament light polypeptide; NN, neural network; p-tau181, tau phosphorylated at threonine-181; PLTP, phospholipid transfer protein; TNF, tumor necrosis factor.
Fig. 5
Fig. 5. Biological pathways modulated by the polygenic risk variants of Alzheimer’s disease.
a Diagram showing the calculation of polygenic risk scores using the NN model. The five nodes in the penultimate layer were designated modules M1–M5. b Associations between the polygenic risk scores derived from the NN model and the outcomes of the five modules. c Heatmap showing the clusters of plasma proteins significantly associated with each module. The proteins formed four clusters (designated C1–C4) with respect to the absolute values of t-statistics. The number of proteins in each cluster are indicated in the plot. Representative Gene Ontology terms and cell-type enrichment analysis results are displayed in the center and right panels, respectively. d Protein–protein interaction network of proteins expressed by B cells. Colors denote proteins from C1 (red) and C4 (blue). e Cell-type-specific expression of TCL1A. (f) Plasma levels of TCL1A protein in NCs (n = 69) and patients with AD (n = 97). Data are presented as box-and-whisker plots. Boxes indicate the 25th to 75th percentiles, and whiskers indicate the 10th and 90th percentiles; numbers indicate the numbers of individuals in the corresponding group. Robust linear regression: **p < 0.01. AD, Alzheimer’s disease; FDR, false discovery rate; FPKM, fragments per kilobase per million mapped fragments; NC, normal control; NK, natural killer; NN, neural network; p, p-values; TCL1A, TCL1 family AKT coactivator A; TNF, tumor necrosis factor.
Fig. 6
Fig. 6. Stratification of individuals by polygenic risk score from neural network models.
a K-means clustering of the individuals in the Chinese AD WGS cohort 2 dataset according to the five sub-scores from the NN model. b Proportion of NCs in each group. c Levels of plasma ATN biomarkers in individual groups (n = 16, 41, 22, 29, and 34 individuals in Groups 1–5, respectively). Data are presented as mean ± SEM and analyzed using one-way ANOVA followed by Bonferroni’s post hoc test. *p < 0.05. d Heatmap of association t-values between plasma protein levels detected by two neurology panels and individual groups. According to their t-values, proteins were divided into four clusters using the k-means method (number of proteins in each cluster = 46, 35, 67, 35, from top to bottom, accordingly). e Pathway and Gene Ontology enrichment analysis results for proteins in each cluster. Aβ, amyloid-beta; AD, Alzheimer’s disease; ATN, amyloid-beta, tau, and neurofilament light polypeptide; FDR, false discovery rate; NC, normal control; NfL, neurofilament light polypeptide; NN, neural network; p-tau181, tau phosphorylated at threonine-181; SEM, standard error of the mean; UMAP, Uniform Manifold Approximation and Projection.

References

    1. Claussnitzer M, et al. A brief history of human disease genetics. Nature. 2020;577:179–189. doi: 10.1038/s41586-019-1879-7. - DOI - PMC - PubMed
    1. Melzer D, Pilling LC, Ferrucci L. The genetics of human ageing. Nat. Rev. Genet. 2020;21:88–101. doi: 10.1038/s41576-019-0183-6. - DOI - PMC - PubMed
    1. Hardy J. The amyloid hypothesis of Alzheimer’s disease: progress and problems on the road to therapeutics. Science (1979) 2002;297:353–356. - PubMed
    1. Hardy J. Amyloid, the presenilins and Alzheimer’s disease. Trends Neurosci. 1997;20:154–159. doi: 10.1016/S0166-2236(96)01030-2. - DOI - PubMed
    1. Lanoiselée H-M, et al. APP, PSEN1, and PSEN2 mutations in early-onset Alzheimer disease: a genetic screening study of familial and sporadic cases. PLoS Med. 2017;14:e1002270. doi: 10.1371/journal.pmed.1002270. - DOI - PMC - PubMed