

Heritability Estimation of Cognitive Phenotypes in the ABCD Study® Using Mixed Models
- PMID: 37024669
- PMCID: PMC10154273
- DOI: 10.1007/s10519-023-10141-2
Heritability Estimation of Cognitive Phenotypes in the ABCD Study® Using Mixed Models
Abstract
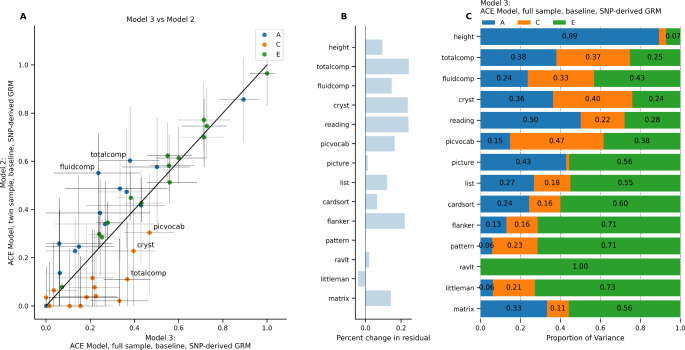
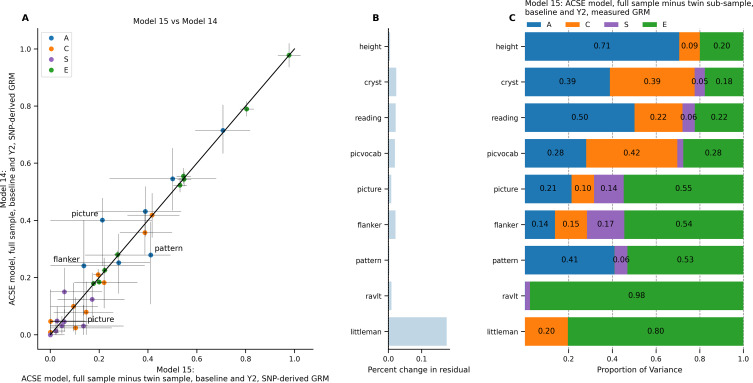
Twin and family studies have historically aimed to partition phenotypic variance into components corresponding to additive genetic effects (A), common environment (C), and unique environment (E). Here we present the ACE Model and several extensions in the Adolescent Brain Cognitive Development℠ Study (ABCD Study®), employed using the new Fast Efficient Mixed Effects Analysis (FEMA) package. In the twin sub-sample (n = 924; 462 twin pairs), heritability estimates were similar to those reported by prior studies for height (twin heritability = 0.86) and cognition (twin heritability between 0.00 and 0.61), respectively. Incorporating SNP-derived genetic relatedness and using the full ABCD Study® sample (n = 9,742) led to narrower confidence intervals for all parameter estimates. By leveraging the sparse clustering method used by FEMA to handle genetic relatedness only for participants within families, we were able to take advantage of the diverse distribution of genetic relatedness within the ABCD Study® sample.
Keywords: Cognition; Height; Heritability; Mixed models; Random effects; Twin studies.
© 2023. The Author(s).
Conflict of interest statement
The remaining authors have no conflicts of interest.
Figures


Similar articles
-
Methodological Considerations in Estimation of Phenotype Heritability Using Genome-Wide SNP Data, Illustrated by an Analysis of the Heritability of Height in a Large Sample of African Ancestry Adults.PLoS One. 2015 Jun 30;10(6):e0131106. doi: 10.1371/journal.pone.0131106. eCollection 2015. PLoS One. 2015. PMID: 26125186 Free PMC article.
-
Dominant Genetic Variation and Missing Heritability for Human Complex Traits: Insights from Twin versus Genome-wide Common SNP Models.Am J Hum Genet. 2015 Nov 5;97(5):708-14. doi: 10.1016/j.ajhg.2015.10.004. Am J Hum Genet. 2015. PMID: 26544805 Free PMC article.
-
Genetic and Environmental Contributions to the Covariation Between Cardiometabolic Traits.J Am Heart Assoc. 2018 Apr 18;7(9):e007806. doi: 10.1161/JAHA.117.007806. J Am Heart Assoc. 2018. PMID: 29669715 Free PMC article.
-
The utility of twins in developmental cognitive neuroscience research: How twins strengthen the ABCD research design.Dev Cogn Neurosci. 2018 Aug;32:30-42. doi: 10.1016/j.dcn.2017.09.001. Epub 2017 Sep 12. Dev Cogn Neurosci. 2018. PMID: 29107609 Free PMC article. Review.
-
A review of SNP heritability estimation methods.Brief Bioinform. 2022 May 13;23(3):bbac067. doi: 10.1093/bib/bbac067. Brief Bioinform. 2022. PMID: 35289357 Review.
Cited by
-
Heritability estimation of subcortical volumes in a multi-ethnic multi-site cohort study.bioRxiv [Preprint]. 2024 Jan 12:2024.01.11.575231. doi: 10.1101/2024.01.11.575231. bioRxiv. 2024. PMID: 38260520 Free PMC article. Preprint.
-
Partitioning variance in cortical morphometry into genetic, environmental, and subject-specific components.Cereb Cortex. 2024 Jun 4;34(6):bhae234. doi: 10.1093/cercor/bhae234. Cereb Cortex. 2024. PMID: 38850213 Free PMC article.
-
FEMA: Fast and efficient mixed-effects algorithm for large sample whole-brain imaging data.Hum Brain Mapp. 2024 Feb 1;45(2):e26579. doi: 10.1002/hbm.26579. Hum Brain Mapp. 2024. PMID: 38339910 Free PMC article.
-
Improving accuracy and precision of heritability estimation in twin studies through hierarchical modeling: reassessing the measurement error assumption.Front Genet. 2025 Apr 2;16:1522729. doi: 10.3389/fgene.2025.1522729. eCollection 2025. Front Genet. 2025. PMID: 40242473 Free PMC article.
-
Genetic resonance: dissecting the heritability and genetic correlations of human hearing acuity.G3 (Bethesda). 2025 Feb 5;15(2):jkae292. doi: 10.1093/g3journal/jkae292. G3 (Bethesda). 2025. PMID: 39663846 Free PMC article.
References
-
- Acker W. A computerized approach to psychological screening—the Bexley-Maudsley Automated Psychological Screening and the Bexley-Maudsley Category sorting test. Int J Man-Mach Stud. 1982;17:361–369. doi: 10.1016/S0020-7373(82)80037-0. - DOI
-
- Akaike H. A new look at the statistical model identification. IEEE Trans Autom Control. 1974;19:716–723. doi: 10.1109/TAC.1974.1100705. - DOI
-
- Akshoomoff N, Beaumont JL, Bauer PJ, Dikmen SS, Gershon RC, Mungas D, Slotkin J, Tulsky D, Weintraub S, Zelazo PD. VIII. NIH Toolbox Cognition Battery (CB): composite scores of crystallized, fluid, and overall cognition. Monogr Soc Res Child Dev. 2013;78:119–132. doi: 10.1111/mono.12038. - DOI - PMC - PubMed
-
- Anokhin AP, Luciana M, Banich M, Barch D, Bjork JM, Gonzalez MR, Gonzalez R, Haist F, Jacobus J, Lisdahl K, McGlade E, McCandliss B, Nagel B, Nixon SJ, Tapert S, Kennedy JT, Thompson W. Age-related changes and longitudinal stability of individual differences in ABCD Neurocognition measures. Dev Cogn Neurosci. 2022;54:101078. doi: 10.1016/j.dcn.2022.101078. - DOI - PMC - PubMed
Publication types
MeSH terms
Grants and funding
- U24 DA041147/DA/NIDA NIH HHS/United States
- U01 DA041134/DA/NIDA NIH HHS/United States
- U01 DA041174/DA/NIDA NIH HHS/United States
- U01 DA041048/DA/NIDA NIH HHS/United States
- U01 DA041156/DA/NIDA NIH HHS/United States
- U24 DA041123/DA/NIDA NIH HHS/United States
- U01 DA041093/DA/NIDA NIH HHS/United States
- U01 DA041106/DA/NIDA NIH HHS/United States
- U01 DA041148/DA/NIDA NIH HHS/United States
- U01 DA041089/DA/NIDA NIH HHS/United States
- U01 DA041120/DA/NIDA NIH HHS/United States
- T32 GM007198/GM/NIGMS NIH HHS/United States
- U01 DA041022/DA/NIDA NIH HHS/United States
- U01 DA041025/DA/NIDA NIH HHS/United States
- U01 DA041028/DA/NIDA NIH HHS/United States
- U01 DA041117/DA/NIDA NIH HHS/United States
LinkOut - more resources
Full Text Sources
Miscellaneous
