. 2024 Jan;42(1):72-86.
doi: 10.1038/s41587-023-01743-6. Epub 2023 Apr 6.

Quantitative analysis of tRNA abundance and modifications by nanopore RNA sequencing

Affiliations

Quantitative analysis of tRNA abundance and modifications by nanopore RNA sequencing

Morghan C Lucas et al. Nat Biotechnol. 2024 Jan.

Abstract

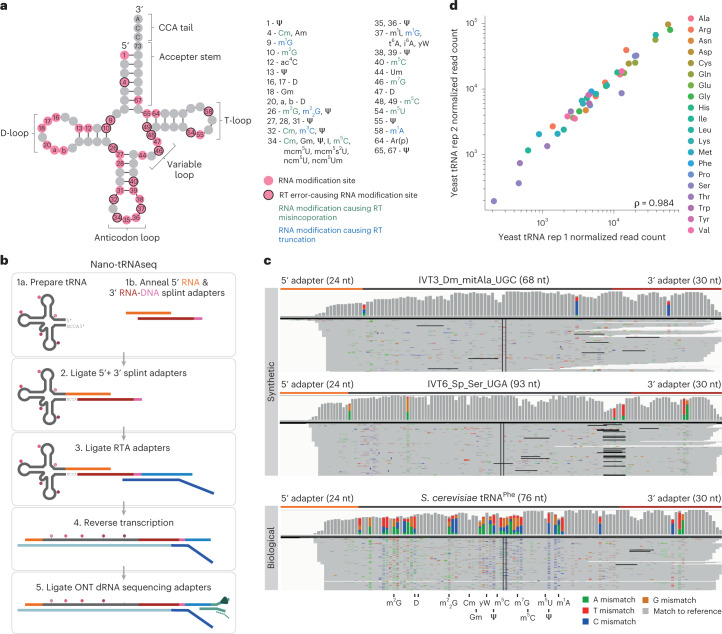
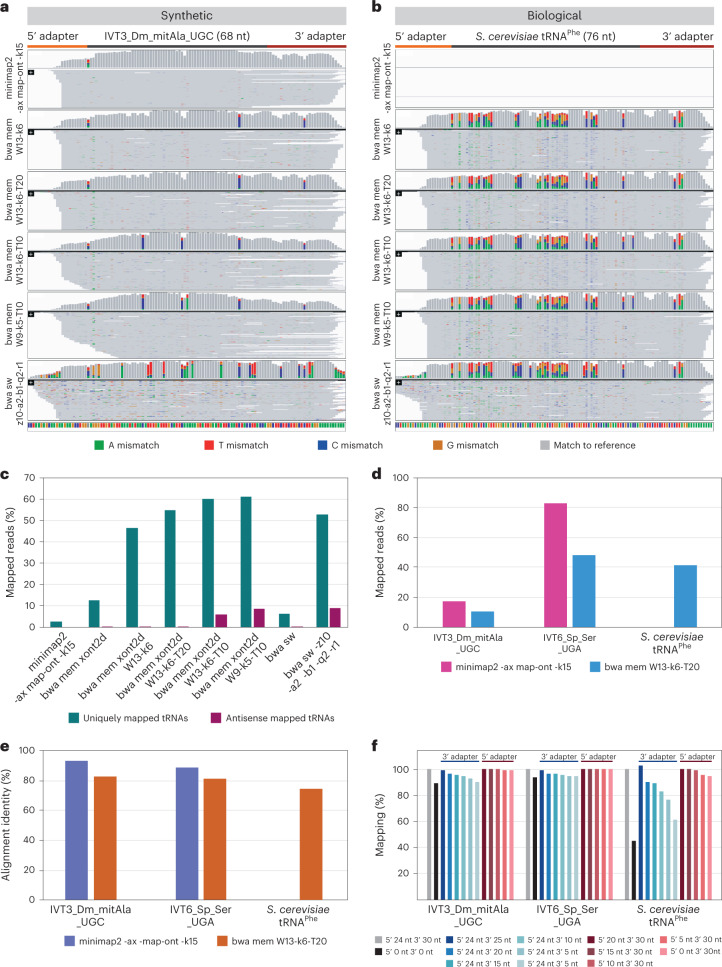
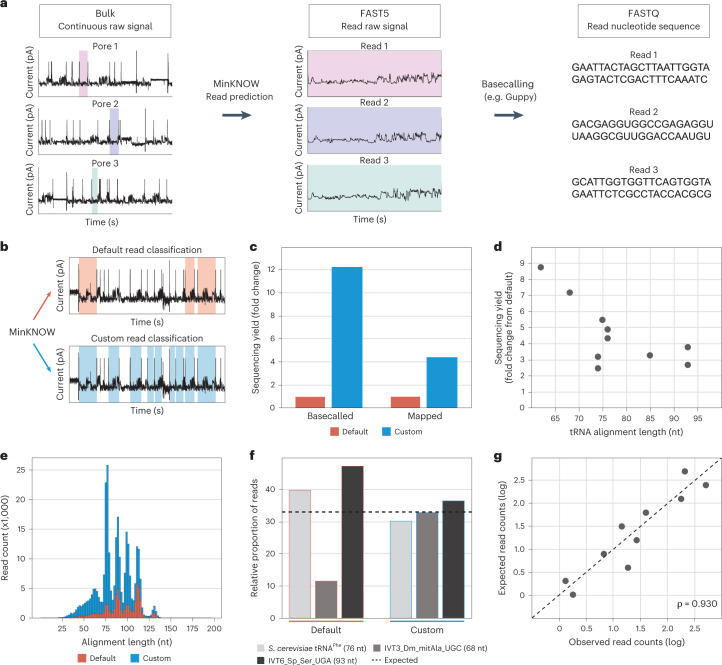
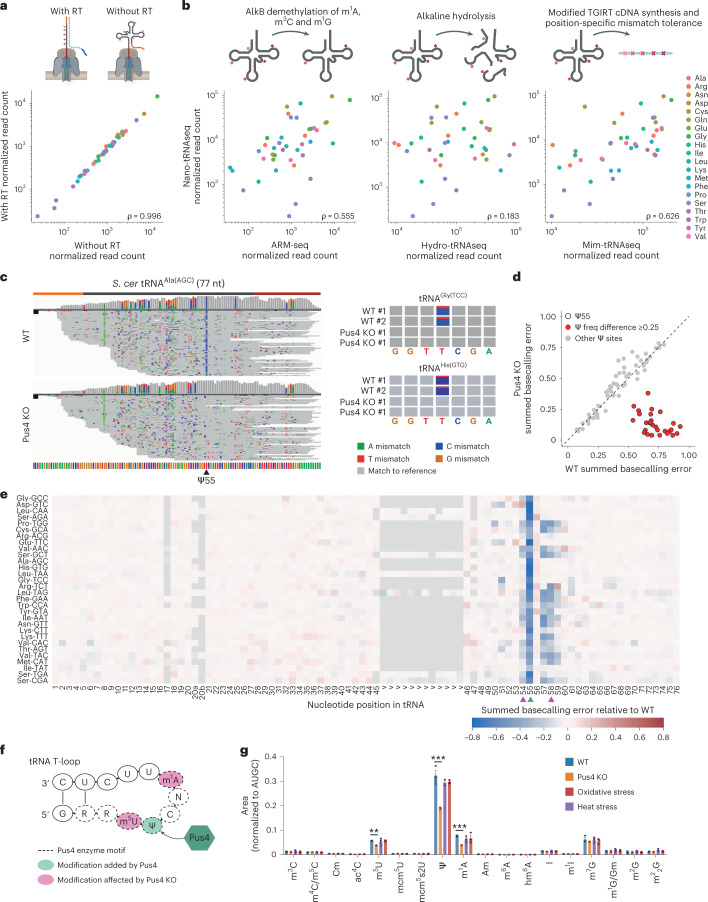
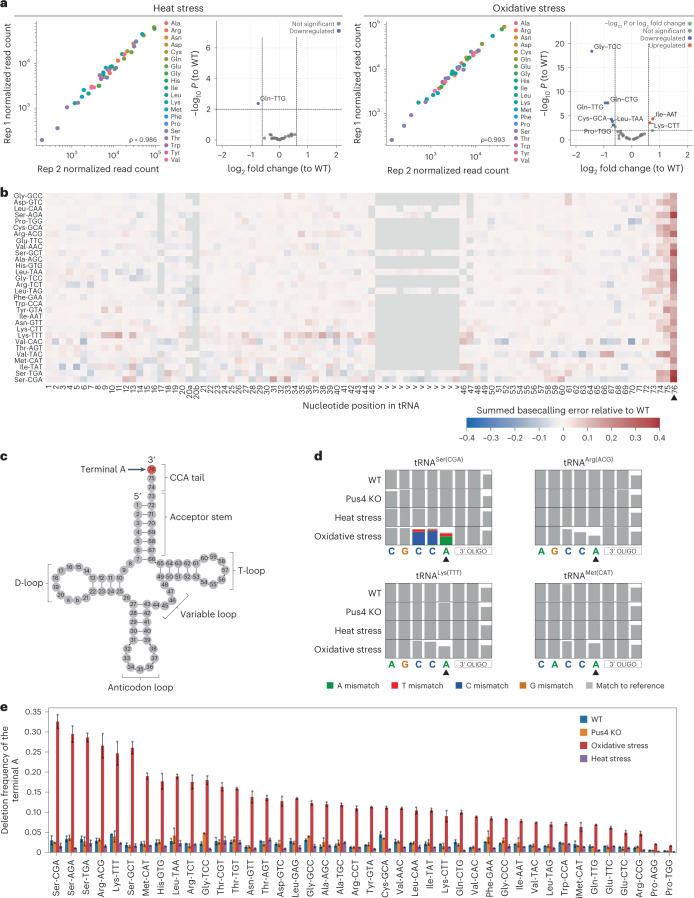
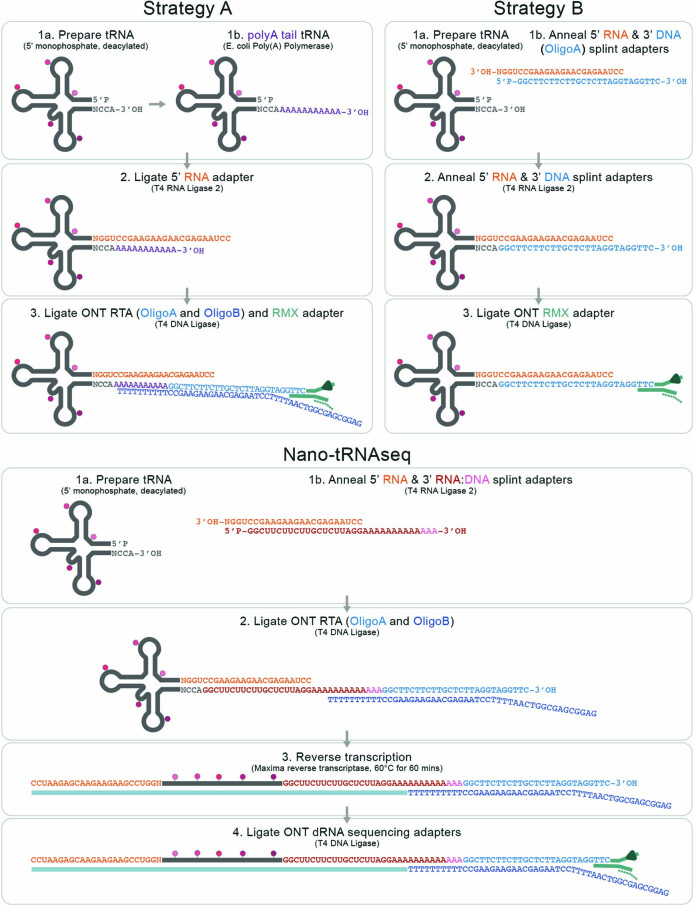
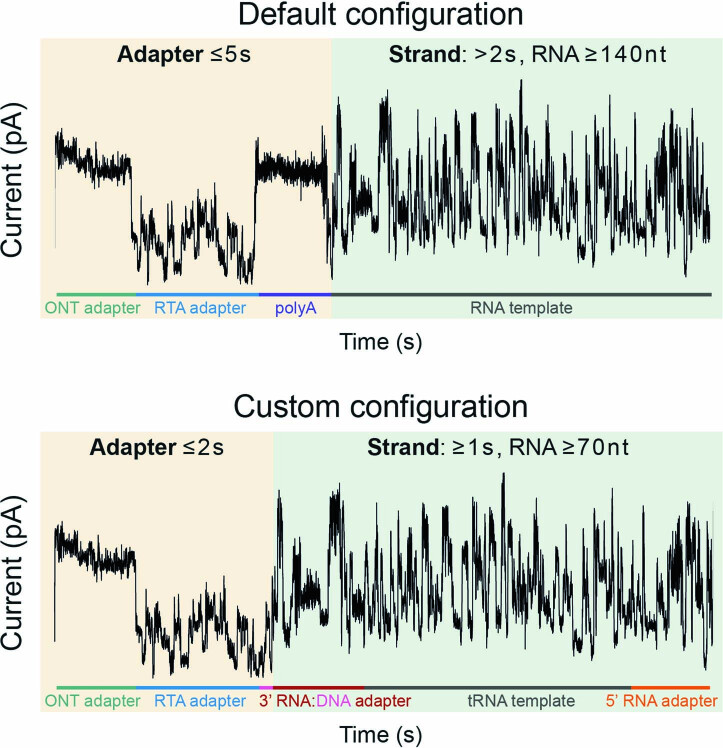
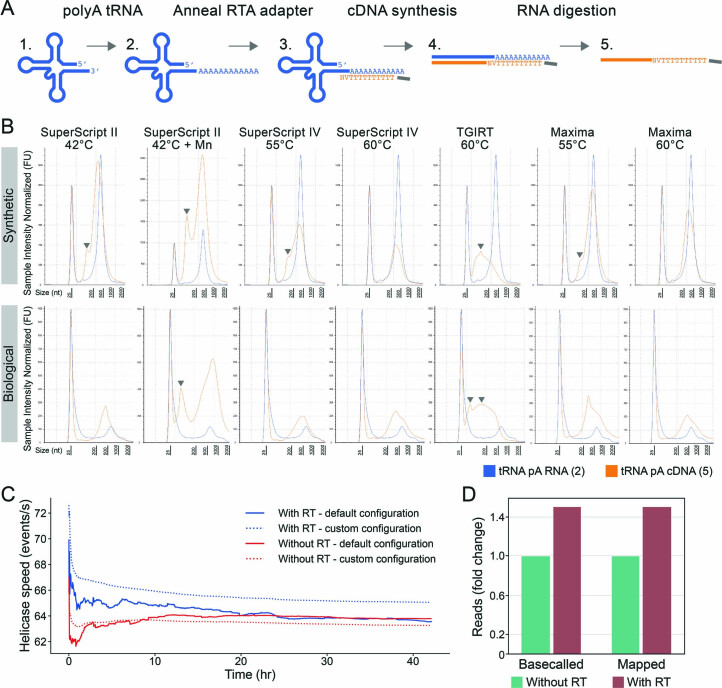
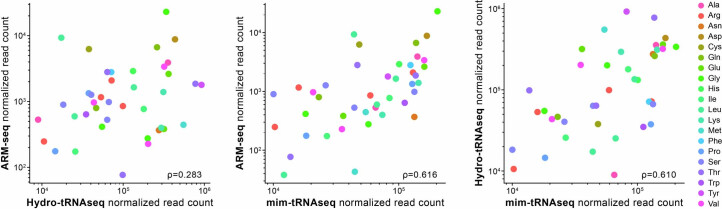
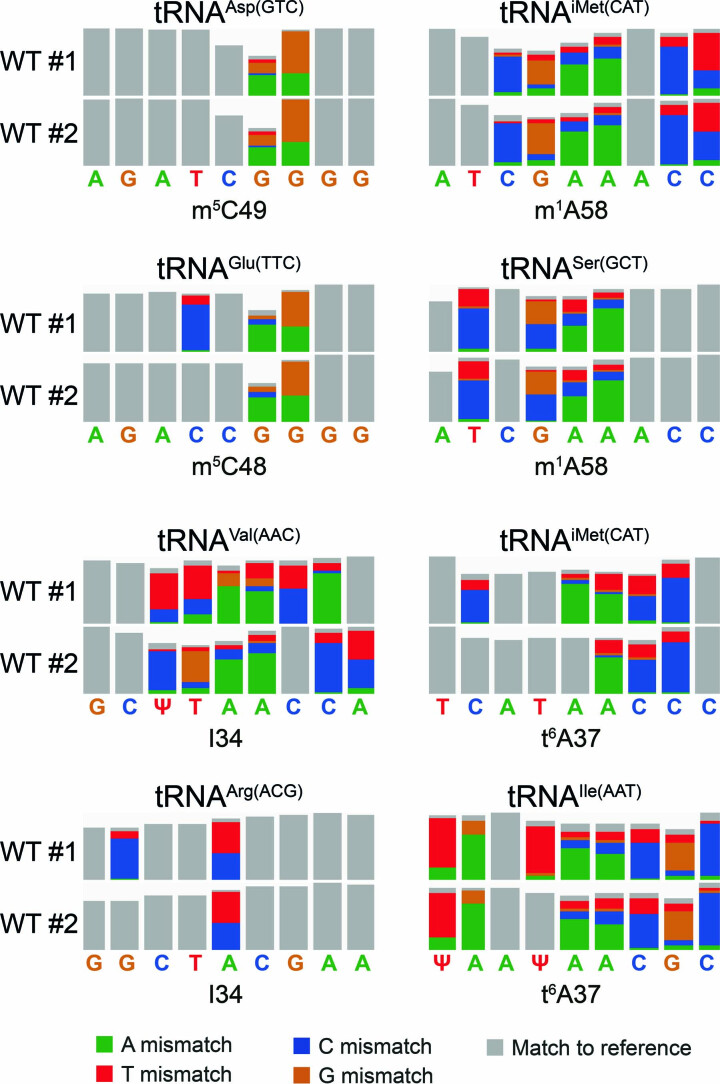
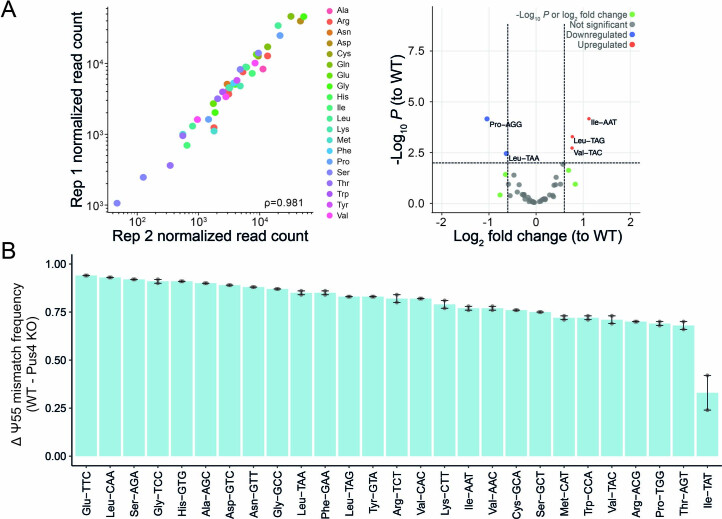
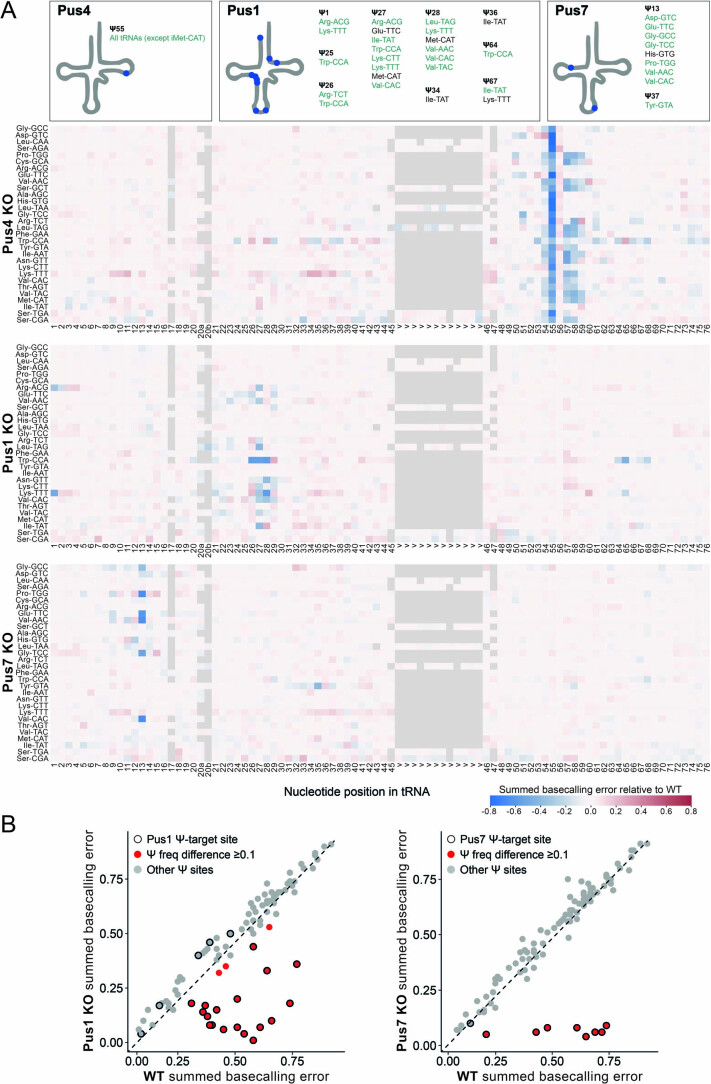
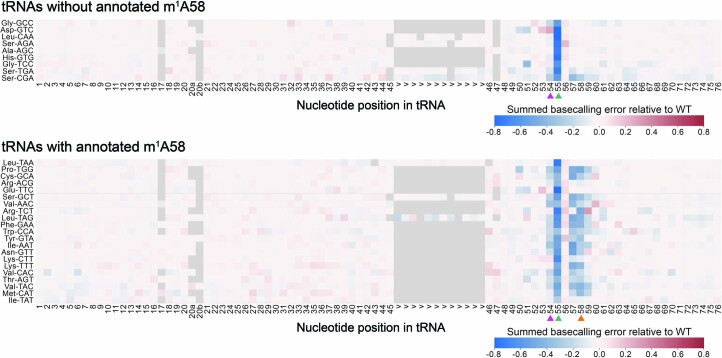
Transfer RNAs (tRNAs) play a central role in protein translation. Studying them has been difficult in part because a simple method to simultaneously quantify their abundance and chemical modifications is lacking. Here we introduce Nano-tRNAseq, a nanopore-based approach to sequence native tRNA populations that provides quantitative estimates of both tRNA abundances and modification dynamics in a single experiment. We show that default nanopore sequencing settings discard the vast majority of tRNA reads, leading to poor sequencing yields and biased representations of tRNA abundances based on their transcript length. Re-processing of raw nanopore current intensity signals leads to a 12-fold increase in the number of recovered tRNA reads and enables recapitulation of accurate tRNA abundances. We then apply Nano-tRNAseq to Saccharomyces cerevisiae tRNA populations, revealing crosstalks and interdependencies between different tRNA modification types within the same molecule and changes in tRNA populations in response to oxidative stress.


Conflict of interest statement

M.C.L., L.P. and E.M.N. have filed a patent on the Nano-tRNAseq library preparation method (application EP22382917). E.M.N. is a member of the Scientific Advisory Board of IMMAGINA Biotech. E.M.N. has received travel and accommodation expenses to speak at Oxford Nanopore Technologies conferences, and M.C.L. has received an Oxford Nanopore Technologies travel bursary. The authors declare that the submitted work was otherwise carried out in the absence of any professional or financial relationships that could potentially be construed as a conflict of interest.

Figures

Fig. 1
Fig. 1. Nano-tRNAseq can efficiently sequence both IVT and native tRNA populations.
a, Schematic of the modifications found in S. cerevisiae cytoplasmic tRNA, shown in its usual secondary structure form with circles representing nucleotides and lines representing base pairs. Gray circles represent unmodified nucleotides; pink circles represent possible modification sites; and those with a black outline indicate modifications that cause errors during reverse transcription. Possible RNA modifications occurring at each position are listed in the surrounding boxes; modifications that cause misincorporation during reverse transcription are in green; and those that cause reverse transcription truncation are in blue. b, Schematic overview illustrating the steps required for tRNA library preparation using Nano-tRNAseq (see Extended Data Fig. 1 for more details). c, IGV snapshots of Nano-tRNAseq mapped reads from synthetic IVT tRNAs (upper panels) or biological tRNAs (lower panel). Positions with a mismatch frequency greater than 0.2 are colored, whereas those showing mismatch frequencies lower than 0.2 are shown in gray. d, Scatter plot of tRNA abundances showing the replicability of Nano-tRNAseq when WT S. cerevisiae tRNA biological replicates are sequenced. The correlation strength is indicated by Spearman’s correlation coefficient (ρ). RT, reverse transcription.
Fig. 2
Fig. 2. The choice of mapping software and parameters markedly affects the number of mapped tRNA reads.
a,b, IGV snapshots of reads mapped to IVT D. melanogaster mitochondrial tRNAAla(UGC) (a) and S. cerevisiae tRNAPhe (b), mapped using different mapping algorithms (minimap2, BWA-MEM and BWA-SW) and parameters. The 5′ and 3′ RNA adapter regions, ligated to the ends of the tRNA molecule, were included in the mapping references and are represented by an orange bar and a red bar, respectively. Positions with a mismatch frequency greater than 0.2 are colored, whereas those showing mismatch frequencies lower than 0.2 are shown in gray. c, Bar plot depicting the effect of algorithm and parameter choice on the relative proportion of uniquely mapped reads (green) and mismapped reads (purple; reads mapping to antisense strands were used as a proxy to assess mismapping) (Supplementary Table 4). The proportion of mapped reads (d) and alignment identity (e) for each template from the bar plot in c, using either minimap2 or bwa mem -W13 -k6- T20. We should note that minimap2 alignment identity in S. cerevisiae tRNAPhe was not computed because no reads were mapped to this tRNA using minimap2 with -ax map-ont -k15 parameters (Supplementary Table 5). f, Bar plot showing the effect of trimming the length of the 5′ RNA adapter (reds) and 3′ RNA adapter (blues) on tRNA read mappability (Supplementary Table 6). The conditions used by Nano-tRNAseq are gray, whereas the effect of not using RNA adapters is black.
Fig. 3
Fig. 3. Adjustment of MinKNOW parameters increases the number of sequenced and mapped tRNA reads.
a, MinKNOW software classifies continuous current passing through pores as open pore, adapter or strand (actual reads) and outputs fragments classified as strand to a FAST5 file, which are then basecalled to generate a FASTQ file. b, Diagram showing the conceptual difference between default and custom MinKNOW read classification (Extended Data Fig. 4). c, Bar plot of sequencing yield in terms of basecalled and uniquely mapped reads obtained with default and custom configurations (Supplementary Table 7). d, Scatter plot of the relative fold change of uniquely mapped reads with respect to tRNA length (Supplementary Table 8). e, Histogram of read count and alignment length of IVT tRNA reads captured with default and custom configurations. f, Bar plot of the relative proportion of IVT tRNA molecules D. melanogaster mitochondrial tRNAAla(UGC) and S. pneumoniae tRNASer(UGA) and native S. cerevisiae tRNAPhe reads recovered with default and custom settings (Supplementary Table 9), where the dotted line indicates the expected proportion. g, Expected versus observed log read counts of nine IVT and one native tRNA molecules captured using the custom MinKNOW configuration (Supplementary Table 10). Spearman correlation (ρ) is shown.
Fig. 4
Fig. 4. Nano-tRNAseq can quantify tRNA abundance and RNA modifications as well as capture modification interdependencies.
a,b, Scatter plots of WT S. cerevisiae tRNA abundances sequenced with Nano-tRNAseq with and without the reverse transcription step (a) and compared to orthogonal Illumina-based tRNA sequencing methods (b). Each point represents a tRNA alloacceptor and is colored by alloacceptor type; the key is shown in b. The correlation strength is indicated by Spearman’s correlation coefficient (ρ). c, IGV tracks of tRNAAla(AGC) from WT and Pus4 KO S. cerevisiae strains (n = 2 biological replicates). Ψ55 is indicated with a black arrowhead. Adjacent are zoomed IGV snapshots of the Ψ55 region. Positions with a mismatch frequency greater than 0.2 are colored, whereas those lower than 0.2 are shown in gray. d, Scatter plot showing the mismatch frequencies for Ψ sites in S. cerevisiae WT versus Pus4 KO tRNA molecules. Each data point represents a known tRNA Ψ site; a black outline indicates Ψ55 sites; and a red fill indicates sites with a summed basecalling error of ≥0.25 compared to WT. e, Heat map of the summed basecalling error of Pus4 KO relative to WT, for each nucleotide (x axis) and for each tRNA isoacceptor (y axis, ordered from most to least abundant in descending order)(Supplementary Table 17). The positions of known tRNA modifications found in each tRNA gene are listed in Supplementary Table 18. The Pus4 target Ψ55 is indicated with a green arrowhead and m5U54 and m1A58 with pink arrowheads. See also Extended Data Fig. 9a for biological replicate 2. f, Schematic of the tRNA T-loop targeted by the Pus4 enzyme. Nucleotides with a dotted outline represent the Pus4 binding motif (RRUUCNA); Ψ55 is highlighted in green; and m5U54 and m1A58 are highlighted in pink. g, LC–MS/MS validation of S. cerevisiae tRNA modification levels. See also Supplementary Tables 19 and 20. Bars represent mean ± s.e.m. for n = 3 biological replicates per condition. P values were determined using a one-way ANOVA with Tukey correction for multiple comparisons, and significance was assessed by comparison to WT. *P < 0.05, **P < 0.01, ***P < 0.001, P(m5U) = 0.0015, P(Ψ) and P(m1A) < 0.0001. RT, reverse transcription.
Fig. 5
Fig. 5. Characterization of tRNA abundance and modification dynamics upon exposure to stress reveals that the CCA tail is deadenylated in oxidative stress.
a, Scatter plots of tRNA abundances of S. cerevisiae heat stress (45 °C for 1 hour) and oxidative stress (2 mM H202 for 1 hour) across biological replicates. Each point represents a tRNA alloacceptor and is colored based on alloacceptor type. The correlation strength is indicated by Spearman’s correlation coefficient (ρ). See also Supplementary Table 21. Volcano plots depicting differentially expressed tRNAs (relative to the untreated condition) are also shown for each stress type. See also Supplementary Tables 22 and 23. Differentially expressed tRNAs were defined as having an adjusted log10 P < 0.01 and an absolute log2 fold change greater than 0.6. b, Heat map of summed basecalling error of oxidative stress relative to WT, for each nucleotide (x axis) and for each tRNA (y axis, ordered from most to least abundant in descending order). See also Supplementary Table 17. The positions of specific RNA modifications in each tRNA are listed in Supplementary Table 18. Nucleotides with a lower summed basecalling error frequency relative to WT are in blue tones, and those with a higher summed basecalling error frequency are in red tones, as seen with the terminal A at position 76 (black arrowhead). Heat maps corresponding to other biological replicates can be found in Supplementary Fig. 2b. c, Schematic of a generic S. cerevisiae cytoplasmic tRNA in its usual secondary structure with the terminal A nucleotide of the CCA tail highlighted in red. d, Zoomed snapshots of IGV tracks featuring the terminal A (black arrowhead). Positions with a mismatch frequency greater than 0.2 are colored, whereas those showing mismatch frequencies lower than 0.2 are shown in gray. e, Bar plot of the deletion frequency of the terminal A base for each S. cerevisiae tRNA isoacceptor under oxidative stress (red), Pus4 KO (orange) or heat stress (purple) or in WT conditions (blue) (Supplementary Table 24). Error bars represent mean ± s.d. for n = 2 biological replicates per condition.
Extended Data Fig. 1
Extended Data Fig. 1. Comparison of the strategies tested to sequence tRNA molecules using nanopore DRS.
(a) Schematic overview of the three distinct library preparations, Strategy A, Strategy B, and Nano-tRNAseq, tested to sequence tRNA molecules.
Extended Data Fig. 2
Extended Data Fig. 2. Increased ligation time and addition of PEG8000 improves 5′ RNA adapter ligation efficiency.
(a) TBE-Urea gels showing the effect of reaction duration and the addition of 20% PEG8000 on ligation efficiency using commercial S. cerevisiae tRNAPhe as the ligation template. (b) Barplot of the ligation product (tRNAPhe ligated to the 5′ RNA adapter) normalized to an unligated tRNAPhe control. Error bars represent mean ± stdev for n = 3 replicates per condition. P values were determined using a two-sided t-test, *P < 0.05, 2 h 25 °C vs 2 h 25 °C p-value = 0.0241, 20 min 25 °C vs 20 min 25 °C p-value = 0.0450. ON = overnight, PEG = PEG8000 (final concentration of 30%).
Extended Data Fig. 3
Extended Data Fig. 3. 5′ and 3′ RNA oligos can be efficiently ligated to tRNA molecules.
TBE-Urea gel of adapter ligation steps used in Nano-tRNAseq, using commercial S. cerevisiae tRNAPhe as the ligation template. The lanes are as follows (1) 5′ RNA adapter, (2) 3′ RNA adapter, (3) tRNAPhe, (4) tRNAPhe ligated to 5′ and 3′ adapters, (5) tRNAPhe and 5′ and 3′ adapters, without ligase control, (6) tRNAPhe ligated to 5′ and 3′ adapters and RTA adapter, (7) tRNAPhe and 5′ and 3′ adapters and RTA adapter, without ligase control. The experiment was repeated independently twice with similar results.
Extended Data Fig. 4
Extended Data Fig. 4. Schematic of default and custom MinKNOW read classification.
Under default settings, sequenced templates are classified as reads and if the Adapter portion, which contains the ONT adapter, RTA adapter, and polyA tail, is 5 seconds or less, and the Strand portion, which contains the RNA template, is more than 2 seconds, which corresponds to an RNA molecule of roughly 140 nt. For Nano-tRNAseq, we use a custom configuration in which the Adapter portion, which contains the ONT adapter, RTA adapter, and the DNA portion of the 3′ RNA:DNA adapter, is 2 seconds or less, and the Strand portion, which contains the RNA portion of the 3′ RNA:DNA adapter, the tRNA template, and the 5’ RNA adapter, is 1 second or more, which corresponds to an RNA molecule of roughly 70 nt.
Extended Data Fig. 5
Extended Data Fig. 5. Comparison of the activity of diverse reverse transcriptase enzymes for tRNA linearization.
(a) The strategy used to test the reverse transcription activity of different enzymes. Starting from either in vitro transcribed (IVT) or native tRNA (1), the tRNA was polyadenylated (2) and annealed with an oligodT adapter (3), which was used to initiate the cDNA synthesis using different RT enzymes and conditions. The RNA strand of the linearized product (4) was digested, leaving the cDNA strand (5), which was checked via TapeStation. (b) TapeStation profiles depicting the original polyA (pA) tRNA product (blue) and the cDNA product (orange) that is produced by reverse transcription of the template using diverse reverse transcriptases and incubation conditions. Truncated cDNA products are shown with a gray triangle. The 25 nt peak that is present in all samples corresponds to the loading size marker. The upper panel is IVT tRNA, and the lower panel is commercial S. cerevisiae tRNAPhe. (c) Helicase speed (events/s roughly corresponds to nt/s sequenced) over time of wild-type (WT) S. cerevisiae total tRNA sequenced with or without reverse transcription (RT) and classified using the default or custom MinKNOW configuration. (d) Barplot showing the fold change of basecalled and uniquely mapped reads when WT S. cerevisiae total tRNA is linearized with reverse transcription, compared to without reverse transcription.
Extended Data Fig. 6
Extended Data Fig. 6. Comparison of the Illumina-based methods to each other.
Scatterplots comparing Illumina-based tRNA sequencing methods ARM-seq, Hydro-tRNAseq, and mim-tRNAseq, to each other when sequencing wild-type S. cerevisiae total tRNA. Each point represents a tRNA alloacceptor and is colored based on alloacceptor type. The correlation strength is indicated by Spearman’s correlation coefficient (ρ).
Extended Data Fig. 7
Extended Data Fig. 7. RNA modification signatures observed in Nano-tRNAseq datasets span multiple bases and are sequence-dependent.
Zoomed snapshots of WT S. cerevisiae Nano-tRNAseq runs, highlighting the signatures at m5C, m1A, I, and t6A modified sites. The upper row corresponds to biological replicate 2, and the lower row corresponds to biological replicate 2. Positions with a mismatch frequency greater than 0.2 are colored, whereas those showing mismatch frequencies lower than 0.2 are shown in gray.
Extended Data Fig. 8
Extended Data Fig. 8. tRNA abundance and changes in RNA modification stoichiometry can be quantified using Nano-tRNAseq.
(a) Scatterplots showing tRNA abundances of S. cerevisiae Pus4 knockout (KO) across biological replicates. See also Supplementary Table 21. Each point represents a tRNA alloacceptor and is colored based on alloacceptor type. The correlation strength is indicated by Spearman’s correlation coefficient (ρ Differential expression volcano plot of pus4KO versus WT (see also Supplementary Table 13). Differentially expressed tRNAs were defined as having an adjusted -log10 P-value of <0.01 and an absolute log2 fold change greater than 0.6. (b) Change in Ψ55 mismatch frequency upon knockout of Pus4, relative to WT, for each isoacceptor, as calculated by NanoRMS. Data are presented as mean ± SEM for n = 2 biological replicates.
Extended Data Fig. 9
Extended Data Fig. 9. Nano-tRNAseq can capture RNA modifications changes upon knockout of pseudouridine synthase enzymes.
(a) Heatmap of summed basecalling error frequency of Pus4 KO biological replicate 2, Pus1 KO, and Pus7 KO (see also Supplementary Table 16 and Supplementary Table 17). The known positions of specific RNA modifications in each tRNA, as listed in MODOMICS, are shown in schematic above, as well as listed in Supplementary Table 18. Ψ positions observed in Nano-tRNAseq are highlighted in green (greater or equal to 0.1, see Supplementary Table 15). Nucleotides with a higher summed basecalling error frequency relative to WT are in red tones, and those with a lower summed basecalling error frequency are in blue tones. (b) Comparison of mismatch frequencies for known Ψ sites in S. cerevisiae WT vs. Pus1 and Pus7 KO tRNA molecules. Each data point represents a known tRNA Ψ site; a black outline indicates Ψ55 sites targeted by the enzyme in question, and a red fill indicates sites with a summed basecalling error of ≥0.1 for Pus 1 KO and Pus 7 KO compared to WT, which serves as a proxy for Ψ modification frequency.
Extended Data Fig. 10
Extended Data Fig. 10. Ψ55-dependent basecalling error is restricted to position 55 independent of m1A58 presence.
Heatmap of summed basecalling error frequency of Pus4 KO biological replicate 1 (as in Fig. 4e) categorized by tRNA isoacceptors without an annotated m1A58 (upper panel) or those with an annotated m1A58 (lower panel). The positions of specific RNA modifications in each tRNA are listed in Supplementary Table 18. Nucleotides with higher summed basecalling error frequency relative to WT are in red tones, and those with a lower basecalling error frequency are in blue tones. Ψ55 is indicated by a green arrowhead, m5U54 by a pink arrowhead, and m1A58 by an orange arrowhead.

Comment in

References

    1. Schimmel P. The emerging complexity of the tRNA world: mammalian tRNAs beyond protein synthesis. Nat. Rev. Mol. Cell Biol. 2018;19:45–58. doi: 10.1038/nrm.2017.77. - DOI - PubMed
    1. Novoa EM, Ribas de Pouplana L. Speeding with control: codon usage, tRNAs, and ribosomes. Trends Genet. 2012;28:574–581. doi: 10.1016/j.tig.2012.07.006. - DOI - PubMed
    1. Phizicky EM, Hopper AK. tRNA biology charges to the front. Genes Dev. 2010;24:1832–1860. doi: 10.1101/gad.1956510. - DOI - PMC - PubMed
    1. Pan T. Modifications and functional genomics of human transfer RNA. Cell Res. 2018;28:395–404. doi: 10.1038/s41422-018-0013-y. - DOI - PMC - PubMed
    1. Jia G, et al. N6-methyladenosine in nuclear RNA is a major substrate of the obesity-associated FTO. Nat. Chem. Biol. 2011;7:885–887. doi: 10.1038/nchembio.687. - DOI - PMC - PubMed

LinkOut - more resources