. 2023 Apr;25(4):579-591.
doi: 10.1038/s41556-023-01114-y. Epub 2023 Apr 6.

Dynamic antagonism between key repressive pathways maintains the placental epigenome

Affiliations

Dynamic antagonism between key repressive pathways maintains the placental epigenome

Raha Weigert et al. Nat Cell Biol. 2023 Apr.

Abstract

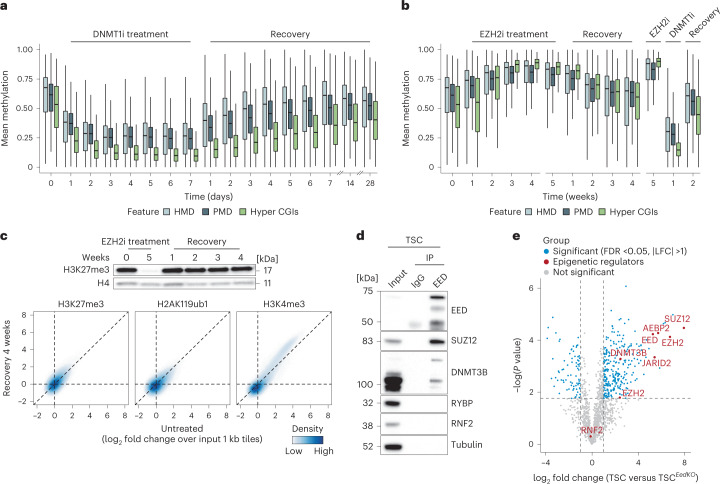
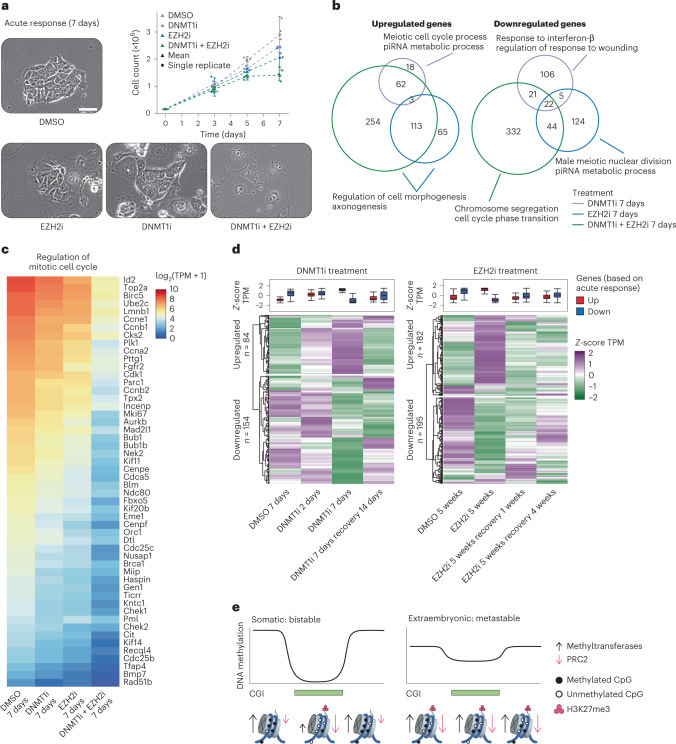
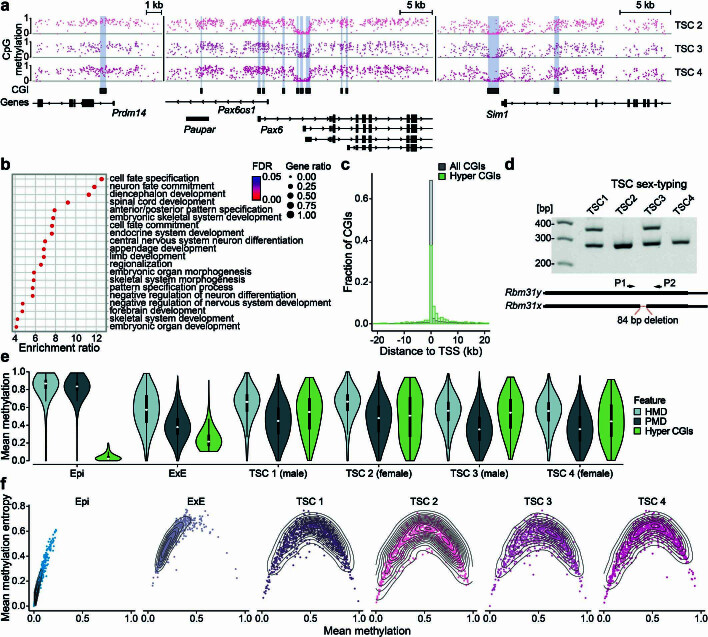
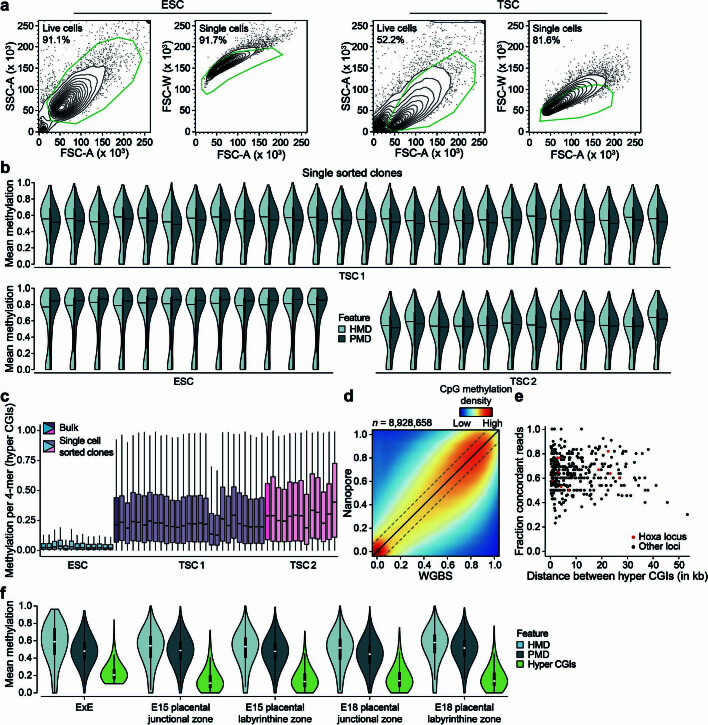
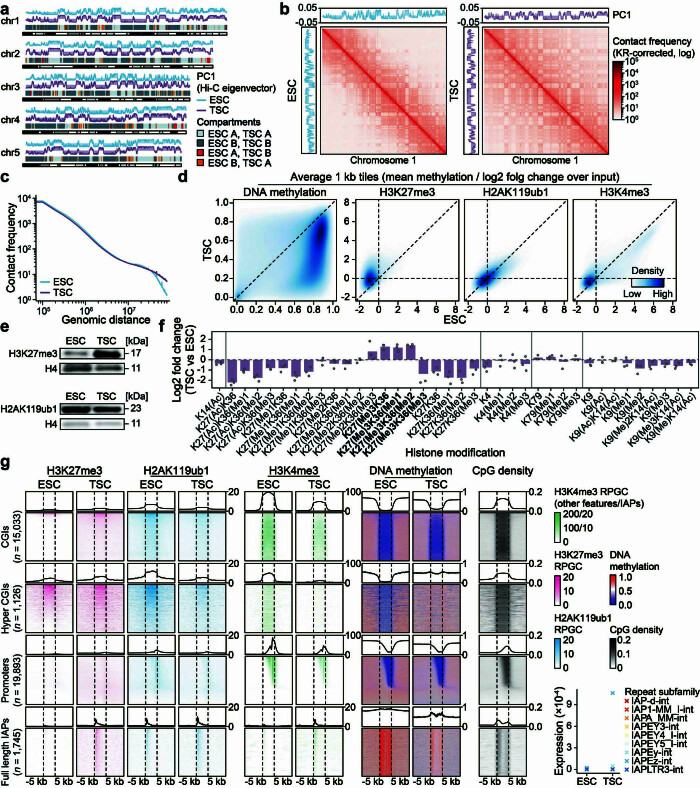
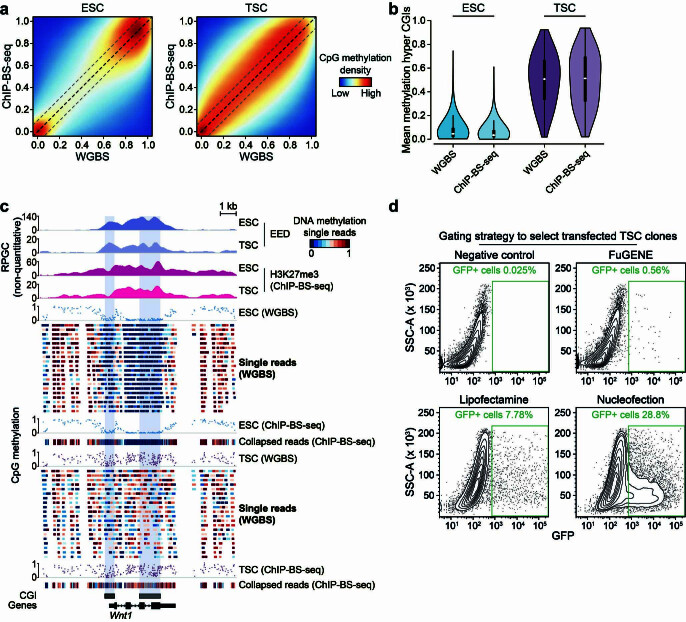
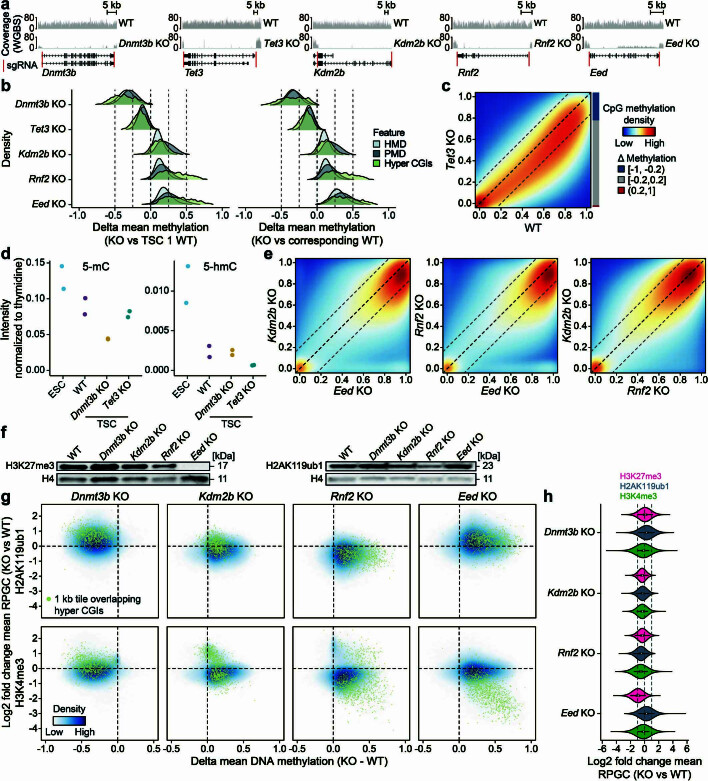
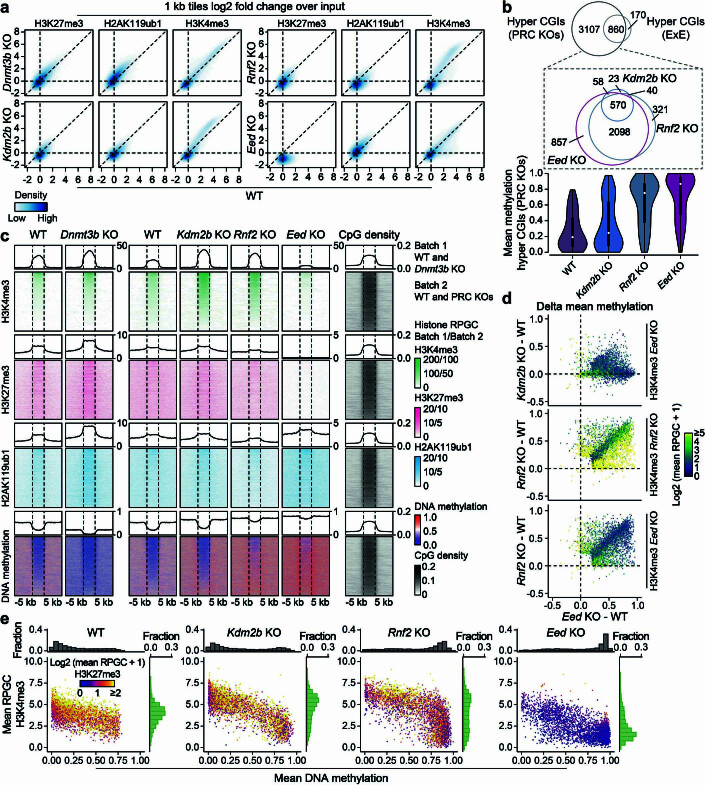
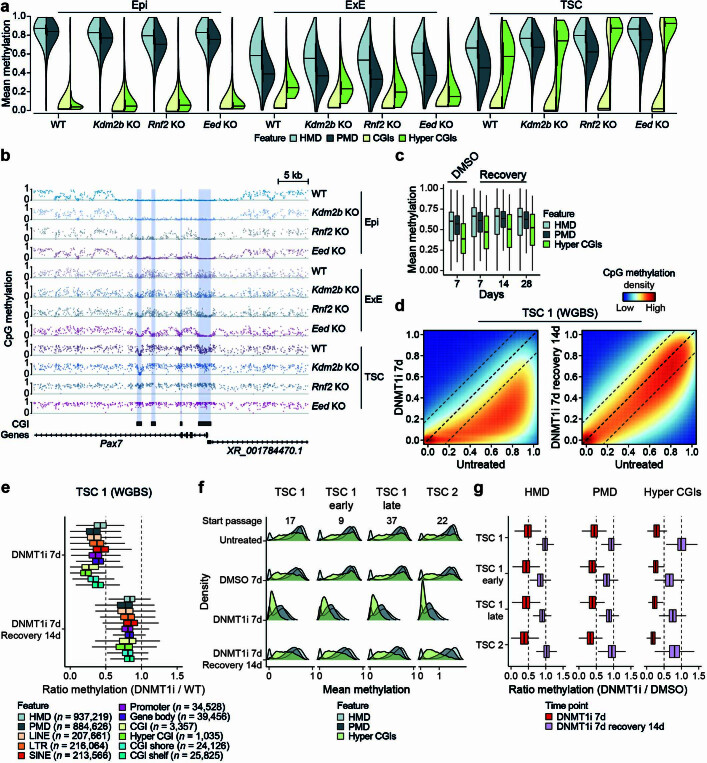
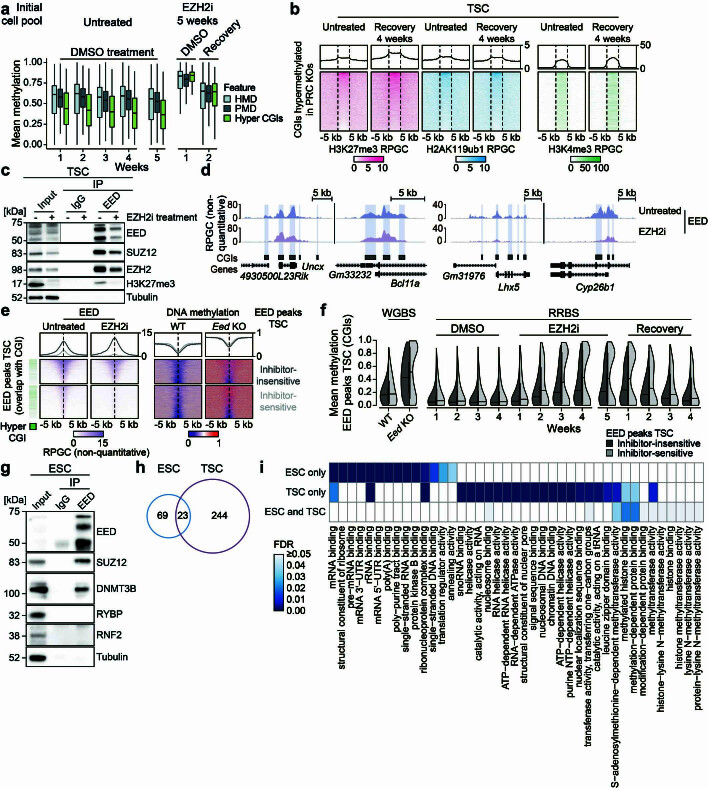
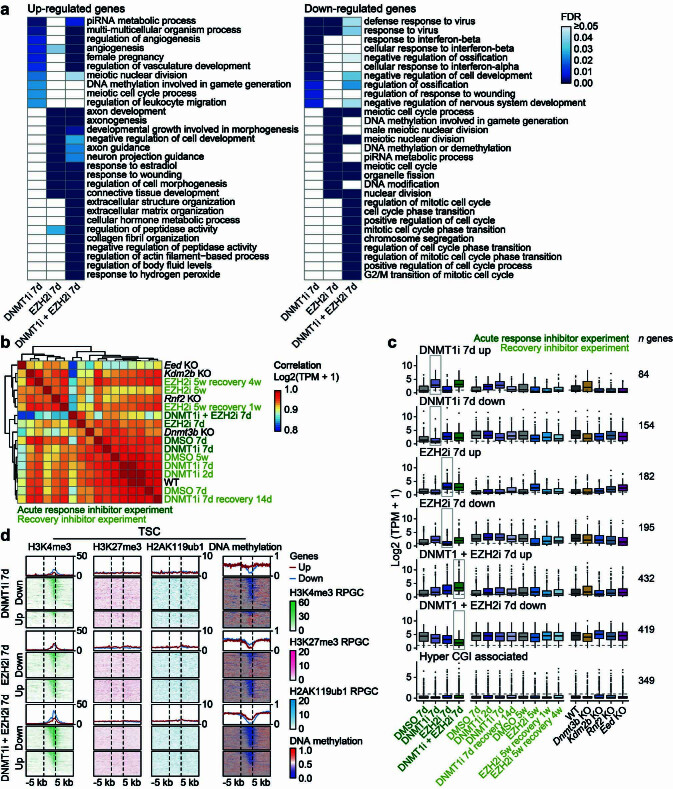
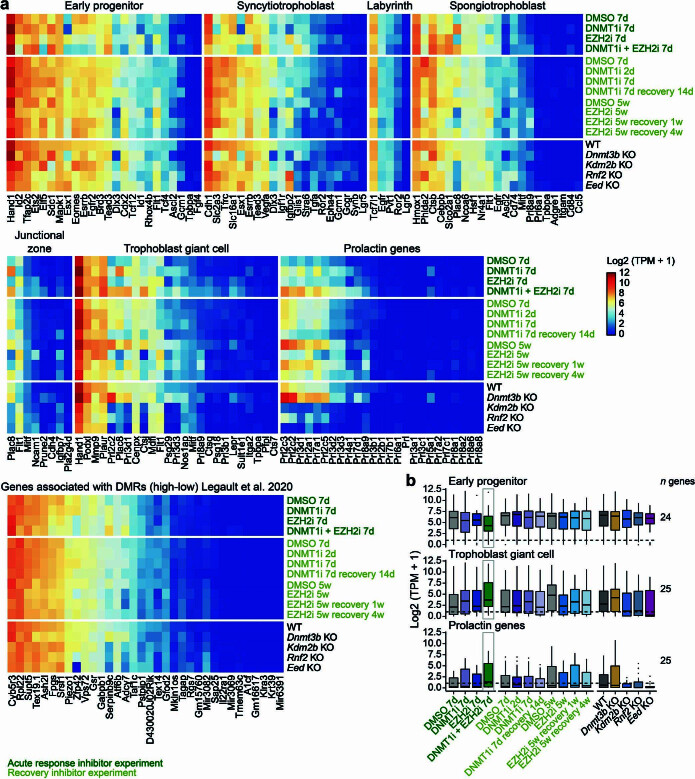
DNA and Histone 3 Lysine 27 methylation typically function as repressive modifications and operate within distinct genomic compartments. In mammals, the majority of the genome is kept in a DNA methylated state, whereas the Polycomb repressive complexes regulate the unmethylated CpG-rich promoters of developmental genes. In contrast to this general framework, the extra-embryonic lineages display non-canonical, globally intermediate DNA methylation levels, including disruption of local Polycomb domains. Here, to better understand this unusual landscape's molecular properties, we genetically and chemically perturbed major epigenetic pathways in mouse trophoblast stem cells. We find that the extra-embryonic epigenome reflects ongoing and dynamic de novo methyltransferase recruitment, which is continuously antagonized by Polycomb to maintain intermediate, locally disordered methylation. Despite its disorganized molecular appearance, our data point to a highly controlled equilibrium between counteracting repressors within extra-embryonic cells, one that can seemingly persist indefinitely without bistable features typically seen for embryonic forms of epigenetic regulation.


Conflict of interest statement

A.M. and Z.D.S. are inventors on a patent related to hypermethylated CGI targets in cancer. Z.D.S. and A.M. are co-founders and scientific advisors of Harbinger Health. The remaining authors declare no competing interests.

Figures

Fig. 1
Fig. 1. Dynamic turnover of globally intermediate DNA methylation.
a, Genome browser tracks of CpG methylation and methylation entropy for murine epiblast (Epi), ExE and TSCs. b, Methylation of HMDs (n = 959,249 1 kb tiles), PMDs (n = 954,783 1 kb tiles) and hyper CGIs (n = 1,102) in TSCs (single biological replicate). Pie chart shows the fraction of hyper CGIs targeted by PRC2 in ESCs. White dots denote the median, edges the interquartile range (IQR) and whiskers either 1.5× IQR or minima/maxima (if no point exceeded 1.5× IQR; minima/maxima are indicated by the violin plot range). c, Scatter plot comparing mean methylation entropy and mean CpG methylation at hyper CGIs in TSCs. d, Box plots of methylation entropy per 4-mer (n = 21,952) in hyper CGIs for individual subclones (RRBS data). Each subclone reaches similar entropy levels (low for ESCs, high for TSCs) to in silico generated bulk data. Lines denote the median, edges the IQR and whiskers either 1.5× IQR or minima/maxima (if no point exceeded 1.5× IQR; outliers were omitted). e, Top: genome browser track of the Hoxa locus comparing WGBS and long-read data. Bottom: single reads (98 kb average read length) all display intrinsically heterogeneous methylation. Missing CpGs within reads reflect low likelihood of the methylation call (Methods). f, Fraction of concordant reads that span two hyper CGIs (n = 383 CGI pairs, ≥10× coverage). A read is termed ‘concordant’ if CGI pairs are both above or below the median of their unphased values. Coordination between CGI pairs is apparent compared to randomly shuffled, unphased averages. Hoxa locus pairs are marked in red. Lines denote the median, edges denote the IQR, whiskers denote 1.5× IQR and minima/maxima are represented by dots.
Fig. 2
Fig. 2. Global increase of H3K27me3 in TSCs compared to ESCs.
a, Log2 fold change of normalized Hi-C contact frequencies in TSCs compared with ESCs (two merged technical replicates per cell type; this also applies to be) on chromosome 1 (100 kb bins). Top and left: first principal component illustrating ESC compartments (A, positive values; B, negative values). b, Box plots of Hi-C A/B compartment interaction ratios per 100 kb bin (n = 23,482 bins, see Methods). The A/B interaction ratio differs significantly between ESCs and TSCs for B compartments (two-sided Wilcoxon rank-sum test, P = 0.0177 and P < 2.2 × 10−16 for A and B compartments, respectively). However, the overall effect is minimal. Lines denote the median, edges denote the IQR, whiskers denote 1.5× IQR and minima/maxima are represented by dots. c, Density plot comparing PC1 across 100 kb tiles (n = 24,026). Green dots mark tiles overlapping hyper CGIs (n = 833). d, PC1 values for tiles overlapping hyper CGIs (n = 833) do not significantly differ between ESCs and TSCs (two-sided Wilcoxon rank-sum test, P = 0.2893). Lines denote the median, edges denote the IQR, whiskers denote 1.5× IQR and minima/maxima are represented by dots. e, Fraction of hyper CGIs in A and B compartments do not significantly differ between ESCs and TSCs (two-sided chi-squared test, P = 0.2063). f, Genome browser tracks of the Prdm12 locus. In ESCs, unmethylated CGIs are enriched for H3K4me3 as well as for repressive H3K27me3 and H2AK119ub1. In TSCs, CGI methylation increases while H3K4me3 decreases. H3K27me3 spreads further into the flanking regions but remains enriched over CGIs. g, Density plots comparing DNA methylation (delta) and histone modifications (log2 fold change) in TSCs compared with ESCs (1 kb tiles, n = 3 merged biological replicates for each cell type). Globally, TSCs lose genome-wide methylation and gain H3K27me3. In contrast, tiles overlapping hyper CGIs show further H3K27me3 enrichment. Although TSCs tend to subtly increase global H3K4me3 signal, hyper CGIs demonstrate a clear loss. The global enrichment for H3K4me3 appears to correspond to differential retrotransposon regulation (see Extended Data Fig. 3g).
Fig. 3
Fig. 3. TSC chromatin is dually modified by H3K27me3 and DNA methylation at equilibrium.
a, Metaplots and corresponding per-locus heat maps of EED (ChIP–seq), H3K27me3 (ChIP–BS-seq) and DNA methylation (ChIP–BS-seq) for hyper CGIs. ESCs display the expected inverse correlation between DNA methylation and H3K27me3, which is consistent with local enrichment of EED over these CGIs. TSCs also show local enrichment of EED over CGIs, but the canonical relationship between H3K27me3 and DNA methylation is lost and these modifications co-occupy the same loci. TSC ChIP signal is somewhat diminished in comparison with ESCs, probably due to increased global enrichment for this enzyme and its associated modification throughout the TSC genome. b, Genome browser track of the Wnt1 locus in ESCs and TSCs for EED and H3K27me3 (as measured by ChIP–BS-seq) enrichment alongside DNA methylation as measured by WGBS and ChIP–BS-seq. Average read-level methylation is expanded for ChIP-BS-seq data below the summary track (only the first 20 rows are shown, reads must have three or more CpGs to be included). Read-level analysis confirms that the diffuse, high entropy nature of DNA methylation in TSCs occurs within H3K27me3-modified nucleosomes. c, Scatter plot comparing the average methylation level of hyper CGIs as measured by WGBS and ChIP–BS-seq, coloured by the average H3K27me3 ChIP–BS-seq signal. WGBS includes no enrichment step and acts effectively as background; its high correlation with ChIP–BS-seq supports a model where intermediate DNA methylation in TSCs co-exists with H3K27me3 nucleosomes at equilibrium.
Fig. 4
Fig. 4. Intermediate methylation in TSCs depends on opposing DNMT3B and Polycomb activity.
a, Epigenetic repression in embryonic cells. DNMT3A/B deposits DNA methylation whereas TET enzymes promote its removal. PRC 1 and 2 shield developmental gene promoters and recruit each other through their respective modifications. b, Feature-level DNA methylation (1 kb HMDs/PMD tiles, CGIs and hyper CGIs, n = 904,532, 853,972, 14,790 and 1,030, respectively, single biological replicate per condition). Lines denote the median, edges the IQR and whiskers either 1.5× IQR or minima/maxima (if no point exceeds 1.5× IQR); minima/maxima are indicated by the violin plot range. c, Genome browser tracks of the Tbx2 locus. Dnmt3b KO loses methylation, while PRC KOs gain methylation up to 100%. Regions marked by strong H3K4me3 signal are kept constitutively free while regions with low H3K4me3 remain unmethylated in Kdm2b KO. d, CpG-wise comparison of WT and KO TSCs (single biological replicate per condition). Barplots indicate the fraction of CpGs that change by >|0.2| compared with WT. e, Density plots comparing DNA methylation (delta) and H3K27me3 (log2 fold change) at 1 kb tile resolution between KO and WT TSCs (n = 3 merged biological replicates for MINUTE-ChIP data, single biological replicate for WGBS, also applies to f and g). Eed KO loses H3K27me3 accompanied by strong DNA methylation gains. f, Scatter plot comparing PRC hyper CGIs (n = 3,849) in Eed KO and Kdm2b KO with respect to WT. Points are coloured by H3K4me3 level in Kdm2b KO (log2-transformed). PRC2 hyper CGIs with high H3K4me3 levels in Kdm2b KO remain unmethylated but gain methylation in Eed KO. g, Metaplots showing the average histone modification enrichment and DNA methylation for WT and KO TSCs at PRC hyper CGIs (respective heat maps are shown in Extended Data Fig. 6c). MINUTE-ChIP enrichment can be quantitatively compared within the same batch (Dnmt3b KO and PRC KOs have separate WT controls, see Methods). Dnmt3b KO exhibits mild H3K27me3 and H2AK119ub1 gain, while both H3K27me3 and H2AK119ub1 are reduced in Rnf2 KO. Eed KO loses all H3K27me3 signal. Enrichment scales are distinct for H3K4me3 (green, left axis) and H3K27me3 or H2AK119ub1 (black, right axis).
Fig. 5
Fig. 5. The TSC epigenome can be reversibly driven to extreme DNA methylation levels.
a, DNMT1i treatment and recovery as measured by RRBS (untreated control measured by WGBS, single biological replicates). Genome-wide methylation drops drastically during the first 3 days and recovers most of the original methylation within one week of withdrawal (n = 117,477 and 62,118 1-kb tiles in HMDs and PMDs, respectively). Hyper CGIs (n = 970) show similar trends, although re-methylation efficiency is slightly lower. Lines denote the median, edges denote the IQR and whiskers denote either 1.5× IQR or minima/maxima (if no point exceeded 1.5× IQR; outliers were omitted). b, EZH2 inhibitor (EZH2i) treatment and recovery time series as measured by RRBS (untreated control measured by WGBS, single biological replicates). Left: genome-wide and CGI methylation rise to extremely high levels after 4 weeks (n = 116,056 and 62,434 1-kb tiles in HMDs and PMDs, respectively, and n = 960 hyper CGIs). The effect is progressively reversed following a 4 week washout period. Right: independent experiment that demonstrates accelerated recovery of steady-state methylation levels by pulse DNMT1i treatment. Lines denote the median, edges denote the IQR and whiskers denote either 1.5× IQR or minima/maxima (if no point exceeded 1.5× IQR; outliers were omitted). c, Top: western blot for H3K27me3 in untreated TSCs, TSCs treated with EZH2i for 5 weeks and weekly recovery timepoints. Bottom: MINUTE-ChIP correlation between untreated and post-recovery TSCs, measured in 1 kb tiles (log2 fold change over input) demonstrate the reversibility of the TSC epigenome. d, Co-IP of EED and core components of PRC1/2, DNMT3B and Tubulin (negative control) in WT TSCs. EED directly interacts with other components of PRC2 as well as DNMT3B, but not with components of PRC1. e, Enrichment and statistical significance of EED interactions within TSCs as measured by MS following IP (WT TSCs were compared with Eed KO to eliminate noise, two-sided Student’s t-test, P values adjusted for multiple testing correction using FDR). EZH2 is plotted twice because of the recovery of two distinguishable isoforms, Q61188;D3Z774 and Q6AXH7, respectively. Source data
Fig. 6
Fig. 6. Transcriptional response to epigenetic inhibitors.
a, Brightfield images of control and inhibitor treated TSCs. Top right: cell counts over 7 days of treatment (n = 3 biological replicates from independent experiments per condition, error bar reflects standard deviation). TSCs tolerate either DNMT1i or EZH2i, but dual inhibition has severe effects on morphology and proliferation (scale bar, 50 µm). b, Overlap of up- and downregulated genes between DNMT1i, EZH2i and combined treatment with select GO term enrichments for each gene set (piRNA, PIWI-interacting RNA). Notably, combined treatment significantly downregulates a large set of genes associated with cell cycle progression. A full list of top GO terms is presented in Extended Data Fig. 9a. c, Heat map visualizing gene expression (log2-transformed TPM) associated with regulation of mitotic cell division in DMSO-, DNMT1i-, EZH2i- and double inhibitor-treated cells. Treatment with both inhibitors leads to significantly reduced expression of these genes (only differentially expressed genes are shown). The effect is milder in single inhibitor treatments. d, Heat map and box plots of differentially expressed genes during DNMT1i (left) and long-term EZH2i (right) treatment including recovery timepoints (number of genes indicated in the figure, differentially expressed genes are identical to those in Fig. 5b). In both cases, the transcriptional response is largely reversible following inhibitor washout. Lines denote the median, edges denote the IQR and whiskers denote either 1.5× IQR or minima/maxima (if no point exceeded 1.5× IQR; outliers were omitted). e, Simplified model of DNA methylation and PRC2 dynamics in somatic cells compared with the dynamic epigenome found in TSCs. Somatic cells generally regulate genetic loci in a bistable fashion, preserving an overall highly methylated genome and unmethylated CGIs that are protected from DNMT3’s by PRC2. In TSCs, the genome shifts to an overall intermediate, seemingly metastable methylation state, which co-occurs with PRC2-deposited H3K27me3. Although this state can be driven to high or low methylation levels by modulating these two inputs, this form of genome regulation is robust enough to return to the steady-state levels even after long spans of inhibition.
Extended Data Fig. 1
Extended Data Fig. 1. The intermediate methylome is stable and consistent across multiple TSC lines.
a) Genome browser tracks displaying CpG methylation for additional TSC lines. All lines exhibit a global decrease of methylation with select hypermethylation of CGIs to intermediate levels. b) Overrepresentation analysis of genes with hypermethylated CGI promoters in the ExE. Genes are enriched in developmental processes. c) Distribution of the distances to the nearest TSS for all CGIs and CGIs hypermethylated in the ExE. d) Genetic sex determination of wild type TSC lines 1-4 by simplex PCR. Primers differentiate X and Y chromosome homologues of the Rbm31 gene. Rbm31x has an 84 bp deletion in comparison to Rbm31y. Amplicon size: Rbm31x = 269 bp, Rbm31y = 353 bp. e) Violin plots of average HMD, PMD and hyper CGI methylation (n = 959,249, 954,783 and 1,102 features respectively) in epiblast, ExE and all TSC lines (single biological replicates for TSCs, two merged biological replicates for epiblast and ExE). White dots denote the median, edges denote the IQR and whiskers denote either 1.5 × IQR or minima/maxima (if no point exceeded 1.5 × IQR; minima/maxima are indicated by the violin plot range). f) Scatterplot showing the relationship between mean methylation entropy and mean CpG methylation at hypermethylated CGIs in epiblast, ExE and all TSC lines. CGIs are unmethylated in epiblast, which is associated with low entropy. Both ExE and TSC lines exhibit mostly intermediate methylation levels and high entropy (ExE shows comparatively lower intermediate methylation compared to TSCs). Source data
Extended Data Fig. 2
Extended Data Fig. 2. Single cell sorted clones re-gain bulk methylation levels and patterns.
a) Gating strategy for sorting single TSC and ESC clones. FSC-A/SSC-A was used to determine live cells, followed by FSC-A/FSC-W gating for single cells (1 cell/well of a 96 well plate). b) HMD and PMD violin plots (1 kb tiles, n = 99,654 and 51,479 tiles respectively) for single sorted clones. Lines denote the median, edges the IQR and whiskers either 1.5 × IQR or minima/maxima (if no point exceeded 1.5 × IQR; minima/maxima are indicated by the violin plot range). c) 4-mer methylation (n = 21,952) in hypermethylated CGIs for single cell-derived subclones (matching entropy boxplots in Fig. 1d). Subclones from the same cell type have similar methylation levels (low for ESCs, intermediate for TSCs), and resemble in silico generated averages. Lines denote the median, edges the IQR and whiskers either 1.5 × IQR or minima/maxima (if no point exceeded 1.5 × IQR; outliers were omitted). d) CpG-wise comparison of WGBS and Nanopore methylation calls in the same TSC line (single biological replicates, ≥ 10x coverage in both). e) Relationship between CGI pair distance and the fraction of concordantly methylated reads (hypermethylated CGI pairs captured ≥10x). A read is termed concordant if paired CGIs both have methylation levels above or below their unphased averages. Hoxa locus CGI pairs (Fig. 1e) marked in red. The fraction of concordant reads does not appear to depend on distance between CGIs. f) Average HMD, PMD and hyper CGI methylation (n = 274,371, 135,801 and 713 features respectively) values in epiblast, ExE and later placental tissues (E15, E18, two merged biological replicates for epiblast/ExE, six biological replicates for placental tissues). White dots denote the median, edges the IQR and whiskers either 1.5 × IQR or minima/maxima (if no point exceeded 1.5 × IQR; minima/maxima are indicated by the violin plot range). Data from Ref. .
Extended Data Fig. 3
Extended Data Fig. 3. H3K27me3 is globally enriched in TSCs compared to ESCs.
a) Compartments as defined by Hi-C (PC1 eigenvector, A > 0, B < 0) comparing ESCs and TSCs for the first five chromosomes. Few regions switch compartments and the overall distributions are highly comparable. b) Hi-C contact frequencies for ESCs and TSCs for chromosome 1 (100 kb bins), used to generate the comparative heatmap in Fig. 2a (two merged technical replicates per cell type). c) Comparison of contact frequencies across genomic distances between ESCs and TSCs. TSCs show an increase in very long-range contacts, but the effect is very small and imprecise. d) Density plots comparing DNA methylation and histone modification levels in one kb genomic tiles as measured using quantitative MINUTE-ChIP (log2 fold change over input, n = three merged biological replicates per cell type). TSC epigenomes are characterized by lower DNA methylation and higher K27me3. e) Western blot showing an increase of H3K27me3 in TSCs compared to ESCs. f) log2 fold change of modified histone tails measured by mass spectrometry (n = three TSC biological replicates normalized against the mean of two biological ESC replicates). Histone tails carrying H3K27me3 are enriched in TSCs compared to ESCs, whereas unmodified K27 residues are depleted. g) Heatmaps of DNA methylation and histone signal across different genomic features for ESCs and TSCs. TSCs exhibit higher H3K27me3 levels across all feature groups including flanking genomic regions. ESCs show a higher H3K4me3 signal at protein-coding promoters. In contrast, TSCs show an increase of this active modification at full length IAP elements, which is accompanied by an increase in their expression (bottom right). Notably, H3K27me3 also appears to have specific enrichment at the promoters of these elements in TSCs, whereas H2AK119ub1 is present in both cell types. H2AK119ub1 levels appear to be increased in ESCs at CGIs and promoters. Source data
Extended Data Fig. 4
Extended Data Fig. 4. Intermediate DNA methylation and H3K27me3 co-occupy TSC chromatin.
a) CpG-wise comparison of ESCs and TSCs profiled with WGBS and ChIP-BS-seq (n = two merged biological replicates for ChIP-BS-seq and single biological replicates for WGBS). b) Violin plots showing the methylation average of hyper CGIs in ESCs and TSCs as profiled by WGBS and ChIP-BS-seq. The high similarity between WGBS (unenriched background) and ChIP-BS-seq indicates that H3K27me3-modified nucleosomes carry intermediately methylated DNA as a steady state (n = 939 CGIs). White dots denote the median, edges denote the IQR and whiskers denote either 1.5 × IQR or minima/maxima (if no point exceeded 1.5 × IQR; minima/maxima are indicated by the violin plot range). c) Genome browser track of the Wnt1 locus in ESCs and TSCs showing EED localization and H3K27me3 (measured by ChIP-BS-seq) together with DNA methylation measured by WGBS and ChIP-BS-seq. Average methylation of single reads spanning at least three CpGs was visualized for WGBS using IGV (only the first 20 rows are shown). Read-level data expanded for the WGBS samples as a point of comparison for Fig. 3b. d) Gating strategy for selecting transfected clones for the TSC knockout lines. First, cells were gated according to the left panels to enrich for viable single cells, followed by sorting for GFP+ cells. WT TSCs were transfected with corresponding sgRNA/Cas9 plasmids expressing GFP. WT TSCs were used as negative control to set the GFP+ gate.
Extended Data Fig. 5
Extended Data Fig. 5. Epigenome-wide shifts following the loss of epigenetic regulators.
a) Verification of the knockout strategy shown by read coverage of WGBS samples. b) Change in methylation for different knockout lines compared to wild type TSCs (left: TSC1, right: matching parental line, single biological replicates). c) CpG-wise density plot comparing Tet3 KO with wild type TSCs show the overall similarity of these methylation landscapes (single biological replicates). d) 5-mC and 5-hmC levels as measured by Mass Spectrometry and normalized to thymidine, shown for ESCs as well as wild type, Dnmt3b KO and Tet3 KO TSCs (n = two independent biological samples, three technical replicates were conducted for each sample and averaged). These results confirm lower levels of both modifications in TSCs compared to ESCs, as well as the dependence of 5-mC on DNMT3B and 5-hmC on TET3. Overall, 5-hmC levels are lower in TSCs in comparison to ESCs even when accounting for lower global methylation levels in general (ratio of 5-hmC/5-mC = 8.7% in ESCs, 2.8% in TSCs). e) CpG-wise density plots comparing Polycomb (PRC) knockout TSCs. Eed KO triggers extreme genome-wide hypermethylation that is more pronounced compared to KOs of core or auxiliary PRC1 subunits (single biological replicates). f) Western blot showing H3K27me3 and H2AK119ub1 in WT and KO TSCs. g) Density plots depicting the relationship between DNA methylation (delta, single biological replicates) and either H2AK119ub1 or H3K4me3 (log2 fold change, three merged biological replicates) as they change between KO and WT TSCS (data is at one kb tile resolution). h) Log2 fold change for each histone modification in all TSC KOs compared to WT (n = 1,700,932 one kb tiles, three merged biological replicates). White dots denote the median, edges the IQR and whiskers either 1.5 × IQR or minima/maxima (if no point exceeded 1.5 × IQR; minima/maxima are indicated by the violin plot range). Source data
Extended Data Fig. 6
Extended Data Fig. 6. H3K4me3 shields CGIs from extreme hypermethylation.
a) Density plots comparing MINUTE-ChIP signal per one kb tile between WT and KO TSCs (log2 fold change over input, three merged biological replicates). b) Top: Overlap of CGIs hypermethylated in any PRC KO line (difference to WT > 0.2). Kdm2b KO cells show a diminished effect on CGI methylation in comparison to core regulators. Bottom: Mean methylation of the union of hypermethylated CGIs found in any of our PRC KOs (PRC hypermethylated CGIs, n = 3,967). White dots denote the median, edges the IQR and whiskers either 1.5 × IQR or minima/maxima (if no point exceeded 1.5 × IQR; minima/maxima are indicated by the violin plot range). c) Heatmaps of the histone modification and DNA methylation signal at CGIs hypermethylated in PRC KOs (matching the combined metaplots in Fig. 3h). Histone modifications are quantitatively comparable as measured by MINUTE-ChIP within the same batch (Dnmt3b KO and PRC KOs were sequenced in two different batches and therefore each have a separate WT control, see Methods). d) Pairwise scatterplot comparing average delta methylation between PRC KOs with respect to the WT for PRC hypermethylated CGIs. Points are colored by H3K4me3 level in Eed KO (left and right) or Rnf2 KO (mid) (log2-transformed). e) Scatterplot comparing mean methylation and H3K4me3 for PRC hypermethylated CGIs (samples all measured within the same MINUTE-ChIP batch). Histograms show the enrichment of CGIs for DNA methylation (x axis) and H3K4me3 (y axis), respectively. Color represents the average H3K27me3 signal per line (log2-transformed). DNA methylation increases from Kdm2b KO to Eed KO while H3K4me3 signal drops.
Extended Data Fig. 7
Extended Data Fig. 7. Differences between zygotic knockouts in vivo and acute knockouts in TSCs.
a) Feature-level violin plots for TSC and zygotic knockouts (n = 939,938 and 913,380 one kb tiles in HMDs and PMDs, n = 14,698 and 1,054 CGIs and hyper CGIs, two merged biological replicates for epiblast/ExE samples, single biological replicates otherwise). White dots denote the median, edges the IQR and whiskers either 1.5 × IQR or minima/maxima (if no point exceeded 1.5 × IQR; minima/maxima are indicated by the violin plot range). Data taken from Ref. 67. b) Genome browser track of the Pax7 locus. c) Feature-level mean methylation across DMSO controls (RRBS time course in Fig. 5a, n = 117,477 and 62,118 one kb tiles in HMDs and PMDs, 970 hyper CGIs, single biological replicates). Lines denote the median, edges the IQR and whiskers either 1.5 × IQR or minima/maxima (if no point exceeded 1.5 × IQR; outliers omitted). d) CpG-wise density plot of DNMT1i-treated TSCs (left) and following withdrawal (right, single biological replicates compared to WT, WGBS). e) Feature-level methylation changes after DNMT1i treatment or withdrawal (WGBS, features methylated > 0.2 in control were considered, single biological replicates, n = features). Lines denote the median, edges the IQR and whiskers either 1.5 × IQR or minima/maxima (if no point exceeded 1.5 × IQR; outliers omitted). f) Different TSC lines and passages show reproducible DNMT1i responses, highlighting the stability of this landscape over extended culture (feature n as in Extended Data Fig. 7c, single biological replicates). g) Methylation ratios between DNMT1i treatment or recovery (features methylated > 0.2 in DMSO control, n = 93,393 - 95,472 and 57,789 - 58,796 one kb tiles in HMDs and PMDs, 746 - 890 hyper CGIs, single biological replicates). Lines denote the median, edges the IQR and whiskers either 1.5 × IQR or minima/maxima (if no point exceeded 1.5 × IQR; outliers omitted).
Extended Data Fig. 8
Extended Data Fig. 8. Dynamic interactions between PRC2 and de novo methyltransferases.
a) Feature-level methylation across DMSO controls collected for Fig. 5b (n = 116,056 and 62,434 one kb tiles in HMDs and PMDs, 960 hyper CGIs, single biological replicates). X-axis breaks indicate different experiments (EZH2i treatment and DNMT1i pulse treatment). Lines denote the median, edges the IQR and whiskers either 1.5 × IQR or minima/maxima (if no point exceeded 1.5 × IQR; outliers were omitted). b) MINUTE-ChIP signal heatmaps for EZH2i-recovery and control TSCs (log2 fold change over input). Data is for PRC hypermethylated CGIS (see Extended Data Fig. 6b). H3K27me3 is fully regained after extensive periods of PRC2 inhibition. c) EED Co-IP of EZH2i-treated TSCs. EED is slightly downregulated and preserves interactions with core PRC2 components. Input lanes for the EED blot are taken from the same blot but shown for a higher exposure time given the intensity of the IP lanes. d) Representative genome browser tracks showing EED localization in ~five week EZH2i-treated and control TSCs. Regions with strong EED enrichment maintain signal after EZH2i treatment whereas regions with low enrichment are generally depleted. e) EED signal heatmaps (ChIP-seq) in WT and EZH2i-treated TSCs, centered at EED peaks that overlap CGIs. DNA methylation in WT and Eed KO TSCs are also included. f) Methylation of inhibitor-insensitive and -sensitive EED peaks in WT and Eed KO TSCs (WGBS) as well as for our EZH2i experiments (RRBS, n = 2,868 inhibitor-sensitive and 2,202 -insensitive peaks). White dots denote the median, edges the IQR and whiskers either 1.5 × IQR or minima/maxima (if no point exceeded 1.5 × IQR; minima/maxima are indicated by the violin plot range). g) Co-IP of EED in WT ESCs. EED directly interacts with other components of PRC2 as well as DNMT3B, but not with PRC1 components. h) Overlap of significant EED interaction partners between ESCs and TSCs as determined by IP-MS. i) GO terms for significant EED interaction partners within ESCs and TSCs as determined by IP-MS. Source data
Extended Data Fig. 9
Extended Data Fig. 9. Distinct transcriptional responses follow treatment with epigenetic inhibitors.
a) Overrepresented GO terms of biological processes for differentially up- or down-regulated gene sets following single and dual inhibitor treatments. Genes up-regulated upon DNMT1i treatment are enriched in germline-associated processes while genes up-regulated upon loss of H3K27me3 are associated with morphogenesis. Treatment with both inhibitors leads to a discrete response affecting genes involved in cell cycle regulation and chromosome segregation. b) Clustering of knockout, wild type and inhibitor samples based on their RNA-seq profiles (see Methods). c) Distribution of log2-transformed TPMs for specific gene sets (differentially expressed genes in our seven day inhibitor treatments or genes associated with hypermethylated CGIs, number of genes indicated in figure panel). Eed KO mimics the transcriptional response to the EZH2i treatment, as do our PRC1 knockouts. Loss of either or both repressive pathways does not lead to expression of genes associated with hypermethylated CGIs, although a subtle upward trend can be observed after double treatment. Lines denote the median, edges denote the IQR and whiskers denote either 1.5 × IQR and minima/maxima are represented by dots. d) Heatmaps of MINUTE-ChIP signal and DNA methylation in WT TSCs at significantly up- or down-regulated genes after 7 days of inhibitor treatment. Genes up-regulated after treatment with DNMT1i are mostly methylated in TSCs and become expressed after inhibitor-triggered loss of methylation. In contrast, neither EZH2i nor dual inhibitor treatment seem to affect the expression of genes with hypermethylated promoter CGIs. EZH2i sensitive genes show no substantial enrichment for H3K27me3, H2AK119ub1 or DNA methylation and therefore may be more indicative of indirect responses.
Extended Data Fig. 10
Extended Data Fig. 10. Examining the effects of disrupted epigenetic regulation on placental gene expression.
a) Heatmap of log2-transformed TPMs for marker gene sets specific to different placental cell types, including those associated with early progenitor states (trophoblast stem cells, the ExE and early chorion), as well as for the labyrinth, junctional and giant trophoblast lineages. Marker panels are collected from selected references and include those for the entire prolactin cluster and genes with shared gametogenic and placental functions83–89. Very minimal transcriptional changes are observed across these sets, other than slight downregulation of progenitor markers and upregulation of giant cell markers when both DNA and PRC2 functions are dually inhibited. These signatures could easily be explained by low level spontaneous differentiation induced alongside rapid cell cycle arrest. b) Boxplot of log2-transformed TPMs for marker gene sets that exhibit subtle but notable dynamics, including those for progenitor, trophoblast giant cell and prolactin genes (number of genes indicated in figure panel). Lines denote the median, edges denote the IQR and whiskers denote 1.5 × IQR and minima/maxima are represented by dots.

References

    1. Bird, A. P. CpG-rich islands and the function of DNA methylation. Nature321, 209–213 (1986). - PubMed
    1. Smith, Z. D. & Meissner, A. DNA methylation: roles in mammalian development. Nat. Rev. Genet14, 204–220 (2013). - PubMed
    1. Mattei, A. L., Bailly, N. & Meissner, A. DNA methylation: a historical perspective. Trends Genet38, 676–707 (2022). - PubMed
    1. de Napoles, M. et al. Polycomb group proteins Ring1A/B link ubiquitylation of histone H2A to heritable gene silencing and X inactivation. Dev. Cell7, 663–676 (2004). - PubMed
    1. Wang, H. et al. Role of histone H2A ubiquitination in Polycomb silencing. Nature431, 873–878 (2004). - PubMed

Publication types