. 2023 Apr;5(4):660-676.
doi: 10.1038/s42255-023-00781-3. Epub 2023 Apr 6.

The GAPDH redox switch safeguards reductive capacity and enables survival of stressed tumour cells

Affiliations

The GAPDH redox switch safeguards reductive capacity and enables survival of stressed tumour cells

Deepti Talwar et al. Nat Metab. 2023 Apr.

Abstract

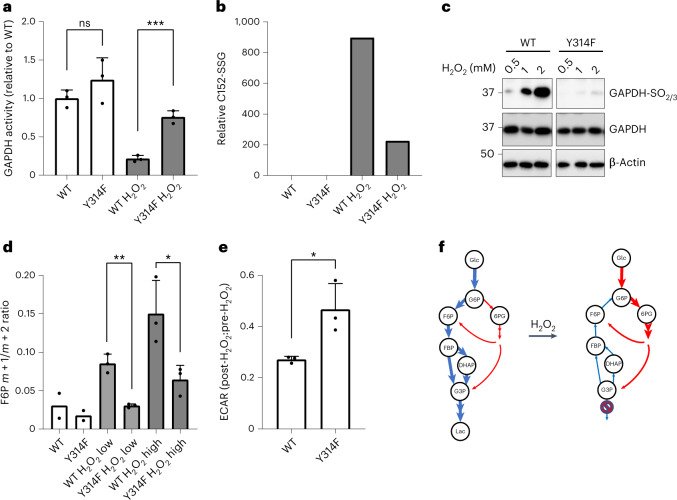
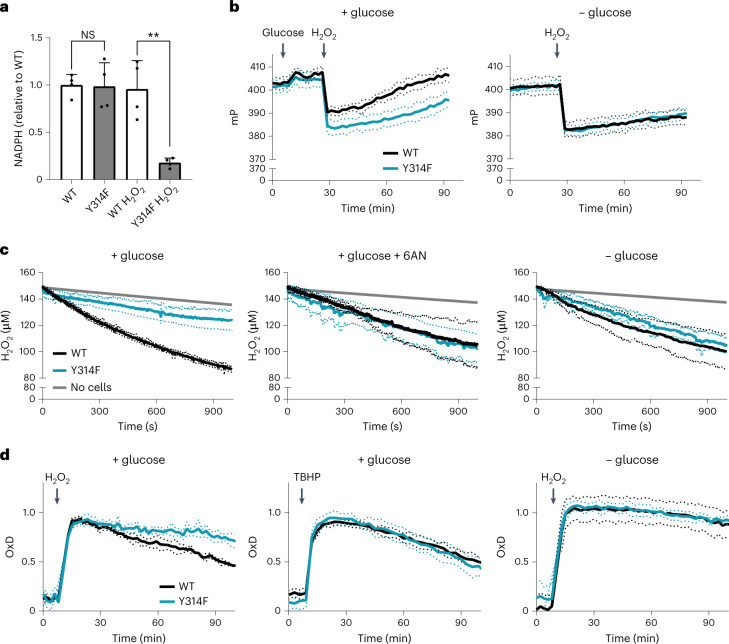
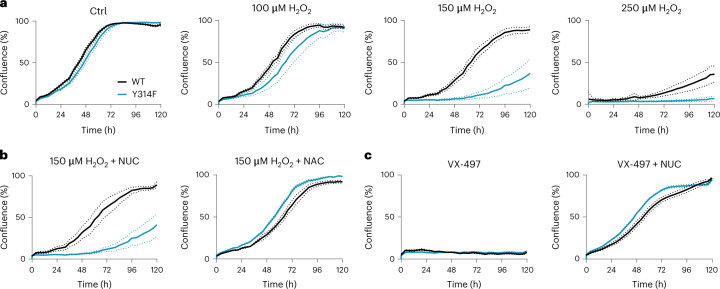
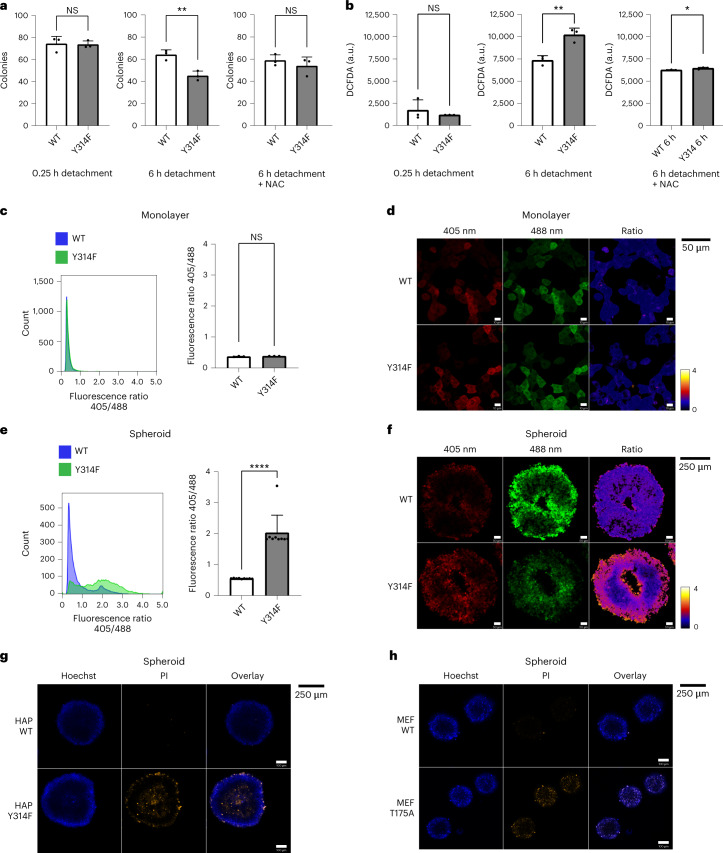
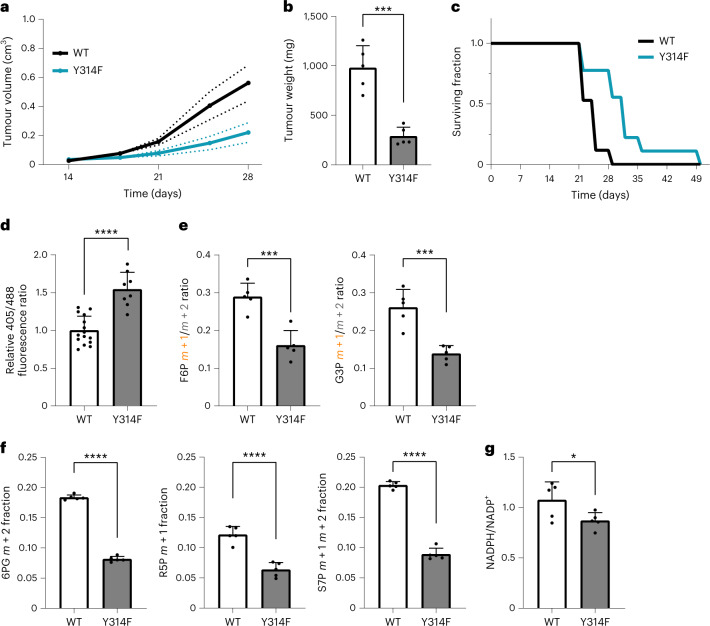
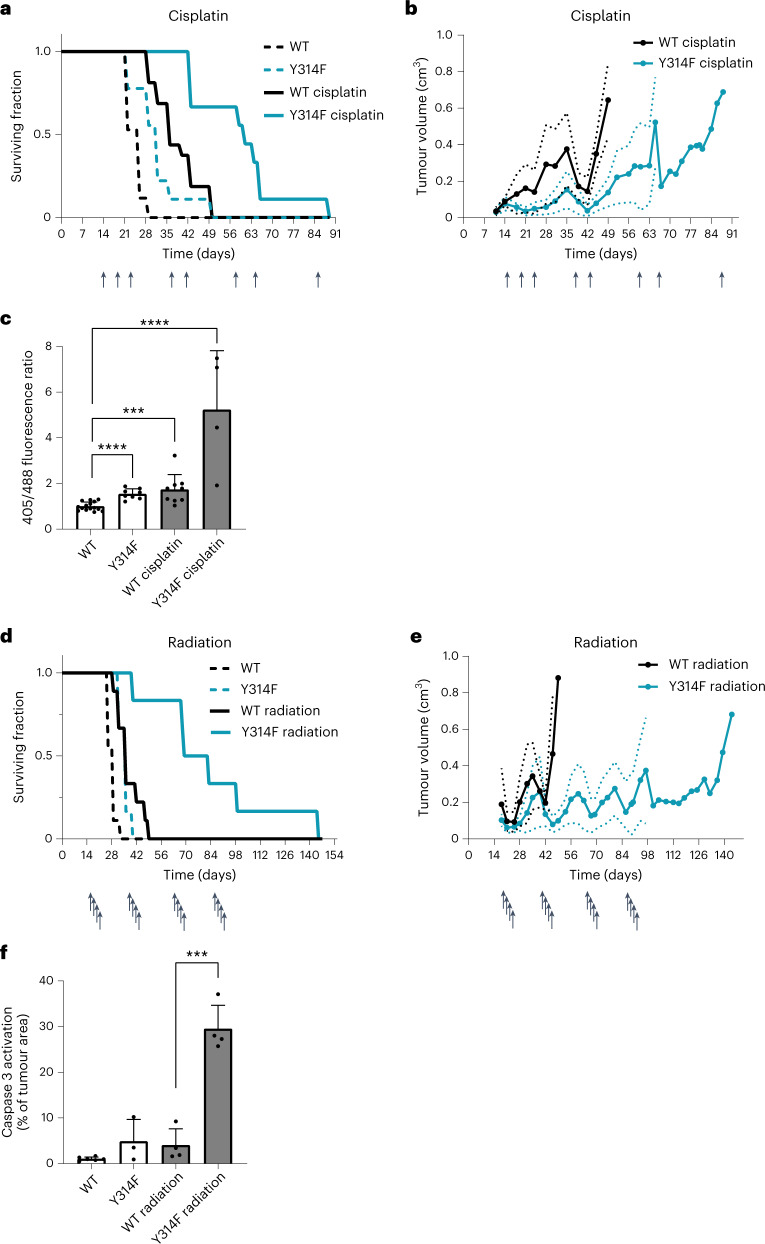
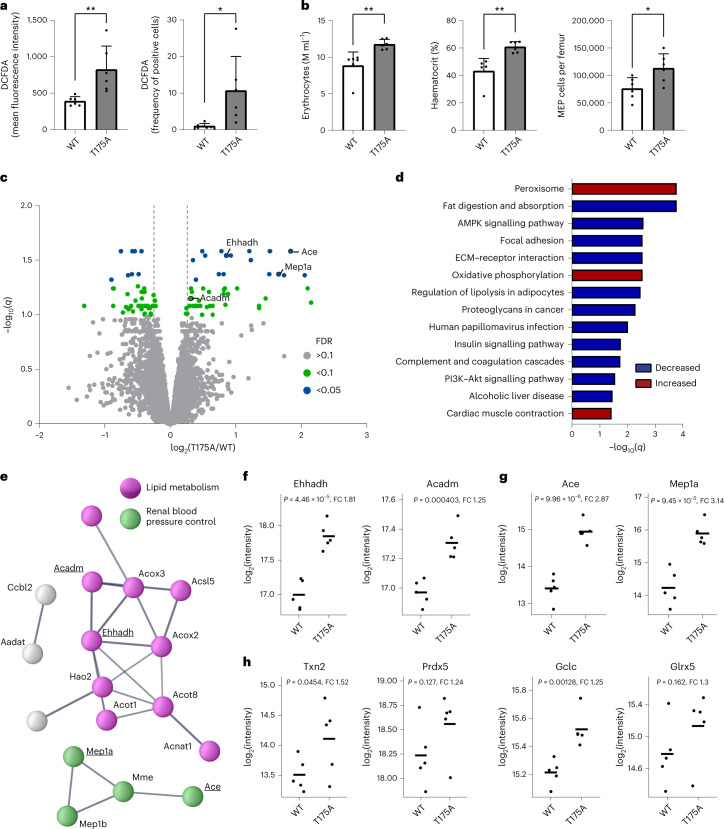
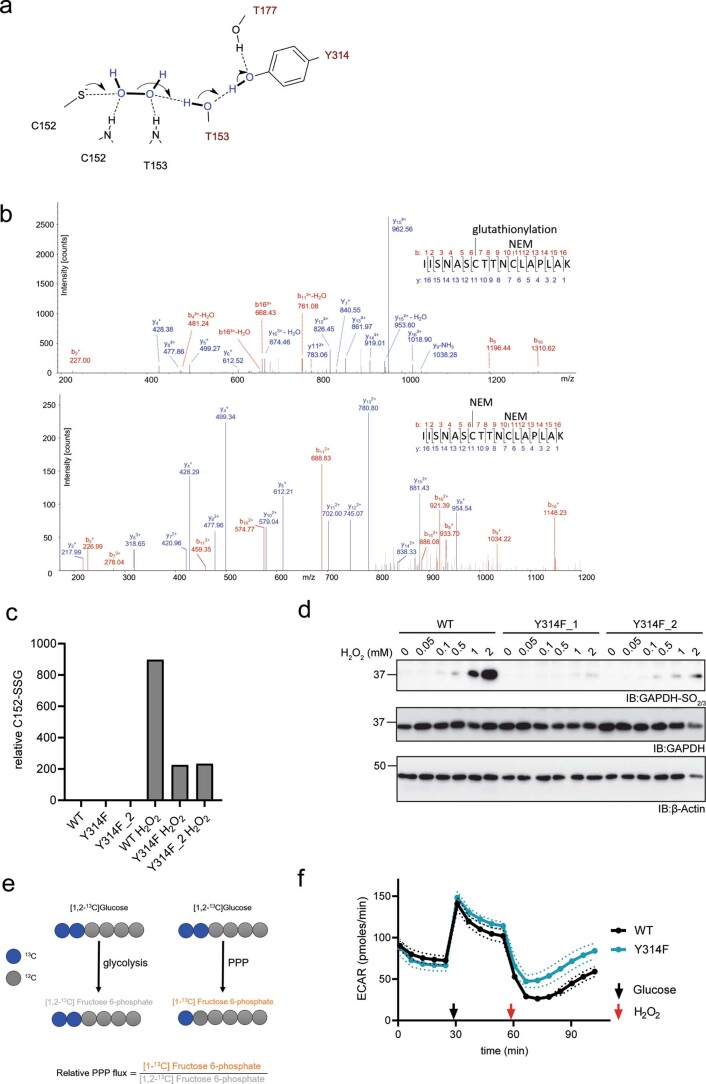
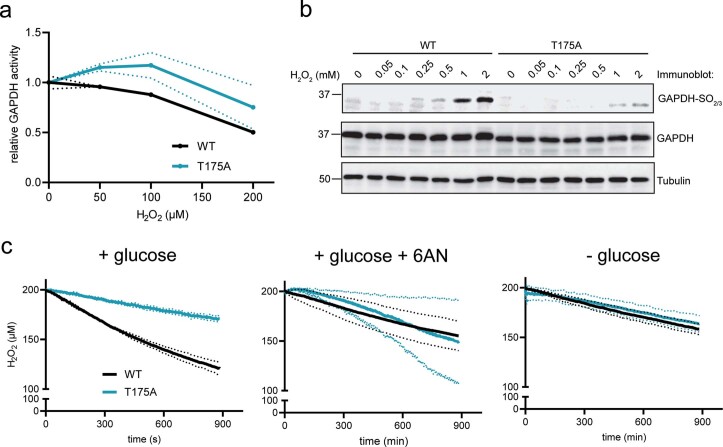
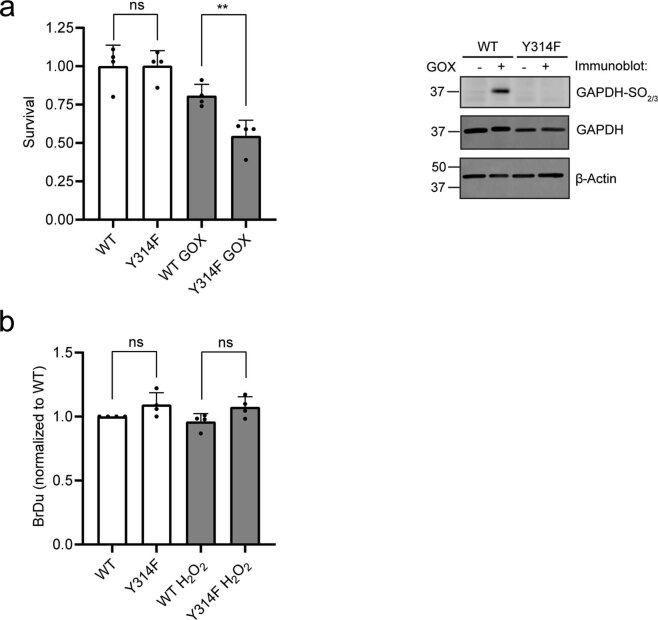
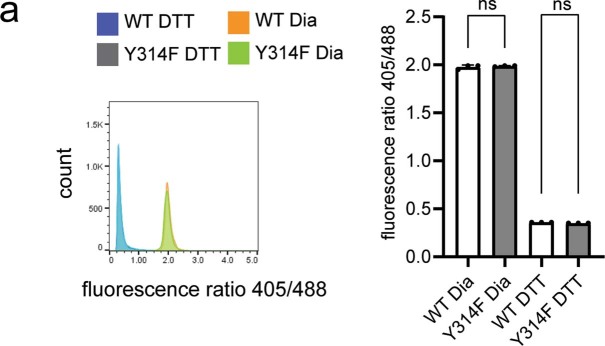
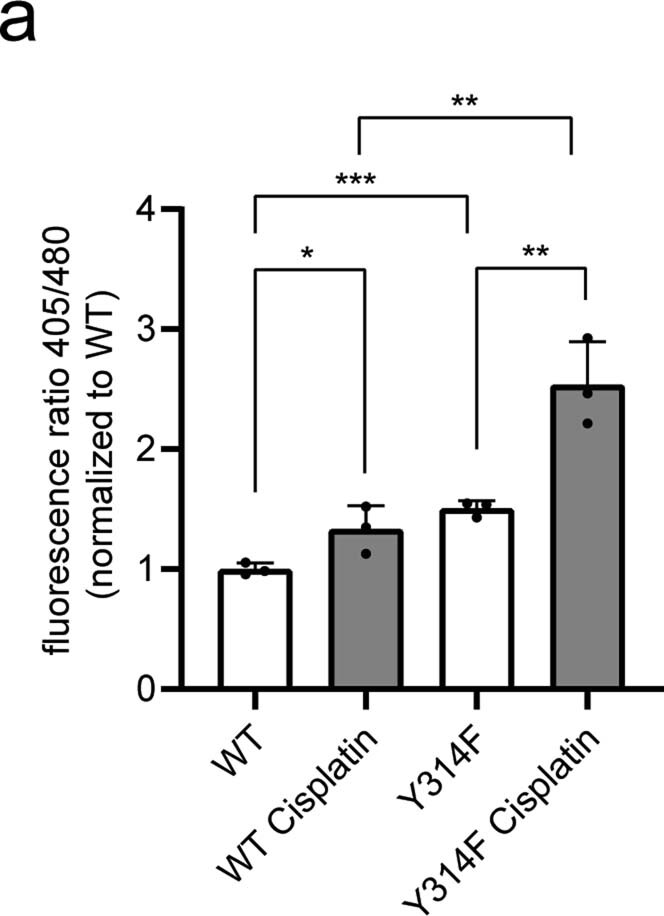
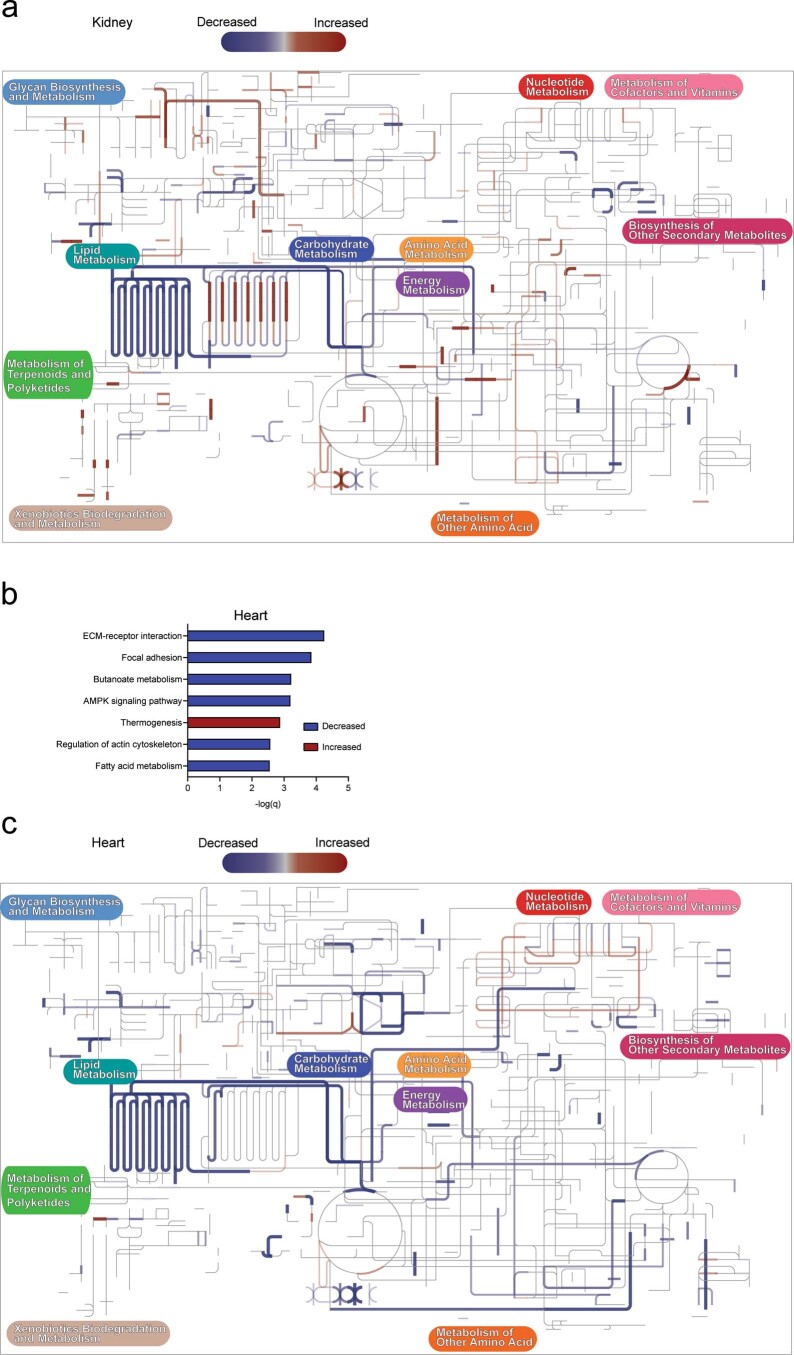
Glyceraldehyde 3-phosphate dehydrogenase (GAPDH) is known to contain an active-site cysteine residue undergoing oxidation in response to hydrogen peroxide, leading to rapid inactivation of the enzyme. Here we show that human and mouse cells expressing a GAPDH mutant lacking this redox switch retain catalytic activity but are unable to stimulate the oxidative pentose phosphate pathway and enhance their reductive capacity. Specifically, we find that anchorage-independent growth of cells and spheroids is limited by an elevation of endogenous peroxide levels and is largely dependent on a functional GAPDH redox switch. Likewise, tumour growth in vivo is limited by peroxide stress and suppressed when the GAPDH redox switch is disabled in tumour cells. The induction of additional intratumoural oxidative stress by chemo- or radiotherapy synergized with the deactivation of the GAPDH redox switch. Mice lacking the GAPDH redox switch exhibit altered fatty acid metabolism in kidney and heart, apparently in compensation for the lack of the redox switch. Together, our findings demonstrate the physiological and pathophysiological relevance of oxidative GAPDH inactivation in mammals.


Conflict of interest statement

The authors declare no competing interests.

Figures

Fig. 1
Fig. 1. The glycolysis‒oxPPP switch depends on GAPDH oxidation.
a, GAPDH activity as measured in the lysate of HAP1 cells expressing either WT or mutant (Y314F) GAPDH, and following treatment of intact cells with 100 µM H2O2 for 5 min. Activity values are normalized relative to untreated WT cells. Data are presented as mean ± standard deviation (s.d.), based on n = 3 biological replicates with n = 3 technical replicates each. NS, non-significant; ***P < 0.001; P = 0.2413 and 0.0005, based on a two-tailed unpaired t-test. b, Glutathionylation of GAPDH Cys-152 in WT and mutant cells, before and after treatment of intact cells with 50 µM H2O2 for 5 min, as determined by LC–MS/MS analysis. Bars represent the mean of n = 3 technical replicates. c, Hyperoxidation (sulfinylation and/or sulfonylation) of GAPDH Cys-152 as visualized by immunoblotting before and after treatment of intact cells with up to 2 mM H2O2 for 5 min. Representative of n = 3 independent experiments. d, Partitioning of [1,2-13C]glucose flux into glycolysis and PPP, as determined by the isotopic signature of F6P. WT and mutant cells were left untreated, or treated with either 10 µM (low) or 50 µM (high) H2O2 for 30 s. Data are presented as mean ± s.d., based on n = 3 for H2O2 treated samples. *P < 0.05, **P < 0.01; P = 0.0016 and 0.0347, based on a two-tailed unpaired t-test. e, Change in the extracellular acidification rate (ECAR) in response to treatment of WT and mutant cells with 100 µM H2O2. Data are presented as mean ± s.d. (n = 3 biological replicates with n = 3 technical replicates each). *P < 0.05; P = 0.0291, based on a two-tailed unpaired t-test. f, Scheme depicting the rerouting of glucose flux between glycolysis and PPP in response to GAPDH oxidation. Blue arrows: glycolytic flux; red arrows: PPP flux. Please note that F6P and G3P are intermediates of both glycolysis and the PPP. Hence, GAPDH oxidation allows for the cycling of intermediates between the PPP and upper glycolysis, as indicated by reversed arrows in upper glycolysis (right). Source data
Fig. 2
Fig. 2. Oxidative GAPDH inactivation safeguards reductive capacity.
a, Relative NADPH levels as measured in the cell lysate of WT and mutant (Y314F) HAP1 cells, before and after treatment of intact cells with 100 µM H2O2 for 3 min. Bars represent the mean of n = 3 biological replicates ± standard deviation (s.d.). NS, non-significant; **P < 0.01; P = 0.9206 and 0.0022, based on a two-tailed unpaired t-test. b, NADP+-dependent G6PDH dimerization triggered by 100 µM H2O2, as measured by the fluorescence polarization response of the Apollo-NADP+ probe, in the presence (left) or absence (right) of 10 mM glucose. mP: millipolarization units. Based on the mean of n = 3 biological replicates. Dotted lines: s.d. c, Loss of extracellular H2O2 (starting concentration: 150 µM) from the cell culture supernatant as measured with an H2O2-selective electrode, in the presence (left and middle) or absence (right) of 10 mM glucose, and in the presence of 10 mM 6-aminonicotinamide (6-AN) (middle). Based on n = 3 biological replicates. Dotted lines: s.d. d, Cytoplasmic H2O2 levels in response to exogenous application of 100 µM H2O2 (left and right) or 50 µM TBHP (middle) as measured by the roGFP2-Orp1 probe, in the presence (left and middle) or absence (right) of 10 mM glucose. Based on the mean of n = 3 biological replicates with n = 3 technical replicates each. Dotted lines: s.d. Source data
Fig. 3
Fig. 3. GAPDH oxidation supports proliferation under peroxide stress.
a, Cell growth, as measured by optical imaging, of WT and mutant cells, either left untreated (left), or seeded in the presence of 100, 150 or 250 µM H2O2 (middle and right). Based on n = 5 technical replicates, representative of n = 3 biological replicates. Dotted lines: standard deviation (s.d.). b, Cell growth, as measured by optical imaging, of WT and mutant cells seeded in the presence of 150 µM H2O2, and then treated with 30 µM of nucleotide (NUC) mixture (left) or 10 mM of NAC (right). Based on n = 5 technical replicates, representative of n = 3 biological replicates. Dotted lines: s.d. c, Cell growth, as measured by optical imaging, of WT and mutant cells seeded with 5 µM of the IMPDH inhibitor merimepodib (VX-497), in the absence (left) or presence (right) of the nucleotide (NUC) mixture (30 µM). Based on n = 5 technical replicates, representative of n = 3 biological replicates. Dotted lines: s.d. Source data
Fig. 4
Fig. 4. The GAPDH switch allows cells to survive the loss of anchorage.
a, Colonies formed after seeding of 100 WT or mutant (Y314F) HAP1 cells into adherent cell culture plates. Before seeding, singularized cells were kept in ultralow-attachment plates for either 0.25 h (left), or 6 h (middle and right), in the absence (left and middle) or presence (right) of 10 mM NAC. Data are presented as mean ± standard deviation (s.d.), based on n = 3 biological replicates with n = 3 technical replicates each. NS, non-significant; **P < 0.01; P = 0.8860, 0.0059 and 0.4174, based on a two-tailed unpaired t-test. b, Relative intracellular oxidant levels as indicated by DCF fluorescence, corresponding to a. Data are presented as mean ± s.d., based on n = 3 biological replicates with n = 3 technical replicates each. NS, non-significant; *P < 0.05; **P < 0.01; P = 0.4696, 0.0057 and 0.0418, based on a two-tailed unpaired t-test. c, The roGFP2-Orp1 fluorescence ratio in WT and mutant (Y314F) HAP1 cells grown in adherent monolayer cell culture. Left: representative histogram. Right: quantitation presented as mean ± s.d. based on n = 3 biological replicates. NS, non-significant; P = 0.1583, based on a two-tailed unpaired t-test. d, Visualization of roGFP2-Orp1 in WT (top) and mutant (bottom) HAP1 cells grown in adherent monolayer culture. Fluorescence was recorded following sequential excitation at 405 nm (left) and 488 nm (middle). The fluorescence ratio image (right) was calculated pixel-by-pixel and colour-coded. Representative of n = 3 biological replicates. e, The roGFP2-Orp1 fluorescence ratio in WT and mutant (Y314F) HAP1 cells grown in non-adherent spheroid culture. Left: representative histogram. Right: quantitation presented as mean ± s.d., based on n = 9 biological replicates. ****P < 0.0001, based on a two-tailed unpaired t-test. f, Visualization of roGFP2-Orp1 in WT (top) and mutant (bottom) HAP1 cells grown in non-adherent spheroid culture. Fluorescence was recorded following sequential excitation at 405 (left) and 488 nm (middle). The fluorescence ratio image (right) was calculated pixel-by-pixel and colour-coded. Representative of n = 6 (WT) and n = 7 (Y314F) biological replicates. g, Staining of WT (top) and mutant (bottom) HAP1 spheroids with Hoechst dye (left) or PI (middle). Representative of n = 3 biological replicates. h, Staining of WT (top) and mutant (bottom) EF spheroids with Hoechst dye (left) or PI (middle). Representative of n = 3 biological replicates. Source data
Fig. 5
Fig. 5. The GAPDH redox switch protects tumour cells in vivo.
a, Growth of xenograft tumours after subcutaneous injection of HAP1 cells expressing either WT or mutant (Y314F) GAPDH. Based on n = 6 mice per group. Solid lines represent the mean, dotted lines represent the standard error of the mean. b, Weight of tumours explanted 28 days after xenografting. Data are presented as mean ± standard deviation (s.d.), based on n = 5 mice per group. ***P < 0.001; P = 0.0002, based on a two-tailed unpaired t-test. c, Survival time of tumour-bearing mice until reaching humane endpoints. Based on n = 17 (WT) and n = 9 (Y314F) mice. d, The roGFP2-Orp1 405 nm/488 nm fluorescence ratio as measured in cells isolated from explanted WT and mutant tumours. Data are presented as mean ± s.d., based on n = 15 (WT) and n = 8 (Y314F) mice. ****P < 0.0001, based on a two-tailed unpaired t-test. e, Metabolic flux analysis following tail vein injection of [1,2-13C]glucose and subsequent tumour explantation. The partitioning of glucose flux into glycolysis and PPP is indicated by the ratio of singly and doubly labelled F6P (left) and G3P (right). Data are presented as mean ± s.d, based on n = 5 mice per group. ***P < 0.001; P = 0.0007 and 0.0008, based on a two-tailed unpaired t-test. f, Metabolic flux analysis following tail vein injection of [1,2-13C]glucose and subsequent tumour explantation. The influx of [1,2-13C]glucose into the PPP is indicated by mass shifts in the PPP intermediates 6PG (left), R5P (middle) and S7P (right). Data are presented as mean ± s.d., based on n = 5 mice per group. ****P < 0.0001, based on a two-tailed unpaired t-test. g, NADPH/NADP+ ratio in WT and mutant tumours as determined by mass spectrometry. Data are presented as mean ± s.d., based on n = 5 mice per group. *P < 0.05; P = 0.0488, based on a two-tailed unpaired t-test. Source data
Fig. 6
Fig. 6. Chemo- and radiotherapy synergize with GAPDH oxidation insensitivity.
a, Survival of tumour-bearing mice in response to cisplatin treatment, based on tumour size (>1.3 cm in any dimension) as the sole endpoint. Arrows indicate timepoints of treatment. Based on n = 17 (WT), n = 9 (Y314F), n = 16 (WT cisplatin) and n = 9 (Y314F cisplatin) mice. b, Growth kinetics of tumours expressing WT or mutant GAPDH, either mock-treated or treated with cisplatin. Arrows indicate timepoints of treatment. Based on n = 16 (WT cisplatin) and n = 9 (Y314F cisplatin) mice. c, The roGFP2-Orp1 405 nm/488 nm fluorescence ratio as measured in cells isolated from explanted WT and mutant tumours, either mock-treated or treated with cisplatin. Data are presented as mean ± standard deviation (s.d.), based on n = 15 (WT), n = 8 (Y314F), n = 9 (WT cisplatin) and n = 4 (Y314F cisplatin) mice. ***P < 0.001; ****P < 0.0001; P = <0.0001, 0.0004 and <0.0001, based on a two-tailed unpaired t-test. d, Survival of tumour-bearing mice either mock-treated or treated with ionizing radiation. Arrows indicate cycles of fractionated radiation. Based on n = 9 (WT), n = 6 (Y314F), n = 9 (WT radiation) and n = 6 (Y314F radiation) mice. e, Growth kinetics of tumours expressing WT and mutant GAPDH, untreated or treated with ionizing radiation. Arrows indicate cycles of fractionated radiation. Based on n = 9 (WT radiation) and n = 6 (Y314F radiation) mice. f, Quantitation of activated Caspase 3 in slices of tumours expressing WT or mutant GAPDH, untreated or treated with ionizing radiation. Data are presented as mean ± s.d., based on n = 6 (WT), n = 3 (Y314F), n = 4 (WT radiation) and n = 4 (Y314F radiation) mice. ***P < 0.001; P = 0.0002, based on a two-tailed unpaired t-test. Source data
Fig. 7
Fig. 7. A defective GAPDH switch alters metabolism in various tissues.
a, Relative intracellular oxidant levels in erythrocytes isolated from WT and mutant (T175A) animals. DCF fluorescence (left) and frequency of DCF-positive cells (right). Data are presented as mean ± standard deviation (s.d.), based on n = 6 mice per group. *P < 0.05; **P < 0.01; P = 0.0091 and 0.0301, based on a two-tailed unpaired t-test. b, Numbers of erythrocytes per millilitre (left), haematocrit (middle) and number of MEP cells per femur (right) of WT and mutant (T175A) animals. Data are presented as mean ± s.d., based on n = 6 mice per group. *P < 0.05; **P < 0.01; P = 0.0049, 0.0016 and 0.0208, based on a two-tailed unpaired t-test. c, Proteins differentially expressed in GAPDH mutant kidneys. Grey, yellow and orange dots represent proteins with a false discovery rate (FDR) >10%, <10% and <5%, respectively. Vertical lines indicate fold change thresholds of ±1.25. Based on n = 5 mice per group. d, Gene set enrichment analysis of proteins differentially expressed in the GAPDH mutant kidney. Mapping to KEGG pathways. Blue bars: gene sets with decreased representation in mutant kidneys. Red bars: gene sets with increased representation in mutant kidneys. Based on n = 5 mice per group. ECM, extracellular matrix. e, Interaction analysis of proteins most strongly upregulated in the GAPDH mutant kidney. Edges represent experimentally supported interactions (confidence score >0.7) from the STRING database (https://string-db.org). Purple nodes represent proteins included in Uniprot pathway ‘Lipid metabolism’ (KW-0443), and green nodes represent proteins with a specific function in blood pressure control. f, Examples of enzymes involved in β-oxidation. Based on n = 5 mice per group. FC, fold change. g, Examples of enzymes involved in blood pressure control. Based on n = 5 mice per group. h, Examples of redox enzymes upregulated in the GAPDH mutant kidney. Based on n = 5 mice per group. Source data
Extended Data Fig. 1
Extended Data Fig. 1. Mutational inactivation of GAPDH oxidation sensitivity.
(a) Previously suggested proton relay mechanism facilitating GAPDH oxidation by H2O2. Cys-152 (C152) is the active site cysteine. The hydroxyl group of Tyr-314 (Y314) is required for the protonation of the hydroxide leaving group. The hydroxyl group of Thr-177 (T177) is thought to support the proper positioning of the Tyr-314 hydroxyl group. See Peralta et al., 2015, for further details. Dotted lines: hydrogen bonds. (b) Representative LC-MS/MS spectra of the GAPDH tryptic peptide containing the active site cysteine, before (lower panel) and after (upper panel) cellular H2O2 exposure, demonstrating selective S-glutathionylation of the active site cysteine under oxidative stress conditions. The calculated mass for fragment y112+ of the glutathionylated peptide is 782.8 Da, the calculated mass of the corresponding alkylated fragment y112+ is 701.8 Da. (c) Glutathionylation of GAPDH Cys-152 in WT and mutant cells, before and after treatment of intact cells with 50 µM H2O2 for 5 min, as determined by LC-MS/MS analysis. Same experiment as shown in main Fig. 1b, but including a second independently selected clone of the mutant cell line (Y314F_2). Bars represent the mean of 3 technical replicates. Representative of n = 3 biological replicates. (d) Hyperoxidation (sulfinylation and/or sulfonylation) of GAPDH Cys-152 as visualized by immunoblotting before and after treatment of intact cells with up to 2 mM H2O2 for 5 min. Same experiment as shown in main Fig. 1c, but including additional H2O2 concentrations and a second independently selected clone of the mutant cell line (Y314F_2). Representative of n = 3 biological replicates. (e) Outline of the strategy to determine relative flux of [1,2-13C]glucose into glycolysis and the pentose phosphate pathway (PPP), respectively. The ratio of singly and doubly labeled fructose-6-phosphate is taken to indicate relative PPP flux. (f) Extracellular acidification rate (ECAR) of cells expressing either WT or mutant GAPDH in response to 10 mM glucose (black arrow) and 100 µM H2O2 (red arrow). Based on n = 6 biological replicates. Dotted lines: SD. Source data
Extended Data Fig. 2
Extended Data Fig. 2. GAPDH(T175A) in MEFs mimics GAPDH(Y314F) in HAP1 cells.
(a) GAPDH activity as measured in the lysate of MEF cells expressing either WT or mutant (T175A) GAPDH, following treatment of intact cells with 200 µM H2O2 for 5 min. Activity values are normalized relative to untreated WT cells. Based on n = 3 biological replicates. Dotted lines: SD. (b) Hyperoxidation (sulfinylation and/or sulfonylation) of GAPDH Cys-152 in WT and mutant (T175A) MEF cells as visualized by immunoblotting before and after treatment of intact cells with up to 2 mM H2O2 for 5 min. Representative of n = 3 biological replicates. (c) Depletion of extracellular H2O2 (starting concentration: 200 µM) from the cell culture supernatant as measured with an H2O2-selective electrode, in the presence (left and middle panels) or absence (right panel) of 10 mM glucose, and in the presence of 10 mM 6-aminonicotinamide (6AN) (middle panel). Based on n = 3 biological replicates. Dotted lines: SD. Source data
Extended Data Fig. 3
Extended Data Fig. 3. The GAPDH redox switch allows cells to grow under peroxide stress.
(a) Survival of WT and mutant HAP1 cells after 24 h of exposure to low levels of H2O2 continuously produced by glucose oxidase (GOX) (left panel). Data are presented as mean values ± SD, based on n = 4 biological replicates. ns: non-significant; **p < 0.01; p = 0.9774 and 0.0062, based on a two-tailed unpaired t-test. Visualization of GAPDH hyperoxidation after 24 h in the same experiment (right panel). Representative of n = 4 biological replicates. (b) DNA synthesis, as measured by BrdU incorporation, in WT and mutant HAP1 cells, in the absence (bars 1-2) or presence (bars 3-4) of 100 µM H2O2. Data are presented as mean values ± SD, based on n = 4 biological replicates with n = 5 technical replicates each. ns: non-significant; p = 0.0952 and 0.0651, based on a two-tailed unpaired t-test. Source data
Extended Data Fig. 4
Extended Data Fig. 4. H2O2 levels associated with cell attachment.
(a) The roGFP2-Orp1 405 nm/488 nm fluorescence ratio as measured by flow cytometry in WT and mutant (Y314F) HAP1 cells grown in adherent monolayer culture, following treatment with either 20 mM diamide (Dia) (full oxidation) or 100 mM dithiothreitol (DTT) (full reduction). Left panel: representative histogram. Right panel: Data are presented as mean values ± SD, based n = 3 biological replicates (unpaired two-tailed t test). ns: non-significant, based on a two-tailed unpaired t-test. Source data
Extended Data Fig. 5
Extended Data Fig. 5. Cisplatin induces an intracellular elevation of H2O2 levels.
(a) The roGFP2-Orp1 405 nm/488 nm fluorescence ratio as measured by flow cytometry of WT and mutant (Y314F) HAP1 cells, stably expressing the roGFP2-Orp1 probe, either mock-treated (bars 1, 3), or treated with 40 µM Cisplatin (bars 2, 4) for 24 h. Data are presented as mean values ± SD, based on n = 3 biological replicates with n = 4 technical replicates each. *p < 0.05; **p < 0.01; ***p < 0.01; p = 0.0477, 0.0004, 0.0072 and 0.0083, based on a two-tailed unpaired t-test. Source data
Extended Data Fig. 6
Extended Data Fig. 6. FACS Gating Strategies.
(a) Gating scheme for flow cytometry-based analysis of ROS levels in erythrocytes from peripheral blood (Fig. 7a). Sequential flow cytometry gates were used to define: CD41- Ter119+ erythroid cells; CD71-, Ter119+ erythrocytes. The level of fluorescence of the DCFDA stain was assessed for this cell population within the FITC channel of the flow cytometer. (b) Gating scheme for flow cytometry-based identification of MEP cells from bone marrow (Fig. 7b). Sequential flow cytometry gates were used to define: live leukocytes based on forward scatter versus side scatter; single cells based on forward scatter area versus forward scatter height; lineage negative cells; c-Kit+, Sca-1- cells; CD34-, CD16/32- MEPs (indicated by red box).
Extended Data Fig. 7
Extended Data Fig. 7. Analysis of GAPDH mutant mice.
(a) Mapping of differential protein abundance in the kidney on a metabolic pathway chart (iPath). Blue lines highlight metabolic transformations significantly downregulated in GAPDH mutant kidneys. Red lines highlight metabolic transformations significantly upregulated in GAPDH mutant kidneys. The line thickness indicates fold change. (b) Gene set enrichment analysis of proteins differentially expressed in the GAPDH mutant heart. Mapping to KEGG (Kyoto Encyclopedia of Genes and Genomes) pathways. Blue bars: gene sets with decreased representation in mutant heart. Red bars: gene sets with increased representation in mutant heart. Based on n = 6 biological replicates. (c) Mapping of differential protein abundance in the heart on a metabolic pathway chart (iPath). Blue lines highlight metabolic transformations significantly downregulated in GAPDH mutant kidneys. Red lines highlight metabolic transformations significantly upregulated in GAPDH mutant kidneys. The line thickness indicates fold change. Source data

Comment in

References

    1. Shenton D, Grant CM. Protein S-thiolation targets glycolysis and protein synthesis in response to oxidative stress in the yeast Saccharomyces cerevisiae. Biochem. J. 2003;374:513–519. doi: 10.1042/bj20030414. - DOI - PMC - PubMed
    1. Baty JW, Hampton MB, Winterbourn CC. Proteomic detection of hydrogen peroxide-sensitive thiol proteins in Jurkat cells. Biochem. J. 2005;389:785–795. doi: 10.1042/BJ20050337. - DOI - PMC - PubMed
    1. van der Reest J, Lilla S, Zheng L, Zanivan S, Gottlieb E. Proteome-wide analysis of cysteine oxidation reveals metabolic sensitivity to redox stress. Nat. Commun. 2018;9:1581. doi: 10.1038/s41467-018-04003-3. - DOI - PMC - PubMed
    1. Anastasiou D, et al. Inhibition of pyruvate kinase M2 by reactive oxygen species contributes to cellular antioxidant responses. Science. 2011;334:1278–1283. doi: 10.1126/science.1211485. - DOI - PMC - PubMed
    1. Peralta D, et al. A proton relay enhances H2O2 sensitivity of GAPDH to facilitate metabolic adaptation. Nat. Chem. Biol. 2015;11:156–163. doi: 10.1038/nchembio.1720. - DOI - PubMed

Publication types

MeSH terms