

Label-free quantitative proteomics reveals aberrant expression levels of LRG, C9, FN, A1AT and AGP1 in the plasma of patients with colorectal cancer
- PMID: 37024778
- PMCID: PMC10077704
- DOI: 10.1186/s12014-023-09407-y
Label-free quantitative proteomics reveals aberrant expression levels of LRG, C9, FN, A1AT and AGP1 in the plasma of patients with colorectal cancer
Abstract
Background: Colorectal cancer (CRC) is one of the major causes of cancer-related death worldwide. Although commercial biomarkers of CRC are currently available, they are still lacking in terms of sensitivity and specificity; thus, searching for reliable blood-based biomarkers are important for the primary screening of CRC.
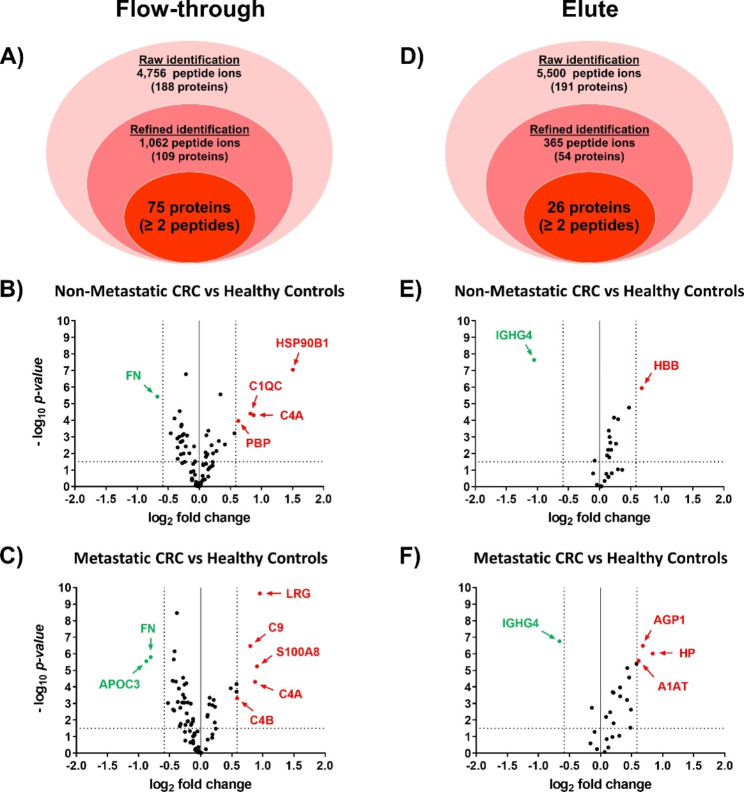
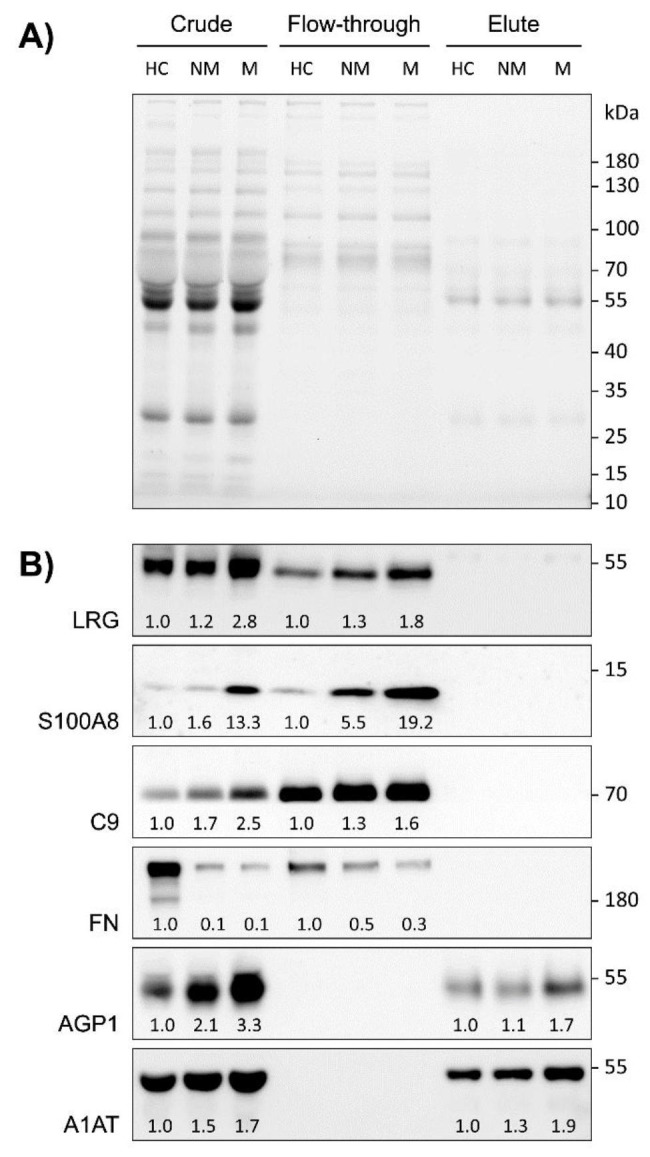
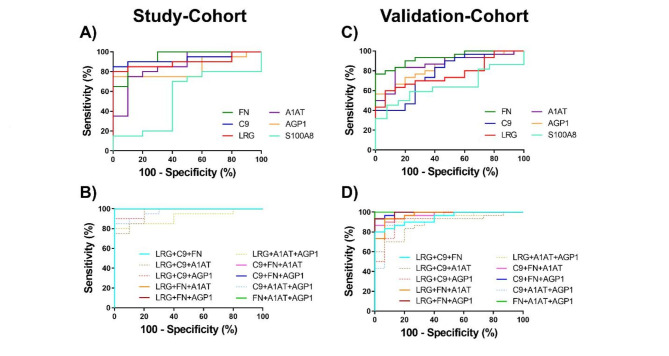
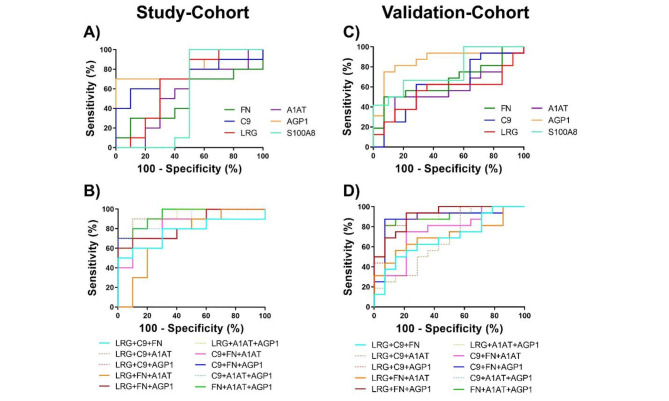
Methods: Plasma samples of patients with non-metastatic (NM) and metastatic (M) CRC and healthy controls were fractionated using MARS-14 immunoaffinity chromatography. The flow-through and elute fractions representing low- and high-abundant proteins, respectively, were analyzed by label-free quantitative proteomics mass spectrometry. The functional analysis of the proteins with greater than 1.5-fold differential expression level between the CRC and the healthy control groups were analyzed for their biological processes and molecular functions. In addition, the levels of plasma proteins showing large alterations in CRC patients were confirmed by immunoblotting using two independent cohorts. Moreover, receiver operating characteristic (ROC) curve analysis was performed for individual and combinations of biomarker candidates so as to evaluate the diagnostic performance of biomarker candidates.
Results: From 163 refined identifications, five proteins were up-regulated and two proteins were down-regulated in NM-CRC while eight proteins were up-regulated and three proteins were down-regulated in M-CRC, respectively. Altered plasma proteins in NM-CRC were mainly involved in complement activation, while those in M-CRC were clustered in acute-phase response, complement activation, and inflammatory response. Results from the study- and validation-cohorts indicate that the levels of leucine-rich alpha-2-glycoprotein-1(LRG), complement component C9 (C9), alpha-1-acid glycoprotein 1 (AGP1), and alpha-1-antitrypsin (A1AT) were statistically increased, while fibronectin (FN) level was statistically decreased in CRC patients compared to healthy controls, with most alterations found in a metastatic stage-dependent manner. ROC analysis revealed that FN exhibited the best diagnostic performance to discriminate CRC patients and healthy controls while AGP1 showed the best discrimination between the disease stages in both cohorts. The combined biomarker candidates, FN + A1AT + AGP1, exhibited perfect discriminatory power to discriminate between the CRC population and healthy controls whereas LRG + A1AT + AGP1 was likely to be the best panel to discriminate the metastatic stages in both cohorts.
Conclusions: This study identified and quantified distinct plasma proteome profiles of CRC patients. Selected CRC biomarker candidates including FN, LRG, C9, A1AT, and AGP1 may be further applied for screening larger cohorts including disease groups from other types of cancer or other diseases.
Keywords: Affinity chromatography; MARS-14; blood-based biomarkers; colorectal cancer; label-free quantitative proteomics.
© 2023. The Author(s).
Conflict of interest statement
All authors declare no competing interest.
Figures

References
-
- Sung H, Ferlay J, Siegel RL, Laversanne M, Soerjomataram I, Jemal A et al. Global cancer statistics 2020: GLOBOCAN estimates of incidence and mortality worldwide for 36 cancers in 185 countries. CA: a cancer journal for clinicians. 2021. - PubMed
Grants and funding
- 36821/4274352/Thailand Science Research and Innovation (TSRI), Chulabhorn Research Institute
- 36821/4274352/Thailand Science Research and Innovation (TSRI), Chulabhorn Research Institute
- 36821/4274352/Thailand Science Research and Innovation (TSRI), Chulabhorn Research Institute
- 36821/4274352/Thailand Science Research and Innovation (TSRI), Chulabhorn Research Institute
- 36821/4274352/Thailand Science Research and Innovation (TSRI), Chulabhorn Research Institute
LinkOut - more resources
Full Text Sources
Research Materials
Miscellaneous