. 2023 Apr 6;24(1):136.
doi: 10.1186/s12859-023-05206-2.

Using sensitivity analyses to understand bistable system behavior

Affiliations

Using sensitivity analyses to understand bistable system behavior

Vandana Sreedharan et al. BMC Bioinformatics. .

Abstract

Background: Bistable systems, i.e., systems that exhibit two stable steady states, are of particular interest in biology. They can implement binary cellular decision making, e.g., in pathways for cellular differentiation and cell cycle regulation. The onset of cancer, prion diseases, and neurodegenerative diseases are known to be associated with malfunctioning bistable systems. Exploring and characterizing parameter spaces in bistable systems, so that they retain or lose bistability, is part of a lot of therapeutic research such as cancer pharmacology.

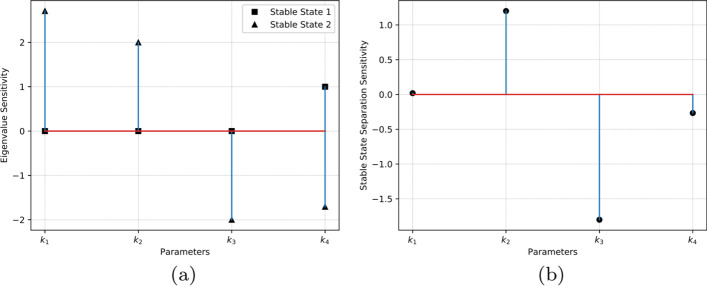
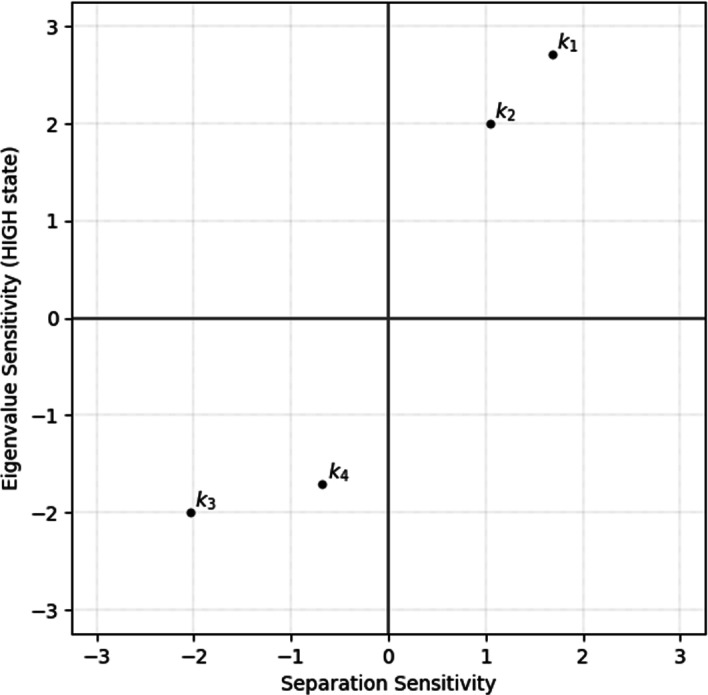
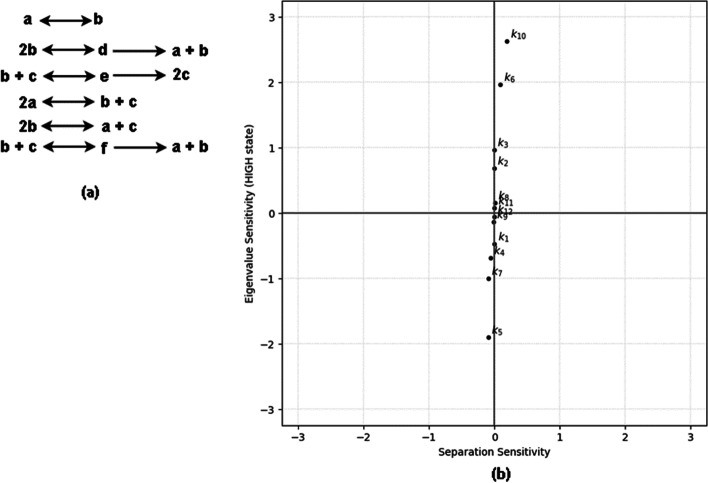
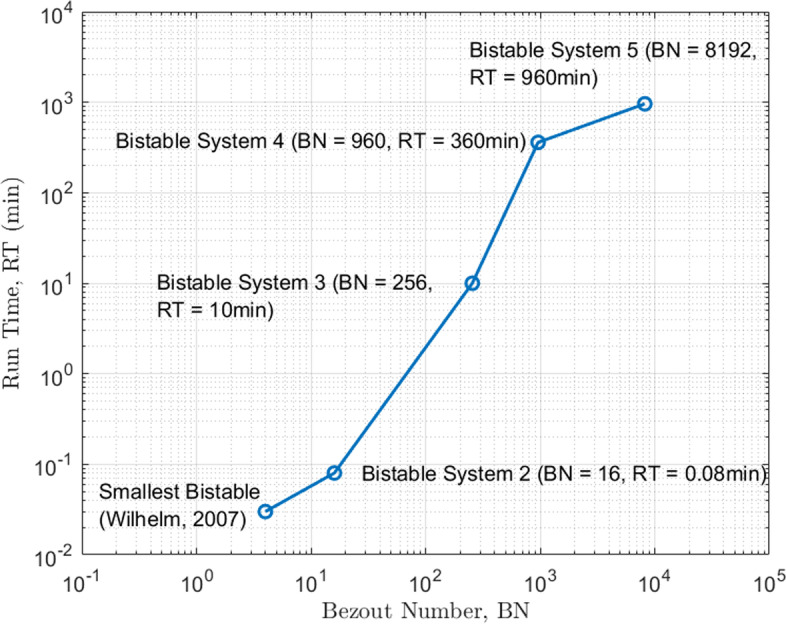
Results: We use eigenvalue sensitivity analysis and stable state separation sensitivity analysis to understand bistable system behaviors, and to characterize the most sensitive parameters of a bistable system. While eigenvalue sensitivity analysis is an established technique in engineering disciplines, it has not been frequently used to study biological systems. We demonstrate the utility of these approaches on a published bistable system. We also illustrate scalability and generalizability of these methods to larger bistable systems.

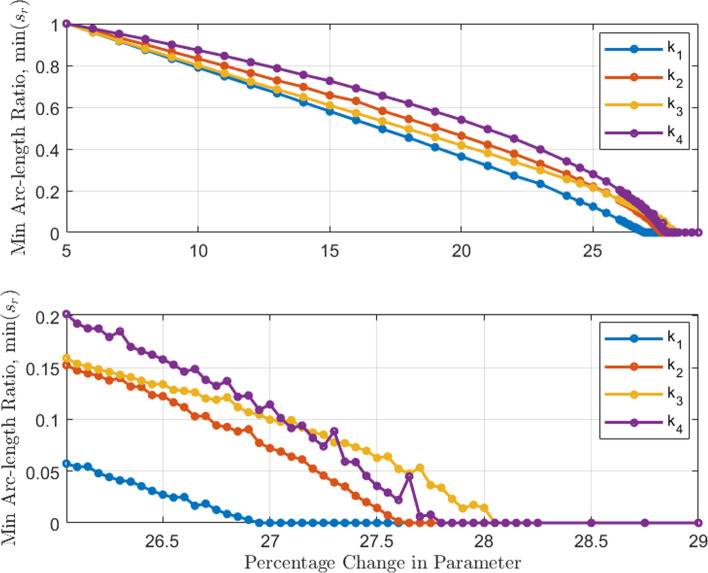
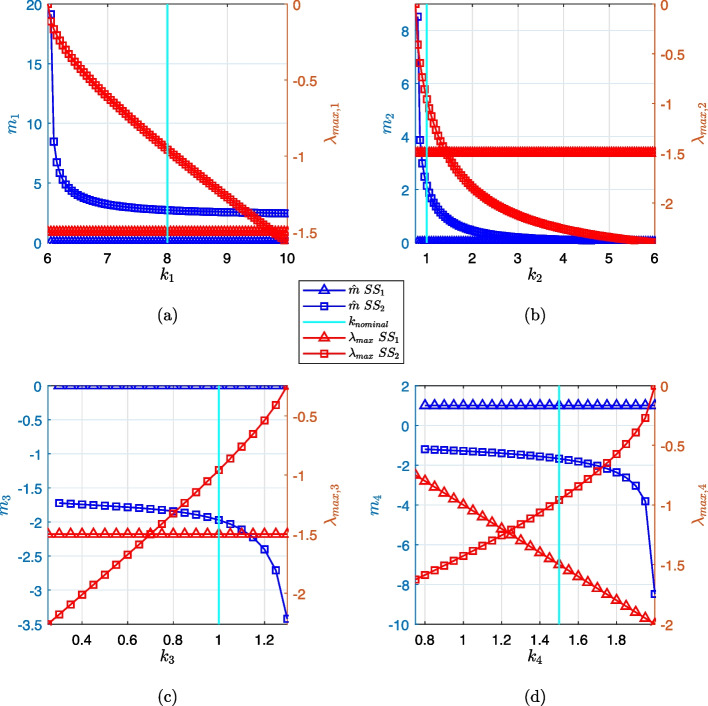
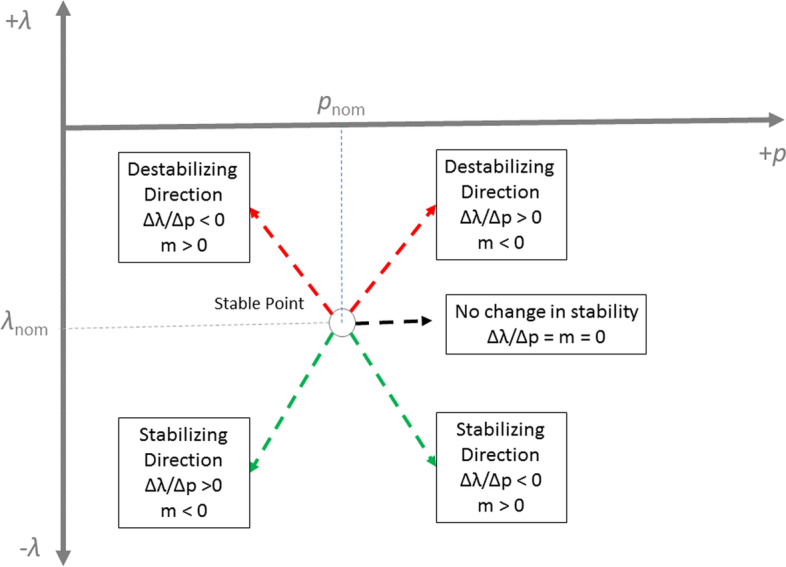
Conclusions: Eigenvalue sensitivity analysis and separation sensitivity analysis prove to be promising tools to define parameter design rules to make switching decisions between either stable steady state of a bistable system and a corresponding monostable state after bifurcation. These rules were applied to the smallest two-component bistable system and results were validated analytically. We showed that with multiple parameter settings of the same bistable system, we can design switching to a desirable state to retain or lose bistability when the most sensitive parameter is varied according to our parameter perturbation recommendations. We propose eigenvalue and stable state separation sensitivity analyses as a framework to evaluate large and complex bistable systems.

Keywords: Bistable switching; Distance to bifurcation; Eigenvalue sensitivity; Parameter design; Sensitivity analysis; Steady state separation.


Conflict of interest statement

The authors declare that they have no competing interests.

Figures

Fig. 1
Fig. 1
The smallest bistable chemical system proposed by Wilhelm [41]. In this work, we applied eigenvalue and steady state separation sensitivity analyses on this system. (a) Chemical reactions where species concentrations [X] and [Y] are considered to be the two states of the system. (b) Reaction rate equations where x and y are the time-dependent states of the system. The reaction rate constants k1, k2, k3, and k4 are non-dimensional. (c) x- and y-nullclines of the system, showing the two stable steady states (blue markers) and saddle node (red marker) at the points of intersection. (d) One-parameter bifurcation diagrams (or S-curves) corresponding to parameters k1 through k4. The width of the S-curve for each parameter represents the bistable region. (See Additional file 1 for more details of the system)
Fig. 2
Fig. 2
Eigenvalue sensitivity analysis flowchart. A mass-action kinetics model of a bistable system is perturbed in both positive and negative directions of a nominal parameter setting. Using the centered-difference method, the rate of change in eigenvalue w.r.t change in parameter is computed. The above workflow is repeated for all parameters one at a time. Based on the eigenvalue sensitivity, parameters can be clustered automatically. The clusters corresponding to the higher eigenvalue sensitivities are prime candidates to modify the stability characteristics of the system via parameter design
Fig. 3
Fig. 3
Summary of sensitivity analyses for the smallest bistable system (a) Eigenvalue sensitivity m^ for stable state 1 and 2 (SS1, SS2), with parameter perturbations for k1 through k4. For SS1 (0, 0) the maximum eigenvalue is influenced only by k4; k1, k2, and k3 do not influence it (shown by the zero eigenvalue sensitivity). For SS2 (6, 4.5), k1 and k2 perturbations in the positive direction stabilize it while a similar change in k3 and k4 destabilizes it. (b) Sensitivity of separation between stable steady states for the system. Parameter k1 has minimal effect on the goodness of this switch. When perturbed in the positive direction, parameter k2 increases the separation between SS1 and SS2. Parameters k3 and k4 both need to be perturbed in the negative direction to increase separation, k3 having the largest influence. For a simple system such as the one investigated here, these trends are visually evident in the one-parameter bifurcation curves in Fig. 1d
Fig. 4
Fig. 4
Eigenvalue and separation sensitivity plotted in a sensitivity space. There is positive correlation between the two sensitivities. The clusters {k1,k2} and {k3,k4} correspond respectively to S-curve and laterally inverted S-curve
Fig. 5
Fig. 5
Arc length measure in parameter-state space. The parameter-state space consists of the perturbed parameter (one at a time) and the concentrations of the participating species. The bifurcation curve shown is in this space. Initial ON state corresponds to the nominal system model (s=0). After a non-zero perturbation along the k-axis, the system moves by an arc length s=D. When further perturbed, the system is eventually pushed to the bifurcation point (s=soff) where it transitions to a monostable system at the bifurcation point labeled OFF
Fig. 6
Fig. 6
Sensitivity analyses agree with arc length measure in predicting switching. Relationship between eigenvalue sensitivity, separation sensitivity, and percent arc length to parameter perturbation. (Top) Arc length ratio is a definitive measure of when switching occurs (s/smax=1). This condition is first attained for perturbations 25% for {k1,k2}. For {k3,k4} this transition occurs after further perturbation of 30-35%. Therefore, {k1,k2} is dominant parameter cluster in that lesser amount of perturbations in these parameters can lead to switching. (Middle) The vertical ordering of eigenvalue sensitivity curves indicates that the clustering observed in the arc length plot is reproduced.(Below) The trend seen with eigenvalue sensitivity is repeated with separation sensitivity results as well. This shows that the sensitivity analyses can be used as a proxy to predict which parameters will cause switching first when perturbed by the same amounts
Fig. 7
Fig. 7
Arc length and parameter perturbation at the population level. Maximum arc length ratio vs. percentage change in parameter value for a population of 20, 000 models. Each setting for a given parameter draws from a log-normal distribution with 3σ equal to the percent change. This generates an output distribution of arc length ratios, the maximum of which is considered. The parameter cluster {k1,k2} causes transition to the monostable state the earliest when compared to {k3,k4}. Lower panel shows a zoomed-in view of the upper panel capturing the instances where perturbation in each parameter achieves bifurcation
Fig. 8
Fig. 8
Comparison of local eigenvalue sensitivity analysis and its global trend within the bistable region. The smallest bistable system’s maximum eigenvalue (red markers) and eigenvalue sensitivity (blue markers) are plotted as a function of each system parameter (reaction rate constants k1 through k4) taken one at a time while others are retained at their nominal values. The parameter values span the system’s bistable region. The vertical cyan line shows the nominal parameter setting (knominal) and the local eigenvalue sensitivity analysis at this setting was shown earlier in Fig. 3a. The design rules presented earlier in Table 2, which was based on the local sensitivity analysis, are verified here to correlate with the global sensitivity trend: (a) and (b) show {k1,k2} stabilize the system (slope of the eigenvalue sensitivity curve decreased) as the parameter value is increased from the nominal setting. (c) and (d): {k3,k4} are de-stabilizing as the parameter value is increased from the nominal setting
Fig. 9
Fig. 9
Demonstrating eigenvalue sensitivity and separation sensitivity analyses on a 12-parameter bistable system (a) Reactions for a larger bistable system from [42]. See Additional file 1 for the system of ODEs and parameter values for this system. (b) The plot shows eigenvalue sensitivity and separation sensitivity for the 12 parameters. Low values of separation sensitivity across all parameters indicate a good bistable switch
Fig. 10
Fig. 10
Bezout Number vs. Run time of different bistable system models where sensitivity analyses were implemented. The x-axis shows Bezout number [48] which is the number of solutions of the system computed as the product of the polynomial orders of the system (for example, if we were to determine the solution for the intersection of two circles, the Bezout number is 4 which is the product of maximum degrees of two quadratic equations). Note that both axes are in log scale. Y-axis is the run time in minutes to determine the solution of the model
Fig. 11
Fig. 11
Interpretation of eigensensitivity measure m for a stable point. mij>0 implies that the parameter should be increased (Δpj>0) to increase the stability of the system and it should be decreased to destabilize the system. Similarly, mij<0 implies that the parameter should be decreased (Δpj<0) to increase the stability of the system and it should be increased to destabilize the system. The magnitude of m signifies how effective the parameter can be in stabilizing or destabilizing the system

References

    1. Hahn J, Burghoorn J, Dubnau D, Others Turgay K, Hahn J, Burghoorn J, Dubnau D. Competence in Bacillus subtilis is controlled by regulated proteolysis of a transcription factor. The EMBO journal. 1998;17(22):6730–6738. doi: 10.1093/emboj/17.22.6730. - DOI - PMC - PubMed
    1. Maier B. Competence and transformation in bacillus subtilis. Current Issues in Molecular Biology. 2020;37(1):57–76. doi: 10.21775/cimb.037.057. - DOI - PubMed
    1. Bagowski CP, Ferrell JE., Jr Bistability in the jnk cascade. Current Biology. 2001;11(15):1176–1182. doi: 10.1016/S0960-9822(01)00330-X. - DOI - PubMed
    1. Sabouri-Ghomi M, Ciliberto A, Kar S, Novak B, Tyson JJ. Antagonism and bistability in protein interaction networks. Journal of Theoretical Biology. 2008;250(1):209–218. doi: 10.1016/j.jtbi.2007.09.001. - DOI - PubMed
    1. Pomerening JR. Uncovering mechanisms of bistability in biological systems. Current Opinion in Biotechnology. 2008;19(4):381–388. doi: 10.1016/j.copbio.2008.06.009. - DOI - PubMed

LinkOut - more resources