

Decision curve analysis confirms higher clinical utility of multi-domain versus single-domain prediction models in patients with open abdomen treatment for peritonitis
- PMID: 37024840
- PMCID: PMC10078078
- DOI: 10.1186/s12911-023-02156-w
Decision curve analysis confirms higher clinical utility of multi-domain versus single-domain prediction models in patients with open abdomen treatment for peritonitis
Abstract
Background: Prediction modelling increasingly becomes an important risk assessment tool in perioperative systems approaches, e.g. in complex patients with open abdomen treatment for peritonitis. In this population, combining predictors from multiple medical domains (i.e. demographical, physiological and surgical variables) outperforms the prediction capabilities of single-domain prediction models. However, the benefit of these prediction models for clinical decision-making remains to be investigated. We therefore examined the clinical utility of mortality prediction models in patients suffering from peritonitis with a decision curve analysis.
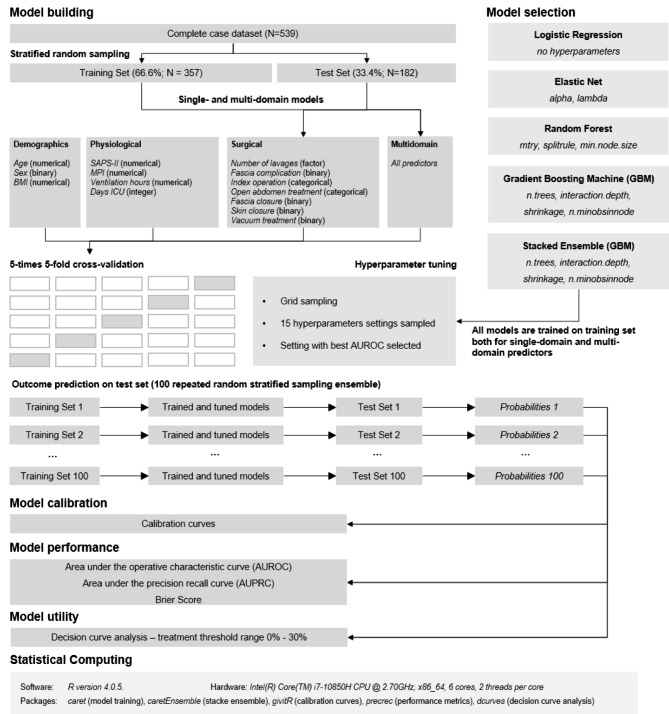
Methods: In this secondary analysis of a large dataset, a traditional logistic regression approach, three machine learning methods and a stacked ensemble were employed to examine the predictive capability of demographic, physiological and surgical variables in predicting mortality under open abdomen treatment for peritonitis. Calibration was examined with calibration belts and predictive performance was assessed with the area both under the receiver operating characteristic curve (AUROC) and under the precision recall curve (AUPRC) and with the Brier Score. Clinical utility of the prediction models was examined by means of a decision curve analysis (DCA) within a treatment threshold range of interest of 0-30%, where threshold probabilities are traditionally defined as the minimum probability of disease at which further intervention would be warranted.
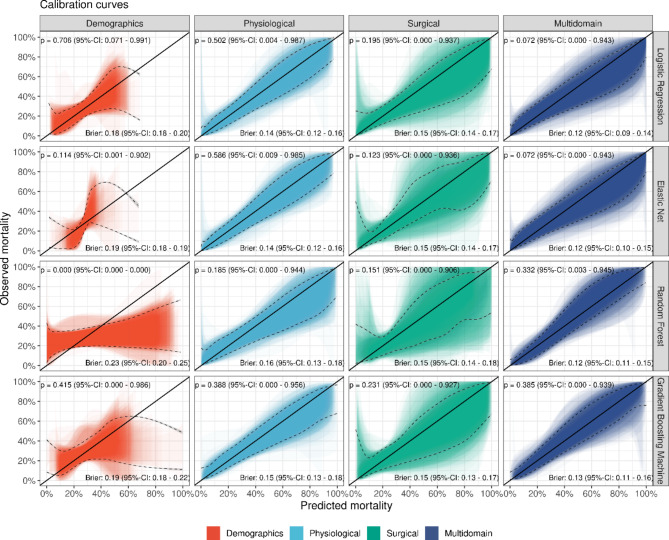
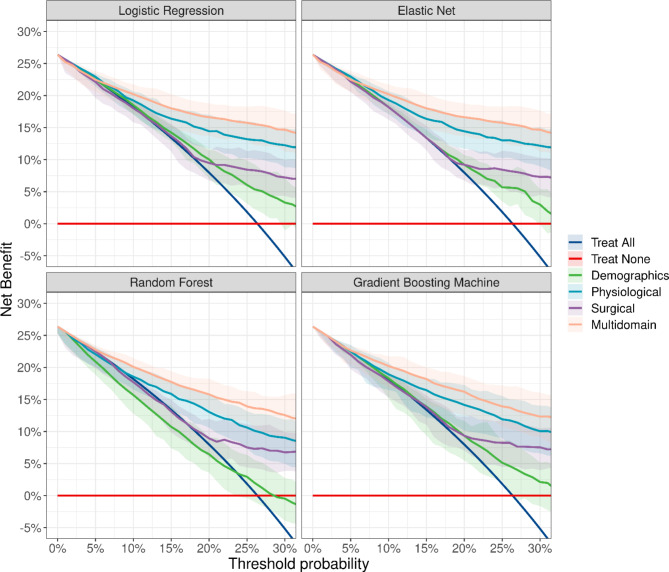
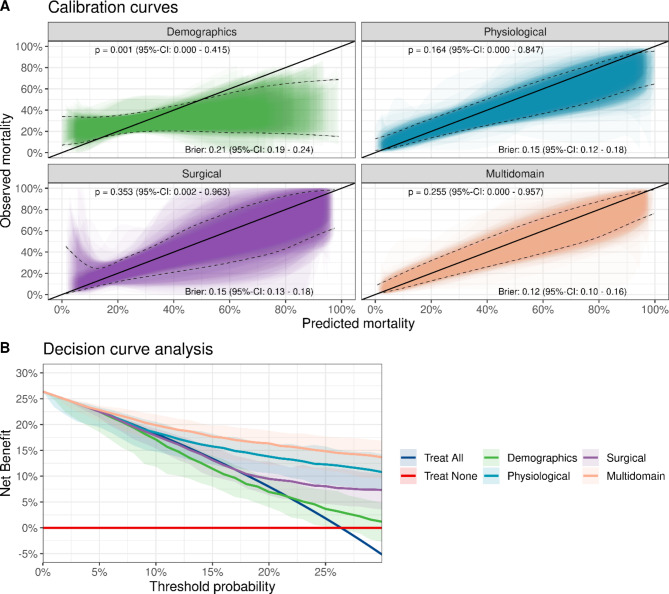
Results: Machine learning methods supported available evidence of a higher prediction performance of a multi- versus single-domain prediction models. Interestingly, their prediction performance was similar to a logistic regression model. The DCA demonstrated that the overall net benefit is largest for a multi-domain prediction model and that this benefit is larger compared to the default "treat all" strategy only for treatment threshold probabilities above about 10%. Importantly, the net benefit for low threshold probabilities is dominated by physiological predictors: surgical and demographics predictors provide only secondary decision-analytic benefit.
Conclusions: DCA provides a valuable tool to compare single-domain and multi-domain prediction models and demonstrates overall higher decision-analytic value of the latter. Importantly, DCA provides a means to clinically differentiate the risks associated with each of these domains in more depth than with traditional performance metrics and highlighted the importance of physiological predictors for conservative intervention strategies for low treatment thresholds. Further, machine learning methods did not add significant benefit either in prediction performance or decision-analytic utility compared to logistic regression in these data.
Keywords: Calibration; Clinical prediction modelling; Decision curve analysis; Machine learning; Peritonitis.
© 2023. The Author(s).
Conflict of interest statement
All authors declare no financial or non-financial conflicts of interest.
Figures
Similar articles
-
Decision Curve Analysis of In-Hospital Mortality Prediction Models: The Relative Value of Pre- and Intraoperative Data For Decision-Making.Anesth Analg. 2024 Sep 1;139(3):617-28. doi: 10.1213/ANE.0000000000006874. Epub 2024 Feb 5. Anesth Analg. 2024. PMID: 38315623
-
Outcome in patients with open abdomen treatment for peritonitis: a multidomain approach outperforms single domain predictions.J Clin Monit Comput. 2022 Aug;36(4):1109-1119. doi: 10.1007/s10877-021-00743-8. Epub 2021 Jul 10. J Clin Monit Comput. 2022. PMID: 34247307 Free PMC article.
-
How Does the Skeletal Oncology Research Group Algorithm's Prediction of 5-year Survival in Patients with Chondrosarcoma Perform on International Validation?Clin Orthop Relat Res. 2020 Oct;478(10):2300-2308. doi: 10.1097/CORR.0000000000001305. Clin Orthop Relat Res. 2020. PMID: 32433107 Free PMC article.
-
Reporting and Interpreting Decision Curve Analysis: A Guide for Investigators.Eur Urol. 2018 Dec;74(6):796-804. doi: 10.1016/j.eururo.2018.08.038. Epub 2018 Sep 19. Eur Urol. 2018. PMID: 30241973 Free PMC article. Review.
-
Machine learning or traditional statistical methods for predictive modelling in perioperative medicine: A narrative review.J Clin Anesth. 2025 Mar;102:111782. doi: 10.1016/j.jclinane.2025.111782. Epub 2025 Feb 19. J Clin Anesth. 2025. PMID: 39977974 Review.
Cited by
-
Construction and validation of a clinical prediction model for sepsis using peripheral perfusion index to predict in-hospital and 28-day mortality risk.Sci Rep. 2024 Nov 5;14(1):26827. doi: 10.1038/s41598-024-78408-0. Sci Rep. 2024. PMID: 39501076 Free PMC article.
-
Predicting the risk of ibrutinib in combination with R-ICE in patients with relapsed or refractory DLBCL using explainable machine learning algorithms.Clin Exp Med. 2025 May 26;25(1):177. doi: 10.1007/s10238-025-01709-9. Clin Exp Med. 2025. PMID: 40418267 Free PMC article.
-
Development of a machine learning prediction model for loss to follow-up in HIV care using routine electronic medical records in a low-resource setting.BMC Med Inform Decis Mak. 2025 May 19;25(1):192. doi: 10.1186/s12911-025-03030-7. BMC Med Inform Decis Mak. 2025. PMID: 40389908 Free PMC article.
References
-
- Moreno RP, Metnitz PGH, Almeida E, Jordan B, Bauer P, Campos RA, et al. SAPS 3—From evaluation of the patient to evaluation of the intensive care unit. Part 2: development of a prognostic model for hospital mortality at ICU admission. Intensive Care Med. 2005;31(10):1345–55. doi: 10.1007/s00134-005-2763-5. - DOI - PMC - PubMed
