

Transcriptomics and metabolomics analysis of L-phenylalanine overproduction in Escherichia coli
- PMID: 37024921
- PMCID: PMC10080781
- DOI: 10.1186/s12934-023-02070-w
Transcriptomics and metabolomics analysis of L-phenylalanine overproduction in Escherichia coli
Abstract
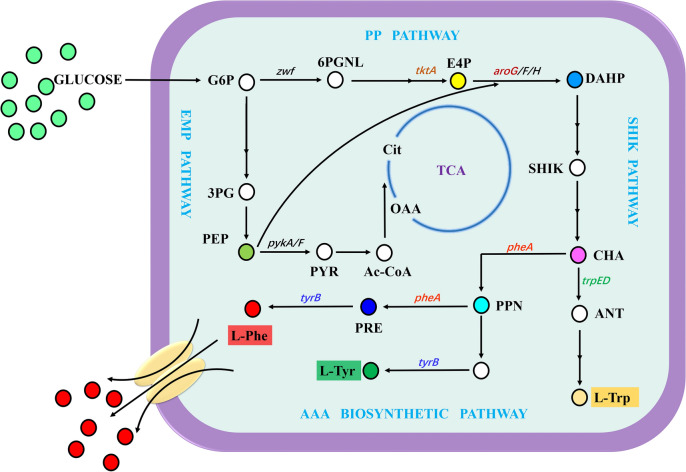
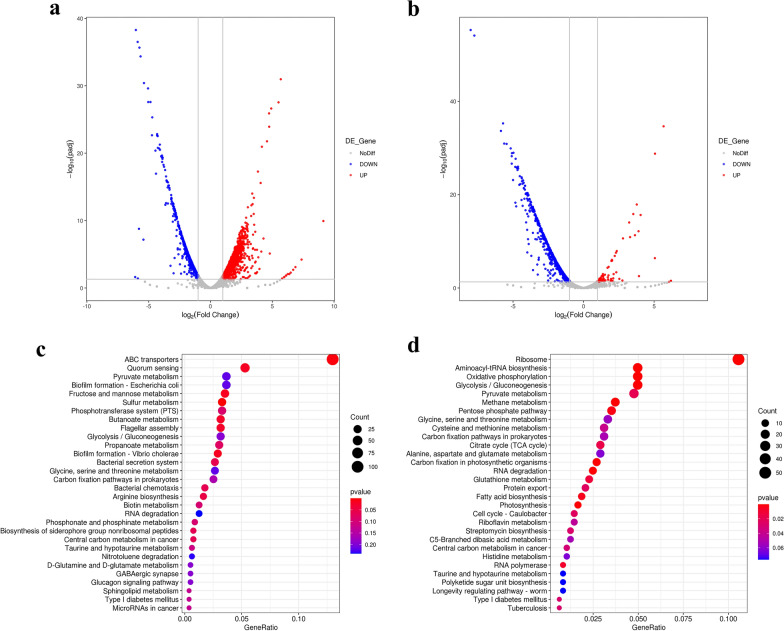
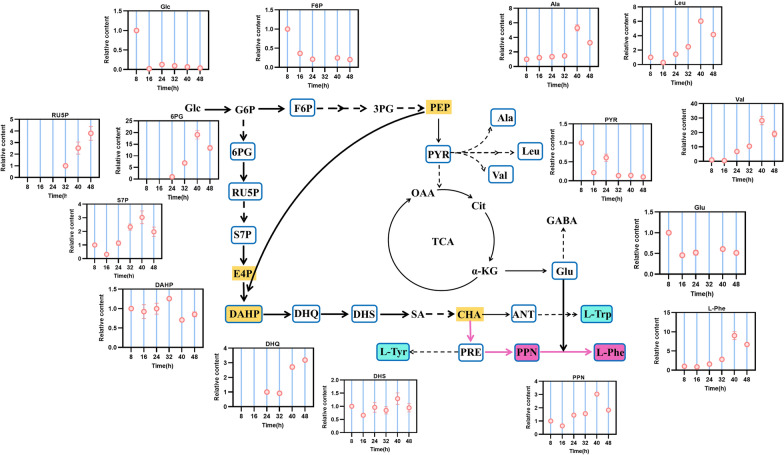
Background: Highly efficient production of L-phenylalanine (L-Phe) in E. coli has been achieved by multiple rounds of random mutagenesis and modification of key genes of the shikimate (SHIK) and L-Phe branch pathways. In this study, we performed transcriptomic (16, 24 and 48 h) and metabolomic analyses (8, 16, 24, 32,40, and 48 h) based on time sequences in an engineered E. coli strain producing L-Phe, aiming to reveal the overall changes of metabolic activities during the fermentation process.
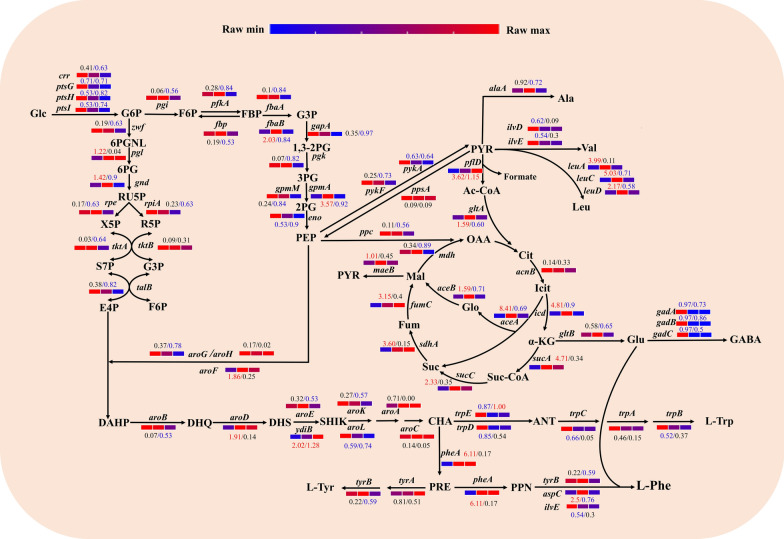
Results: The largest biomass increase rate and the highest production rate were seen at 16 h and 24 h of fermentation, respectively reaching 5.9 h-1 and 2.76 g/L/h, while the maximal L-Phe titer of 60 g/L was accumulated after 48 h of fermentation. The DEGs and metabolites involved in the EMP, PP, TCA, SHIIK and L-Phe-branch pathways showed significant differences at different stages of fermentation. Specifically, the significant upregulation of genes encoding rate-limiting enzymes (aroD and yidB) and key genes (aroF, pheA and aspC) pushed more carbon flux toward the L-Phe synthesis. The RIA changes of a number of important metabolites (DAHP, DHS, DHQ, Glu and PPN) enabled the adequate supply of precursors for high-yield L-Phe production. In addition, other genes related to Glc transport and phosphate metabolism increased the absorption of Glc and contributed to rerouting the carbon flux into the L-Phe-branch.
Conclusions: Transcriptomic and metabolomic analyses of an L-Phe overproducing strain of E. coli confirmed that precursor supply was not a major limiting factor in this strain, whereas the rational distribution of metabolic fluxes was achieved by redistributing the carbon flux (for example, the expression intensity of the genes tyrB, aspC, aroL and aroF/G/H or the activity of these enzymes is increased to some extent), which is the optimal strategy for enhancing L-Phe production.
Keywords: Escherichia coli; L-phenylalanine production; Metabolic flux; Metabolomic analysis; Transcriptomic analysis.
© 2023. The Author(s).
Conflict of interest statement
The authors declare that they have no competing interests.
Figures

Similar articles
-
Improvement of L-phenylalanine production from glycerol by recombinant Escherichia coli strains: the role of extra copies of glpK, glpX, and tktA genes.Microb Cell Fact. 2014 Jul 11;13(1):96. doi: 10.1186/s12934-014-0096-1. Microb Cell Fact. 2014. PMID: 25012491 Free PMC article.
-
Metabolic Engineering of Escherichia coli for High-Level Production of l-Phenylalanine.J Agric Food Chem. 2024 May 15;72(19):11029-11040. doi: 10.1021/acs.jafc.4c01563. Epub 2024 May 3. J Agric Food Chem. 2024. PMID: 38699920
-
Genetic engineering of Escherichia coli to improve L-phenylalanine production.BMC Biotechnol. 2018 Jan 30;18(1):5. doi: 10.1186/s12896-018-0418-1. BMC Biotechnol. 2018. PMID: 29382315 Free PMC article.
-
From scratch to value: engineering Escherichia coli wild type cells to the production of L-phenylalanine and other fine chemicals derived from chorismate.Appl Microbiol Biotechnol. 2007 Jun;75(4):739-49. doi: 10.1007/s00253-007-0931-y. Epub 2007 Apr 14. Appl Microbiol Biotechnol. 2007. PMID: 17435995 Review.
-
Construction of recombinant Escherichia coli for production of L-phenylalanine-derived compounds.World J Microbiol Biotechnol. 2021 Apr 15;37(5):84. doi: 10.1007/s11274-021-03050-1. World J Microbiol Biotechnol. 2021. PMID: 33855641 Review.
Cited by
-
The Omics Dashboard for Interactive Exploration of Metabolomics and Multi-Omics Data.Metabolites. 2024 Jan 19;14(1):65. doi: 10.3390/metabo14010065. Metabolites. 2024. PMID: 38276300 Free PMC article.
-
Investigation of the fermentation filtrate from soapberry (Sapindus mukorossi Gaertn.) pericarp on improving the microbial diversity and composition of the human scalp.Front Microbiol. 2024 Oct 10;15:1443767. doi: 10.3389/fmicb.2024.1443767. eCollection 2024. Front Microbiol. 2024. PMID: 39450286 Free PMC article.
-
Periodic Changes in the Gut Microbiome in Women with the Mixed Type of Irritable Bowel Syndrome.Biomedicines. 2025 Mar 7;13(3):652. doi: 10.3390/biomedicines13030652. Biomedicines. 2025. PMID: 40149628 Free PMC article.
-
Innovations and challenges in collagen and gelatin production through precision fermentation.World J Microbiol Biotechnol. 2025 Feb 6;41(2):63. doi: 10.1007/s11274-025-04276-z. World J Microbiol Biotechnol. 2025. PMID: 39910024 Review.
-
Synergetic engineering of Escherichia coli for efficient production of l-tyrosine.Synth Syst Biotechnol. 2023 Nov 7;8(4):724-731. doi: 10.1016/j.synbio.2023.10.005. eCollection 2023 Dec. Synth Syst Biotechnol. 2023. PMID: 38033756 Free PMC article.
References
MeSH terms
Substances
Grants and funding
- 2021YFC2100900/National Key Research and Development Program of China
- 22178372/National Natural Science Foundation of China
- 32100062/National Natural Science Foundation of China
- 2021M703438/Postdoctoral Science Foundation of China
- TSBICIP-CXRC-029/ianjin Synthetic Biotechnology Innovation Capacity Improvement Project
LinkOut - more resources
Full Text Sources
Miscellaneous
