

Explainable prediction of daily hospitalizations for cerebrovascular disease using stacked ensemble learning
- PMID: 37024922
- PMCID: PMC10080841
- DOI: 10.1186/s12911-023-02159-7
Explainable prediction of daily hospitalizations for cerebrovascular disease using stacked ensemble learning
Abstract
Background: With the prevalence of cerebrovascular disease (CD) and the increasing strain on healthcare resources, forecasting the healthcare demands of cerebrovascular patients has significant implications for optimizing medical resources.
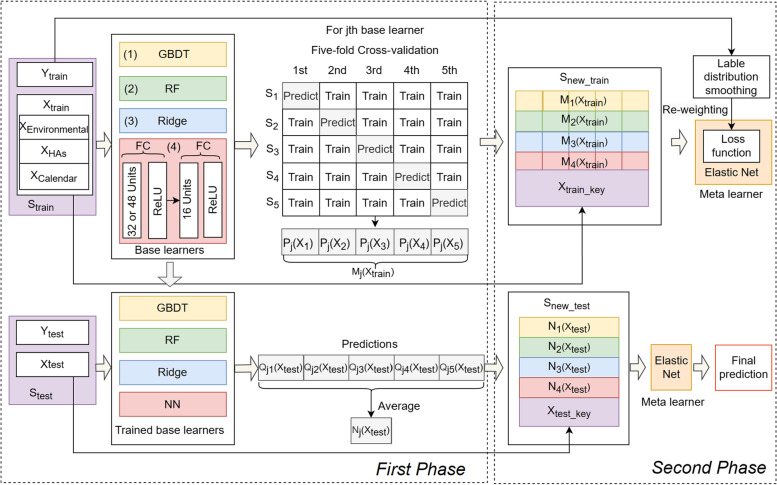
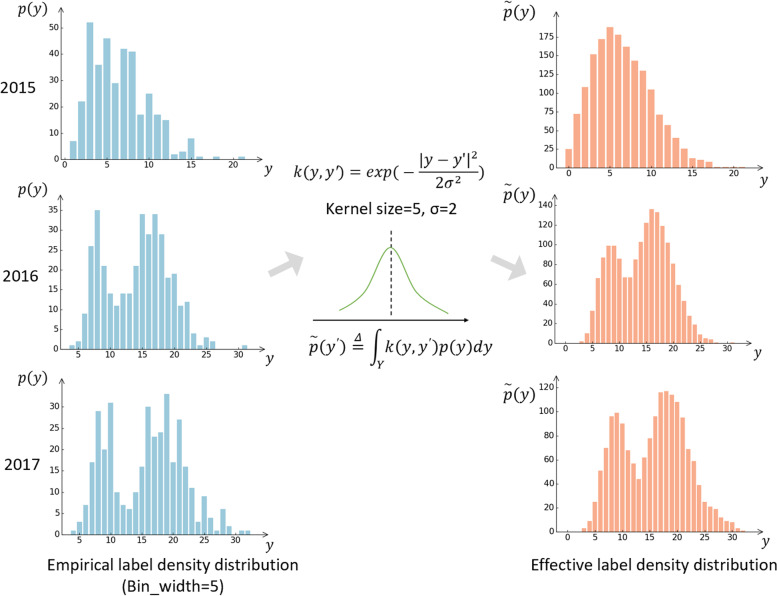
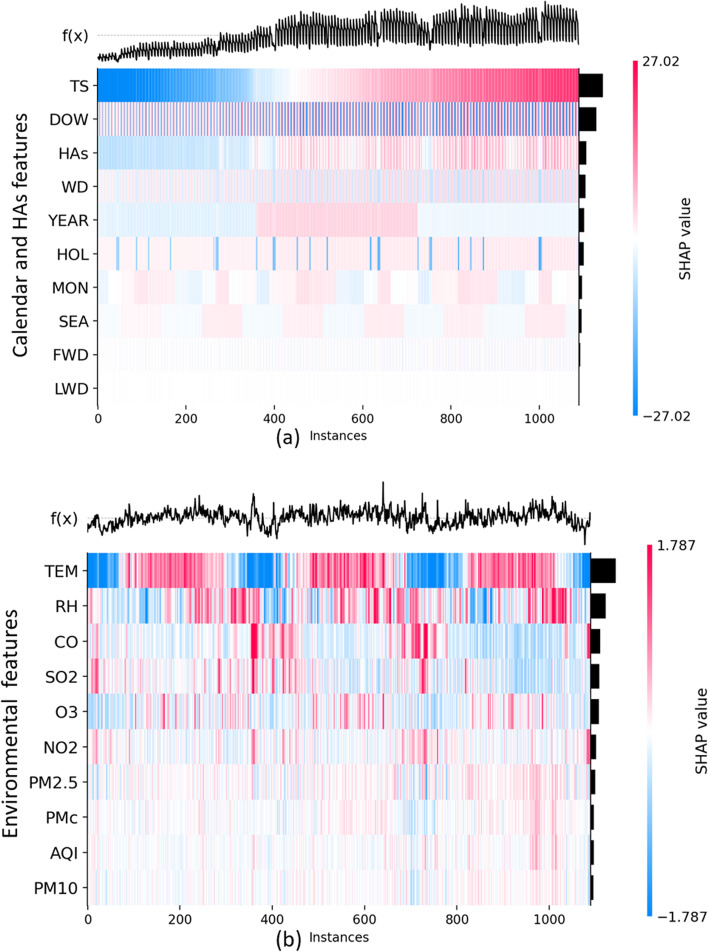
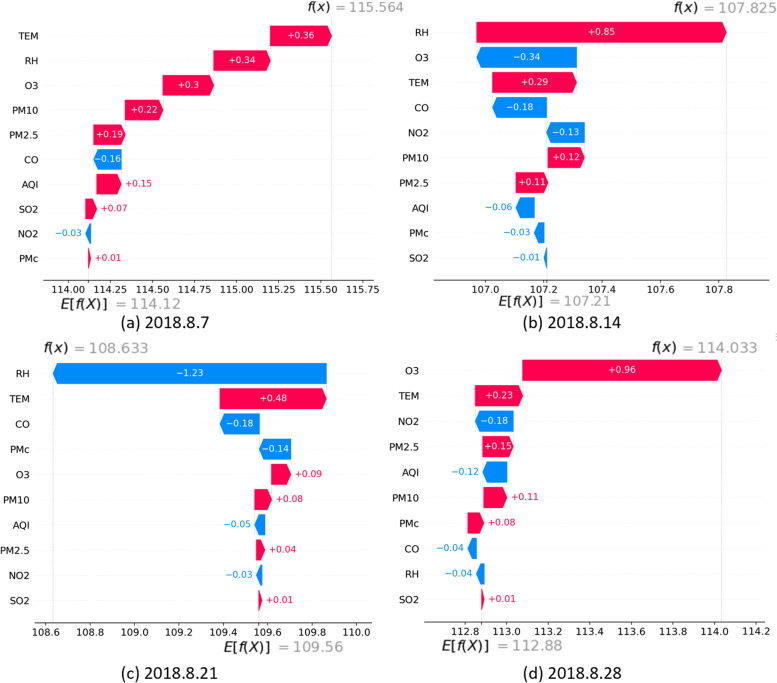
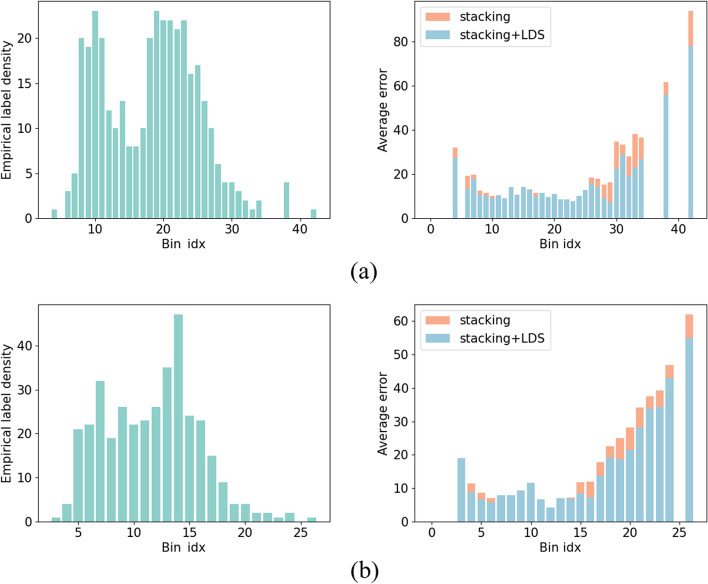
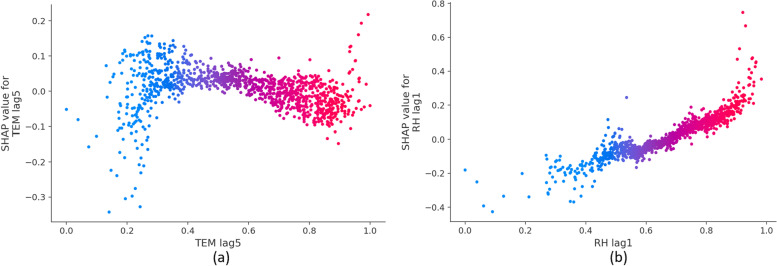
Methods: In this study, a stacking ensemble model comprised of four base learners (ridge regression, random forest, gradient boosting decision tree, and artificial neural network) and a meta learner (elastic net) was proposed for predicting the daily number of hospital admissions (HAs) for CD using the historical HAs data, air quality data, and meteorological data in Chengdu, China from 2015 to 2018. To solve the label imbalance problem, a re-weighting method based on label distribution smoothing was integrated into the meta learner. We trained the model using the data from 2015 to 2017 and evaluated its predictive ability using the data in 2018 based on four metrics, including mean absolute error (MAE), root mean square error (RMSE), mean absolute percentage error (MAPE), and coefficient of determination (R2). In addition, the SHapley Additive exPlanations (SHAP) framework was applied to provide explanation for the prediction of our stacking model.
Results: Our proposed model outperformed all the base learners and long short-term memory (LSTM) on two datasets. Particularly, compared with the optimal results obtained by individual models, the MAE, RMSE, and MAPE of the stacking model decreased by 13.9%, 12.7%, and 5.8%, respectively, and the R2 improved by 6.8% on CD dataset. The model explanation demonstrated that environmental features played a role in further improving the model performance and identified that high temperature and high concentrations of gaseous air pollutants might strongly associate with an increased risk of CD.
Conclusions: Our stacking model considering environmental exposure is efficient in predicting daily HAs for CD and has practical value in early warning and healthcare resource allocation.
Keywords: Cerebrovascular disease; Environmental exposure; Hospital admissions; SHAP value; Stacking ensemble model.
© 2023. The Author(s).
Conflict of interest statement
The authors declare that they have no competing interests.
Figures

References
-
- WHO mortality database: the number of deaths caused by cerebrovascular disease. https://platform.who.int/mortality/themes/theme-details/topics/indicator.... Accessed 3 Sep 2022.
-
- China TWC of the R on CH and D in. Report on Cardiovascular Health and Diseases in China An Updated Summary. Biomed Environ Sci. 2021;2022(35):573–603. - PubMed
Publication types
MeSH terms
LinkOut - more resources
Full Text Sources
