. 2023 Apr 6;24(1):70.
doi: 10.1186/s13059-023-02893-1.

FIPRESCI: droplet microfluidics based combinatorial indexing for massive-scale 5'-end single-cell RNA sequencing

Affiliations

FIPRESCI: droplet microfluidics based combinatorial indexing for massive-scale 5'-end single-cell RNA sequencing

Yun Li et al. Genome Biol. .

Erratum in

Abstract

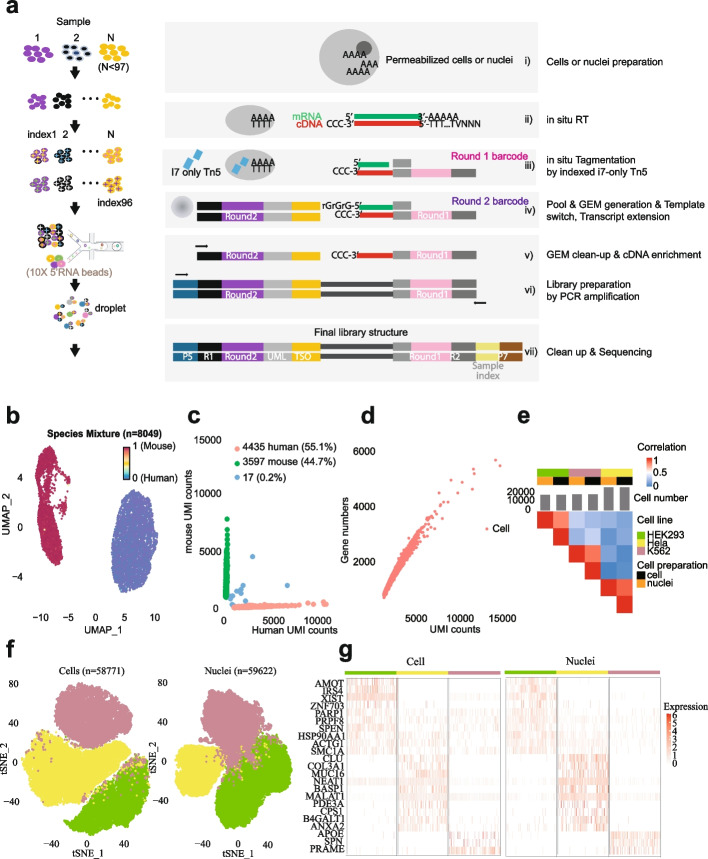
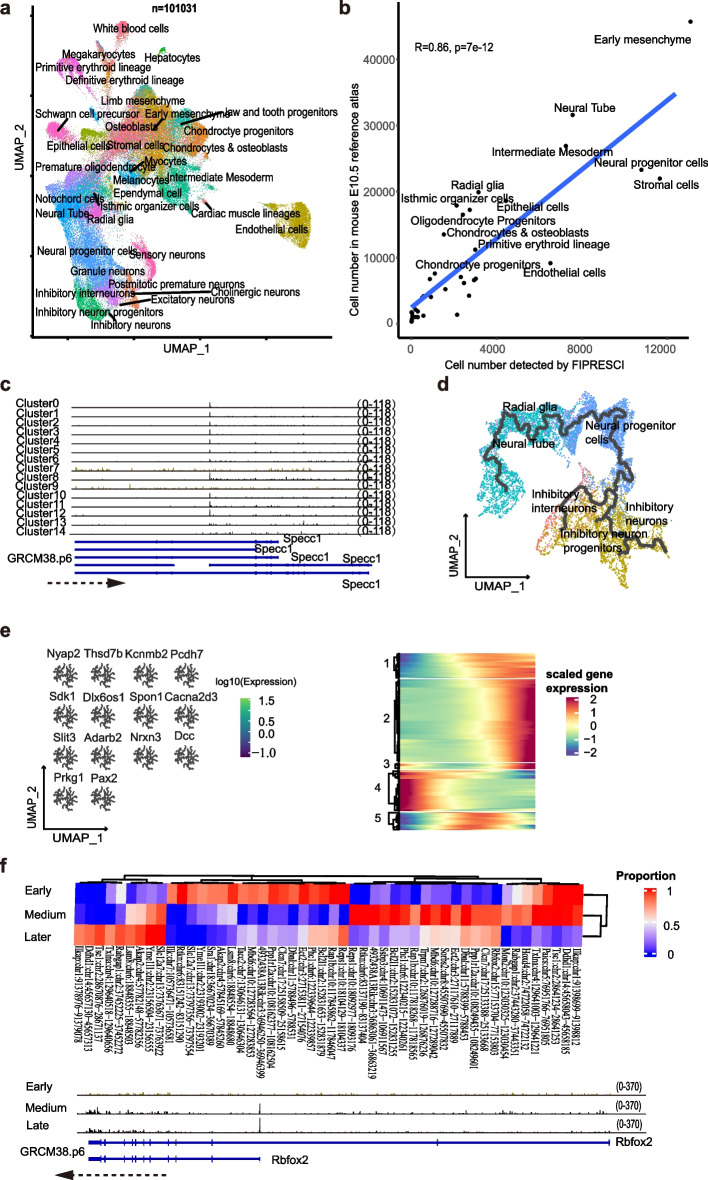
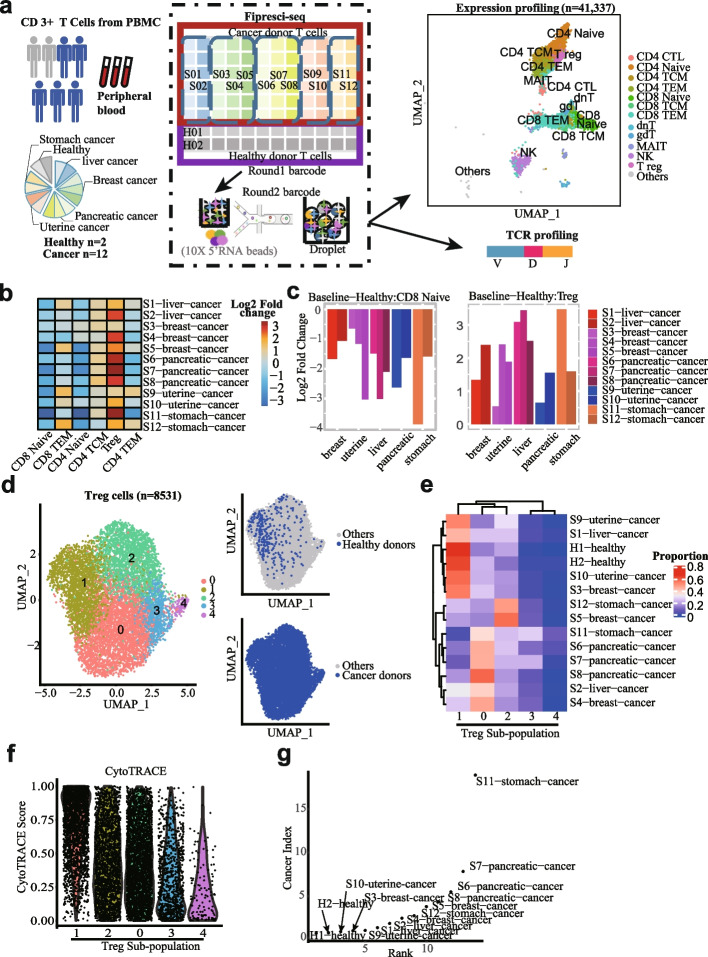
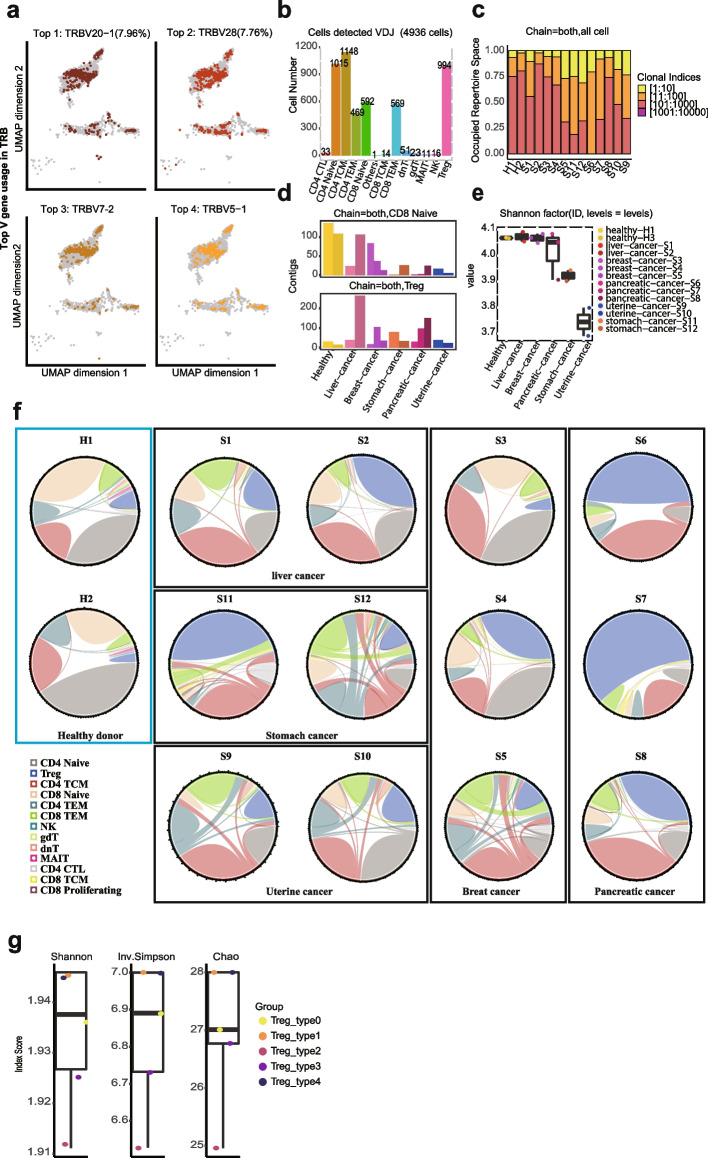
Single-cell RNA sequencing methods focusing on the 5'-end of transcripts can reveal promoter and enhancer activity and efficiently profile immune receptor repertoire. However, ultra-high-throughput 5'-end single-cell RNA sequencing methods have not been described. We introduce FIPRESCI, 5'-end single-cell combinatorial indexing RNA-Seq, enabling massive sample multiplexing and increasing the throughput of the droplet microfluidics system by over tenfold. We demonstrate FIPRESCI enables the generation of approximately 100,000 single-cell transcriptomes from E10.5 whole mouse embryos in a single-channel experiment, and simultaneous identification of subpopulation differences and T cell receptor signatures of peripheral blood T cells from 12 cancer patients.

Keywords: 10X Genomics; Combinatorial indexing; Sample multiplexing; Single-cell RNA-seq; Single-nucleus RNA-seq; scTCR-seq; scVDJ-seq.


Conflict of interest statement

L. J. and Y.L. are inventors of a patent application describing the FIPRESCI method. The other authors declare that they have no competing interests. The patent does not restrict the use of the method for educational, research, or not-for-profit purposes.

Figures

Fig. 1
Fig. 1
Overview and validation of FIPRESCI. a The FIPRESCI schematic workflow and detailed method design. Permeabilized cells or nuclei are reverse transcribed, then nuclei or cells are randomly distributed into wells containing indexed Tn5 transposome to label the cellular origin of RNA/cDNA hybrid heteroduplexes within cells. The cells or nuclei containing preindexed cDNA are pooled, randomly mixed, and encapsulated using a commercial microfluidic platform and amplified for preparation of the sequencing library. b Species-mixing experiment with a library prepared from the 1:1 mix of human (Jurkat) and mouse (NIH-3T3) permeabilized cells. Human uniquely barcoded cells (UBCs) are blue, mouse UBCs are red in UMAP. n = 8049 cells. c The number of unique fragments aligning to the human or mouse genome. Human UBCs are red, mouse UBCs are green, and mixed-species UBCs are blue. The estimated barcode collision rate is 0.2%, whereas species purity is > 99%. d The number of UMI counts plotted against detected genes from species-mixing experiments. e Heatmap showing pairwise correlations and hierarchical clustering for the gene expression profiles across cell lines, cell preparation methods using FIPRESCI. f Dimensionality reduction (UMAP) and unsupervised clustering for single-cell (n = 58,771) and single-nucleus (n = 59,622) FIPRESCI of the three cell lines. HEK293 is red, Hela is green, and K562 is blue. g Heatmap showing differentially expressed genes and gene expression levels of single-cell and single-nucleus FIPRESCI for three cell lines. Each column represents a single cell
Fig. 2
Fig. 2
Optimization and expanded application of FIPRESCI. a Violin plot showing sensitivity in FIPRESCI generated with a set of TN5 tagmentation buffers. Each dot represents a single cell. Y-axis is the number of genes detected. b Sensitivity of gene detection in three reverse transcription primer conditions in FIPRESCI single-cell RNA-seq (solid line) and single-nucleus RNA-seq (dotted line) across sequencing depth. c Distribution of reads from three reverse transcription primer conditions in FIPRESCI scRNA-seq and snRNA-seq around annotated TSS. d Distribution of reads from three reverse transcription primer conditions in FIPRESCI scRNA-seq and snRNA-seq around enhancer center. e Histogram showing the number of eRNA loci identified in three reverse transcription primer conditions in FIPRESCI scRNA-seq and snRNA-seq. f Histogram showing the percentage of distal ATAC peaks which are overlap with eRNA loci in three reverse transcription primer conditions in FIPRESCI scRNA-seq and snRNA-seq. g Heatmap showing pairwise correlations, hierarchical clustering for the eRNA profile across different reverse transcription primers, and preparation methods using FIPRESCI
Fig. 3
Fig. 3
FIPRESCI enables analysis of E10.5 whole mouse embryo. a Label transfer from a scRNA-seq profiled mouse organogenesis atlas to FIPRESCI data. UMAP embedding colored by transferred cell types. b A high correlation between cell type proportion was detected by Fipresci-Seq and the public atlas. c Differential usages of TSS for gene Specc1. IGV (Integrative Genomics Viewer) Track plot shows cluster 7 and cluster 9 use the same TSSs of gene Specc1, while other clusters used different ones. The tracks are group scaled and the range is shown on the right margin. d De novo constructing inhibitory neuron trajectory. e Trajectory graph-correlated genes. UMAP plots colored by gene expression (left), those genes are highly correlated with the brain trajectory graph. Heatmap (right) showing genes dynamic changes along with pseudo time within inhibitory neuron trajectory. f Top, heatmap showing TSS usage proportion over 3 stages of inhibitory neuron trajectory. Row names of the heatmap are stages (early, medium, and later pseudo time), the column represents TSSs, and colors indicate TSS reads proportion of all TSS reads in the corresponding gene within one stage (early, medium, or later cells). Track plot (bottom) showing gene Rbfox2 TSS usage changes along the inhibitory trajectory
Fig. 4
Fig. 4
Single-cell transcriptome landscape of pan-cancer T cells FIPRESCI. a Flowchart depicting the overall experimental design of T cells (from peripheral blood of human donors (n = 14)) single-cell expression profiling and paired TCR profiling by FIPRESCI. UMAP plot (upper right) showing the major cell types detected. Total single cells (n = 41,377). b Heatmap showing the composition of the major T cell subtypes for different cancer patients and healthy donors. c Histogram showing the proportion change of the CD8 naïve (left) and T reg (right) in cancer patients compared to healthy donors. d Unsupervised clustering of Treg cells reveals 5 distinct Treg subpopulations. Left, UMAP embedding of 5 Treg subpopulation. Right top, UMAP plot colored by Treg cells from healthy donors. Right bottom, UMAP plot colored by Treg cells from cancer donors. e Heatmap showing five Treg subpopulations proportion over different donors. f Violin plot showing CytoTRACE Score distribution grouped by five Treg subpopulations. The order of subpopulations from left to right on the X-axis in descending order of mean CytoTRACE score within one subpopulation. g Dot plot showing the cancer index of each donor. Each dot represents one donor. Y-axis is the cancer index and X-axis is the rank according to the cancer index (the smaller the cancer index, the smaller the rank value)
Fig. 5
Fig. 5
FIPRESCI is compatible with single-cell immune repertoire profiling. a UMAP shows the top 4 V genes usages in TRB. b Bar plots show the number of cells detected TCR VDJ by cell types (4,983). c Box plots showing the TCR clonal diversity. Diversity is calculated using Shannon metrics. d The histogram shows the distribution of the unique TCR clonotypes of the CD8 naïve (upper) and Treg (lower) across 14 donors. e Histogram showing the frequency and distribution of occupied TCR clonotypes across 14 donors. f Chord diagrams show the number of relative TCR clonotypes and the shared clonotypes across T cells in individual donors. g Box plot showing five Treg subpopulations clonotype diversity. Clonotype diversity is calculated as the Shannon index, inverse Simpson index, or Chao index within one Treg subpopulation

Similar articles

Cited by

References

    1. Kouno T, Moody J, Kwon ATJ, Shibayama Y, Kato S, Huang Y, et al. C1 CAGE detects transcription start sites and enhancer activity at single-cell resolution. Nat Commun. 2019;10. Springer US. 10.1038/s41467-018-08126-5 - PMC - PubMed
    1. Hong TH, Park WY. Single-cell genomics technology: perspectives. Exp Mol Med. 2020;52:1407–1408. doi: 10.1038/s12276-020-00495-6. - DOI - PMC - PubMed
    1. Tu AA, Gierahn TM, Monian B, Morgan DM, Mehta NK, Ruiter B, et al. TCR sequencing paired with massively parallel 3′ RNA-seq reveals clonotypic T cell signatures. Nat Immunol. 2019;20:1692–1699. doi: 10.1038/s41590-019-0544-5. - DOI - PMC - PubMed
    1. Cao Y, Su B, Guo X, Sun W, Deng Y, Bao L, et al. Potent neutralizing antibodies against SARS-CoV-2 identified by high-throughput single-cell sequencing of convalescent patients’ B cells. Cell. 2020;182:73–8416.e16. doi: 10.1016/j.cell.2020.05.025. - DOI - PMC - PubMed
    1. Ren X, Wen W, Fan X, Hou W, Su B, Cai P, et al. COVID-19 immune features revealed by a large-scale single-cell transcriptome atlas. Cell. 2021;184:1895–1913.e19. doi: 10.1016/j.cell.2021.01.053. - DOI - PMC - PubMed

Publication types