. 2023 Apr 7;16(1):10.
doi: 10.1186/s13072-023-00484-9.

Multilevel interrogation of H3.3 reveals a primordial role in transcription regulation

Affiliations

Multilevel interrogation of H3.3 reveals a primordial role in transcription regulation

Syed Nabeel-Shah et al. Epigenetics Chromatin. .

Abstract

Background: Eukaryotic cells can rapidly adjust their transcriptional profile in response to molecular needs. Such dynamic regulation is, in part, achieved through epigenetic modifications and selective incorporation of histone variants into chromatin. H3.3 is the ancestral H3 variant with key roles in regulating chromatin states and transcription. Although H3.3 has been well studied in metazoans, information regarding the assembly of H3.3 onto chromatin and its possible role in transcription regulation remain poorly documented outside of Opisthokonts.

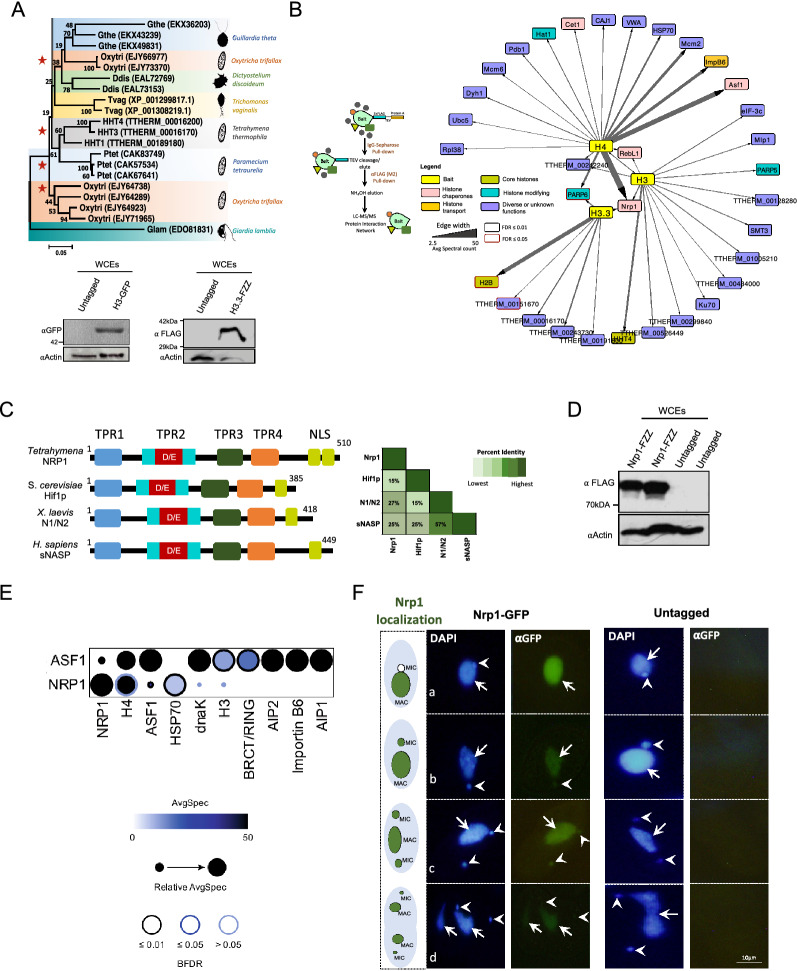
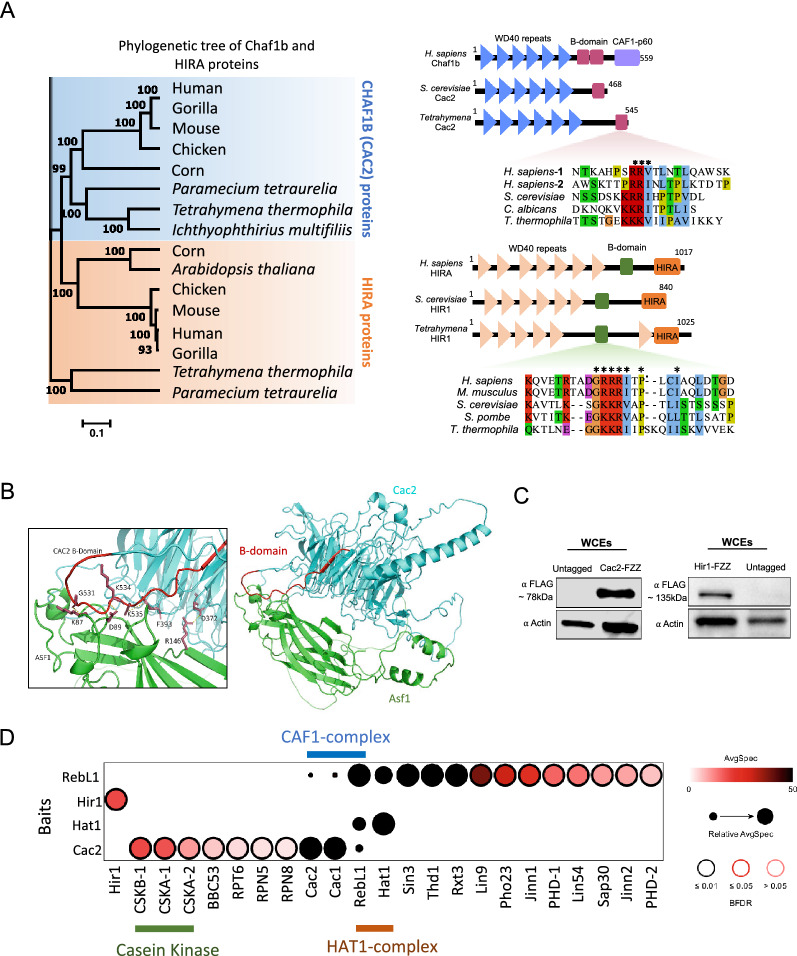
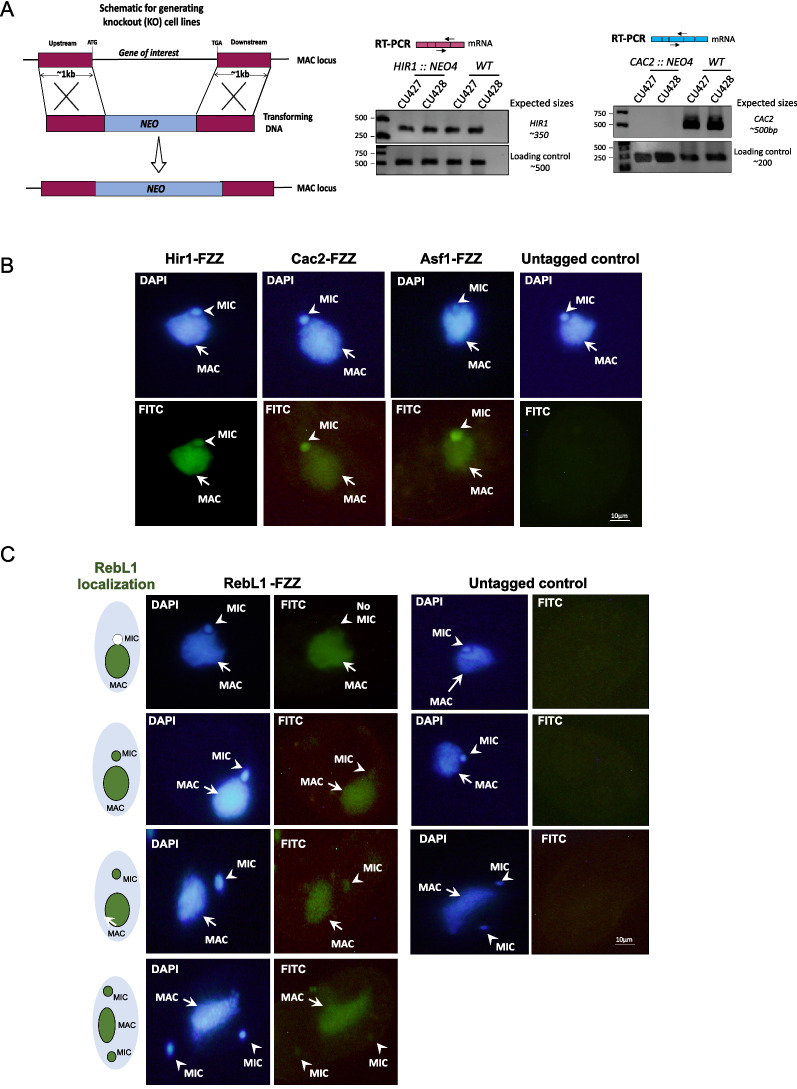
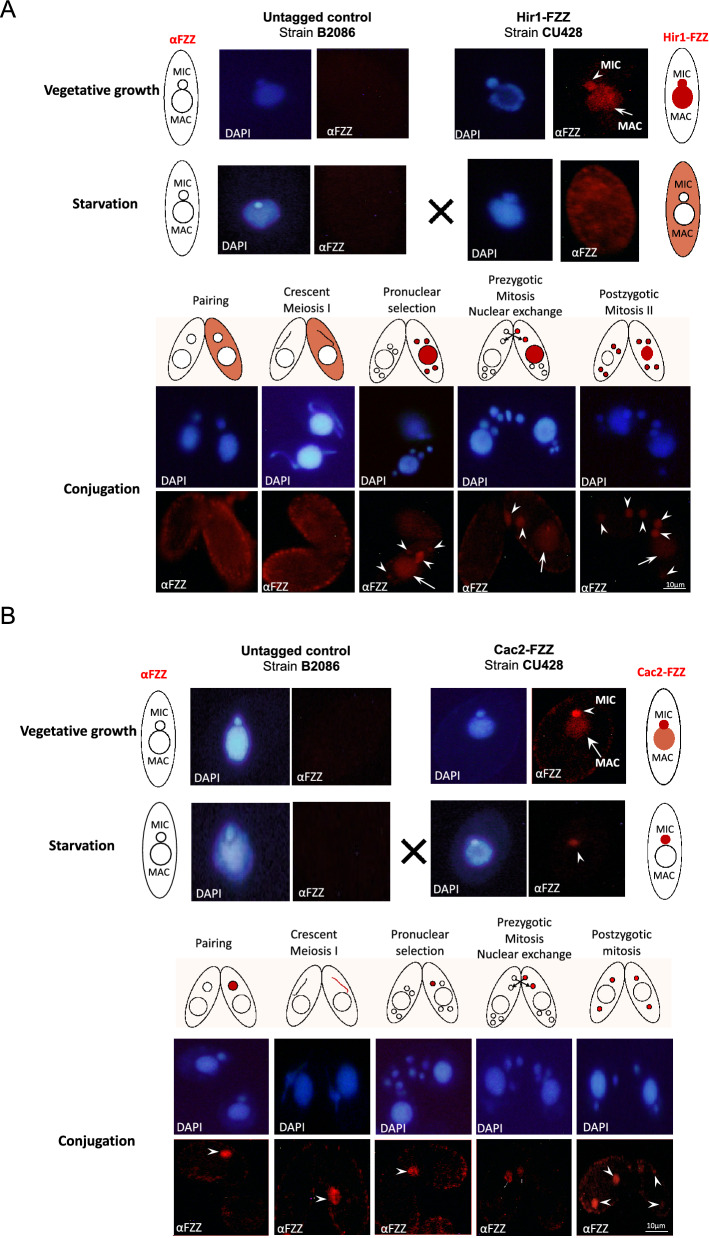
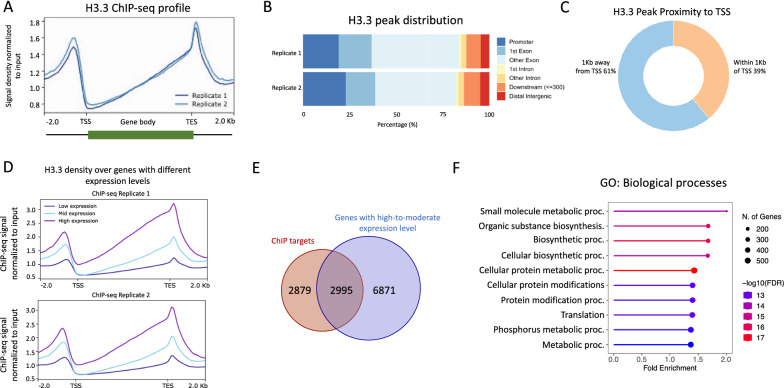
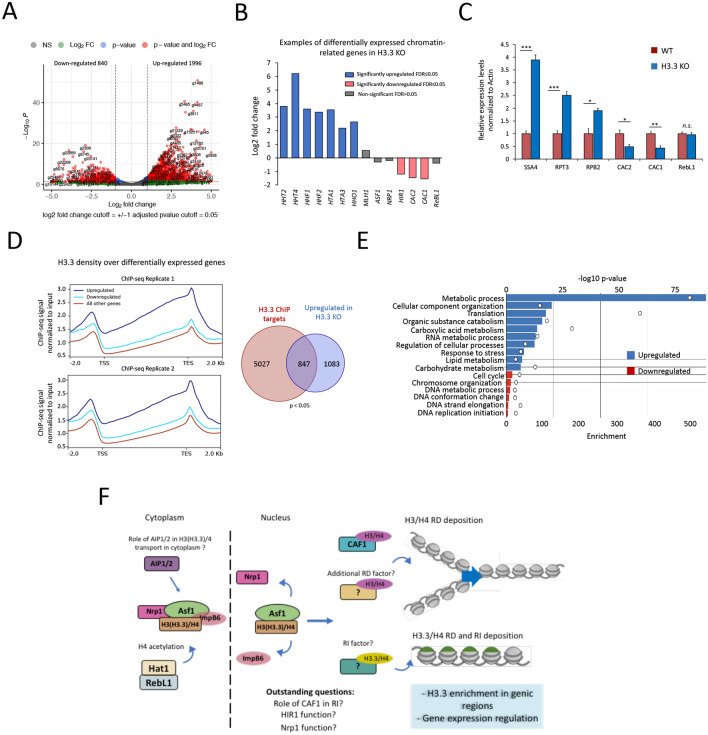
Results: We used the nuclear dimorphic ciliate protozoan, Tetrahymena thermophila, to investigate the dynamics of H3 variant function in evolutionarily divergent eukaryotes. Functional proteomics and immunofluorescence analyses of H3.1 and H3.3 revealed a highly conserved role for Nrp1 and Asf1 histone chaperones in nuclear influx of histones. Cac2, a putative subunit of H3.1 deposition complex CAF1, is not required for growth, whereas the expression of the putative ortholog of the H3.3-specific chaperone Hir1 is essential in Tetrahymena. Our results indicate that Cac2 and Hir1 have distinct localization patterns during different stages of the Tetrahymena life cycle and suggest that Cac2 might be dispensable for chromatin assembly. ChIP-seq experiments in growing Tetrahymena show H3.3 enrichment over the promoters, gene bodies, and transcription termination sites of highly transcribed genes. H3.3 knockout followed by RNA-seq reveals large-scale transcriptional alterations in functionally important genes.

Conclusion: Our results provide an evolutionary perspective on H3.3's conserved role in maintaining the transcriptional landscape of cells and on the emergence of specialized chromatin assembly pathways.

Keywords: Asf1; CAF1; Chromatin; Epigenetics; Functional proteomics; H3.3; HIRA; Histone variant; NASP; RBBP4/7; Tetrahymena.


Conflict of interest statement

The authors declare no competing interests.

Figures

Fig. 1
Fig. 1
Identification of the H3 and H3.3 interactomes in Tetrahymena. A Top, Neighbor-joining phylogenetic analysis of RD and RI H3 proteins. Different species are highlighted in different colors. The numbers on the branches represent confidence values based on 1000 bootstrap replicates. Red stars indicate ciliates. Accession numbers are shown in brackets. Silhouettes adapted from http://phylopic.org/. Bottom, Western blotting analysis using whole cell lysates prepared from vegetative Tetrahymena cells expressing H3-GFP (H3 ∼ 15.43 kDa + GFP ∼ 27 kDa) and H3.3-FZZ (H3.3 ∼ 15.5 kDa + FZZ ∼ 18 kDa). The blots were probed with the indicated antibodies. B Left, Schematic representation of tandem affinity purification procedure. Right, Network representation of high-confidence (FDR ≤ 0.01) H3, H3.3, and H4 co-purifying proteins. See Additional file 1: Tables S1, S2 for complete AP-MS results. C Comparative domain analysis of Tetrahymena Nrp1 protein against Homo sapiens, Xenopus laevis, and Saccharomyces cerevisiae orthologs. Overall sequence identity among the orthologs is shown on the right. D Western blotting analysis using whole cell lysates prepared from growing Tetrahymena cells expressing Nrp1-FZZ (Nrp1∼ 59 kDa + FZZ ∼ 18 kDa). The blot was probed with the indicated antibodies. E Dot plot representation of high-confidence (FDR ≤ 0.01) Nrp1 and Asf1Tt co-purifying proteins from vegetatively growing Tetrahymena. Inner circle color shows the average spectral count, the circle size indicates the relative prey abundance, and the circle outer edge is the SAINT FDR. See Additional file 1: Table S3 for complete AP-MS results for Nrp1. F Indirect immunofluorescence analysis of Nrp1-GFP in growing Tetrahymena. Nrp1 localization at different cell cycle stages is also indicated in the left panel. Untagged wildtype cells were used as a control. DAPI stained the nuclei, and the position of the MAC and MIC is indicated with arrows and arrowheads, respectively
Fig. 2
Fig. 2
Tetrahymena Cac2 and Hir1 have highly conserved Asf1-interacting B-domain-like sequences. A Left, Neighbor-joining phylogenetic analysis of HIRA and Cac2 proteins. Different subfamilies are highlighted in different colors. The numbers on the branches represent confidence values based on 1000 bootstrap replicates. Right, Comparative domain analysis of Tetrahymena Cac2Tt and Hir1Tt proteins against H. sapiens, and S. cerevisiae orthologs. Highly conserved B-domain sequences are shown as multiple sequence alignments for both Cac2Tt and Hir1Tt proteins. B Visualization of the predicted binding interface between TTHERM_00219420 (Cac2) and TTHERM_00442300 (Asf1). Cac2Tt is colored in cyan; Asf1Tt is colored green. The B-domain of Cac2Tt is highlighted in red. Labeled residues (K87-G531, D89-K534, R146-D372) are predicted to form polar intermolecular contacts between Asf1Tt and Cac2Tt within 3 Å, as well as an intramolecular π interaction (F393-K535) involving a Lysine residue within the B-domain of Cac2Tt (T527–Y545). All interactions are shown as dashed yellow lines. C Western blotting analysis using whole cell lysates prepared from growing Tetrahymena cells expressing Cac2Tt -FZZ (left; Cac2 ∼ 63 kDa + FZZ ∼ 18 kDa) and Hir1Tt-FZZ (right; Hir1 ∼ 117 kDa + FZZ ∼ 18 kDa). The blots were probed with the indicated antibodies. D Dot plot representation of the interaction partners identified with Cac2Tt, Hir1Tt, Hat1Tt, and RebL1 in growing Tetrahymena cells. Inner circle color shows the average spectral count, the circle size indicates the relative prey abundance, and the circle outer edge is the SAINT FDR. See Additional file 1: Tables S5, S6, and S8 for complete AP-MS data
Fig. 3
Fig. 3
Tetrahymena Cac2 and Hir1 knockout analysis. A Left, Schematic representation of homologous recombination-mediated gene replacement strategy. The gene targeting vector carries a NEO drug marker which is flanked by 1 kb of DNA that shares sequence identity to upstream and downstream regions of the gene of interest. Right, RT-PCR analyses of ∆HIR1 and ∆CAC2 strains in comparison with wildtype Tetrahymena cells. The positions of the primers encompassing exon–exon junctions are indicated for both ∆HIR1 and ∆CAC2. Bands were observed at the expected sizes. Primers specific to unrelated genes were used as loading controls. B Indirect immunofluorescence analysis of Hir1Tt-, Cac2Tt-, and Asf1Tt-FZZ in growing Tetrahymena. DAPI was used to stain the nuclei, and the positions of the MAC and MIC are indicated with arrows and arrowheads, respectively. C Indirect immunofluorescence analysis of RebL1-FZZ in dividing cells during Tetrahymena vegetative growth. DAPI was used to stain the nuclei, and the positions of the MAC and MIC are indicated with arrows and arrowheads, respectively. RebL1 localization at different cell cycle stages is also indicated as a cartoon in the left panel
Fig. 4
Fig. 4
Cac2Tt and Hir1Tt show distinct localization during growth and development in Tetrahymena. A HirTt-FZZ localizes to both MAC and MIC during vegetative growth and exclusively to the cytoplasm during starvation. HirTt-FZZ cells were mated with untagged WT cells of different mating type. During conjugation, Hir1Tt-FZZ localizes to the four meiotic products and the parental MAC after the completion of meiosis. Hir1Tt-FZZ staining persisted in the parental MAC and the selected pronucleus only. B Cac2Tt-FZZ localizes predominantly to the MIC and faintly to the MAC during vegetative growth. Cac2Tt-FZZ signal was observed exclusively in the MIC during starvation. During conjugation, Cac2Tt-FZZ staining was observed in the crescent MIC as well as in the selected pronucleus. Note: Nuclear events are depicted above the images taken for conjugating cells during various developmental stages. DAPI was used to stain the nuclei. The signal observed in both mating types at the anlagen stage is due to the mixing of cellular contents between the pairing cells. CU428, mating type VII, and B2086, mating type II are the strain numbers of the strains obtained from the Tetrahymena Stock Center, Cornell University
Fig. 5
Fig. 5
Genome-wide occupancy map of H3.3 in Tetrahymena. A Standardized metagene plot of H3.3 occupancy. B Bar plot depicting the H3.3 ChIP peak distribution with respect to annotated genomic features. C H3.3 ChIP peak distribution with respect to annotated TSS ± 1 kb. D Metagene plot showing the input normalized H3.3 ChIP-seq density over genes classified based on their expression levels during Tetrahymena growth. E Venn diagram showing the overlap of H3.3 bound genes with those genes that are classified as high-to-moderately expressed during Tetrahymena vegetative growth. F Lollipop plot representation of Gene Ontology (GO) terms significantly enriched in H3.3 ChIP-seq target genes (Q < 0.05). Also see Additional file 2: Fig. S14
Fig. 6
Fig. 6
Loss of H3.3 remodels transcriptional landscape in Tetrahymena. A Volcano plot representation of genes differentially expressed in H3.3 knockout cells in comparison with the wildtype Tetrahymena cells. Each dot represents a single gene. Genes with FDR ≤ 0.05 were considered significant. Significant differential genes are shown as red dots with labels indicating the gene name. A legend is provided. NS: non-significant. B Bar plot showing the RNA-seq expression levels of selected genes in H3.3 KO cells. C Bar graphs showing RT-qPCR results to examine the differential expression of selected genes in H3.3 KO cells. The experiments were performed in biological triplicates, and p-values were calculated using the student’s t-test (∗∗∗p ≤ 0.001, ∗∗p ≤ 0.01, ∗p ≤ 0.05, n.s.: non-significant). Error bars represent standard error of mean (SEM). D Metagene plot showing the input normalized H3.3 ChIP-seq density over differentially expressed genes in H3.3 KO cells in comparison with unaffected genes (left). Venn diagram represents the overlap of significantly upregulated genes in H3.3 KO cells with H3.3 ChIP targets (right). P-value was calculated using the hypergeometric test. E GO enrichment analysis related to biological processes for differentially expressed genes in H3.3 KO cells. F Proposed model for H3 (H3.3)–H4 nuclear transport and chromatin assembly in Tetrahymena. The roles of Nrp1-Asf1 in H3/H4 transport and CAF1 in RD chromatin assembly appear conserved in Tetrahymena, whereas RI deposition, and identity of its cognate chaperone, requires further investigation

Similar articles

Cited by

References

    1. Zhou K, Gaullier G, Luger K. Nucleosome structure and dynamics are coming of age. Nat Struct Mol Biol. 2018;26:3–13. doi: 10.1038/s41594-018-0166-x. - DOI - PMC - PubMed
    1. Martire S, Banaszynski LA. The roles of histone variants in fine-tuning chromatin organization and function. Nat Rev Mol Cell Biol. 2020;21:522–541. doi: 10.1038/s41580-020-0262-8. - DOI - PMC - PubMed
    1. Weber CM, Henikoff S. Histone variants: dynamic punctuation in transcription. Genes Dev. 2014;28:672–682. doi: 10.1101/gad.238873.114. - DOI - PMC - PubMed
    1. Talbert PB, Ahmad K, Almouzni G, Ausió J, Berger F, Bhalla PL, et al. A unified phylogeny-based nomenclature for histone variants. Epigenetics Chromatin. 2012;5:7. doi: 10.1186/1756-8935-5-7. - DOI - PMC - PubMed
    1. Goldberg AD, Banaszynski LA, Noh K-M, Lewis PW, Elsaesser SJ, Stadler S, et al. Distinct factors control histone variant H3.3 localization at specific genomic regions. Cell. 2010;140:678–691. doi: 10.1016/j.cell.2010.01.003. - DOI - PMC - PubMed

Publication types