

Identification of cell barcodes from long-read single-cell RNA-seq with BLAZE
- PMID: 37024980
- PMCID: PMC10077662
- DOI: 10.1186/s13059-023-02907-y
Identification of cell barcodes from long-read single-cell RNA-seq with BLAZE
Abstract
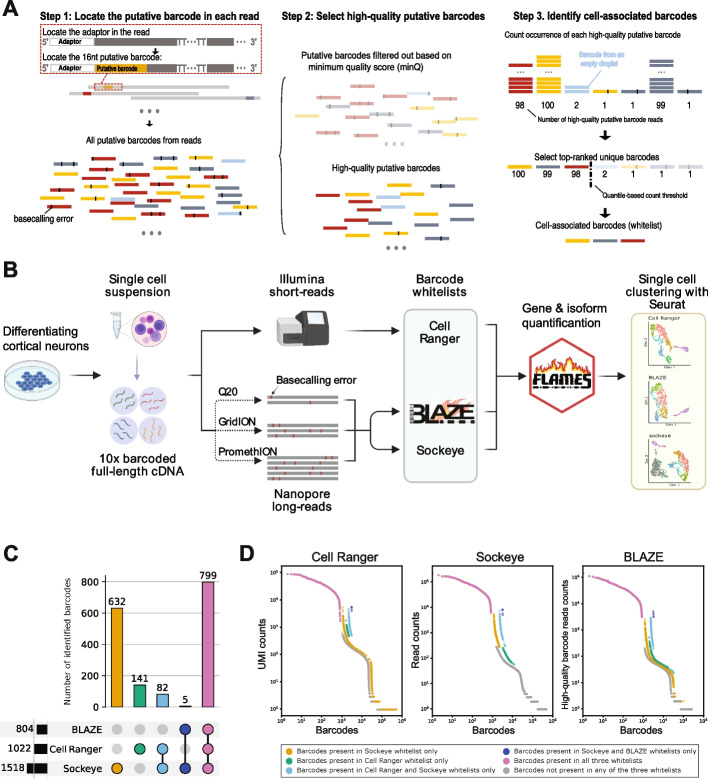
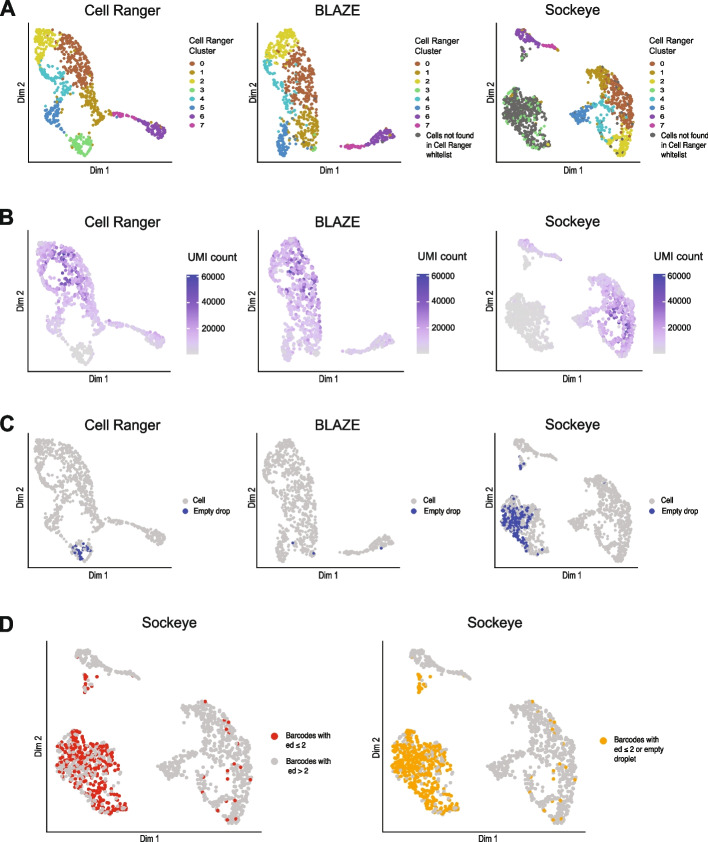
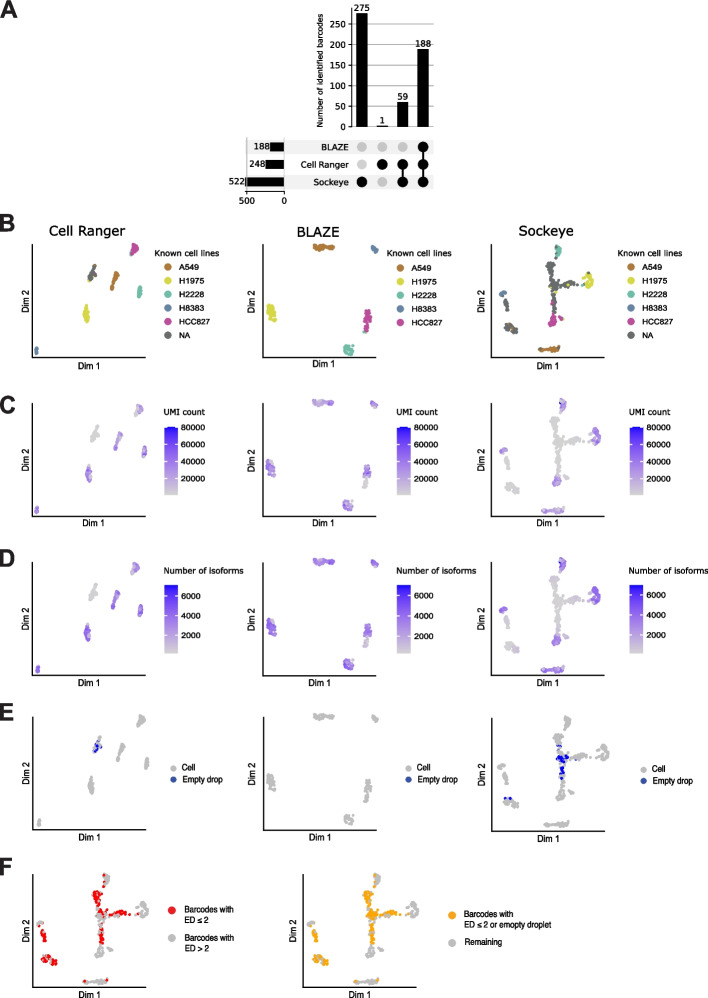
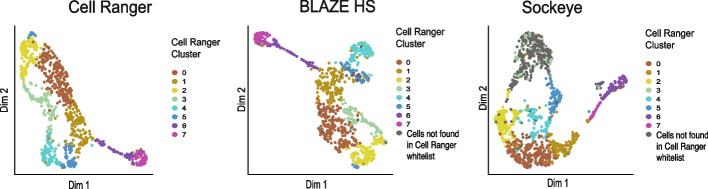
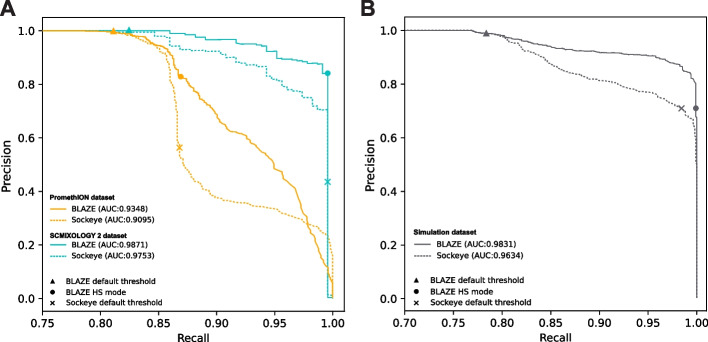
Long-read single-cell RNA sequencing (scRNA-seq) enables the quantification of RNA isoforms in individual cells. However, long-read scRNA-seq using the Oxford Nanopore platform has largely relied upon matched short-read data to identify cell barcodes. We introduce BLAZE, which accurately and efficiently identifies 10x cell barcodes using only nanopore long-read scRNA-seq data. BLAZE outperforms the existing tools and provides an accurate representation of the cells present in long-read scRNA-seq when compared to matched short reads. BLAZE simplifies long-read scRNA-seq while improving the results, is compatible with downstream tools accepting a cell barcode file, and is available at https://github.com/shimlab/BLAZE .
© 2023. The Author(s).
Conflict of interest statement
Y.Y, Y.D.P, R.D.P, and M.B.C have received support from Oxford Nanopore Technologies (ONT) to present their findings at scientific conferences. However, ONT played no role in the study design, execution, analysis, or publication.
Figures
Similar articles
-
Advances in long-read single-cell transcriptomics.Hum Genet. 2024 Oct;143(9-10):1005-1020. doi: 10.1007/s00439-024-02678-x. Epub 2024 May 24. Hum Genet. 2024. PMID: 38787419 Free PMC article. Review.
-
Systematic evaluation of single-cell RNA-seq analyses performance based on long-read sequencing platforms.J Adv Res. 2025 May;71:141-153. doi: 10.1016/j.jare.2024.05.020. Epub 2024 May 22. J Adv Res. 2025. PMID: 38782298 Free PMC article.
-
Millefy: visualizing cell-to-cell heterogeneity in read coverage of single-cell RNA sequencing datasets.BMC Genomics. 2020 Mar 3;21(1):177. doi: 10.1186/s12864-020-6542-z. BMC Genomics. 2020. PMID: 32122302 Free PMC article.
-
Dimensionality reduction and visualization of single-cell RNA-seq data with an improved deep variational autoencoder.Brief Bioinform. 2023 May 19;24(3):bbad152. doi: 10.1093/bib/bbad152. Brief Bioinform. 2023. PMID: 37088976
-
Machine learning and statistical methods for clustering single-cell RNA-sequencing data.Brief Bioinform. 2020 Jul 15;21(4):1209-1223. doi: 10.1093/bib/bbz063. Brief Bioinform. 2020. PMID: 31243426 Review.
Cited by
-
Transcriptomics in the era of long-read sequencing.Nat Rev Genet. 2025 Mar 28. doi: 10.1038/s41576-025-00828-z. Online ahead of print. Nat Rev Genet. 2025. PMID: 40155769 Review.
-
A spatial long-read approach at near-single-cell resolution reveals developmental regulation of splicing and polyadenylation sites in distinct cortical layers and cell types.bioRxiv [Preprint]. 2025 Jun 10:2025.06.10.658877. doi: 10.1101/2025.06.10.658877. bioRxiv. 2025. PMID: 40661641 Free PMC article. Preprint.
-
AsaruSim: a single-cell and spatial RNA-Seq Nanopore long-reads simulation workflow.Bioinformatics. 2025 Mar 4;41(3):btaf087. doi: 10.1093/bioinformatics/btaf087. Bioinformatics. 2025. PMID: 39985444 Free PMC article.
-
Advances in long-read single-cell transcriptomics.Hum Genet. 2024 Oct;143(9-10):1005-1020. doi: 10.1007/s00439-024-02678-x. Epub 2024 May 24. Hum Genet. 2024. PMID: 38787419 Free PMC article. Review.
-
Understanding isoform expression by pairing long-read sequencing with single-cell and spatial transcriptomics.Genome Res. 2024 Nov 20;34(11):1735-1746. doi: 10.1101/gr.279640.124. Genome Res. 2024. PMID: 39567235 Free PMC article. Review.
References
-
- Han X, Zhou Z, Fei L, Sun H, Wang R, Chen Y, Chen H, Wang J, Tang H, Ge W, et al. Construction of a human cell landscape at single-cell level. Nature. 2020;581:303–309. - PubMed
-
- Hagemann-Jensen M, Ziegenhain C, Chen P, Ramsköld D, Hendriks G-J, Larsson AJM, Faridani OR, Sandberg R. Single-cell RNA counting at allele and isoform resolution using Smart-seq3. Nat Biotechnol. 2020;38:708–714. - PubMed
Publication types
MeSH terms
Substances
LinkOut - more resources
Full Text Sources
Molecular Biology Databases
