. 2023 Apr 6;18(1):72.
doi: 10.1186/s13023-023-02666-w.

Chenodeoxycholic acid rescues axonal degeneration in induced pluripotent stem cell-derived neurons from spastic paraplegia type 5 and cerebrotendinous xanthomatosis patients

Affiliations

Chenodeoxycholic acid rescues axonal degeneration in induced pluripotent stem cell-derived neurons from spastic paraplegia type 5 and cerebrotendinous xanthomatosis patients

Yongchao Mou et al. Orphanet J Rare Dis. .

Abstract

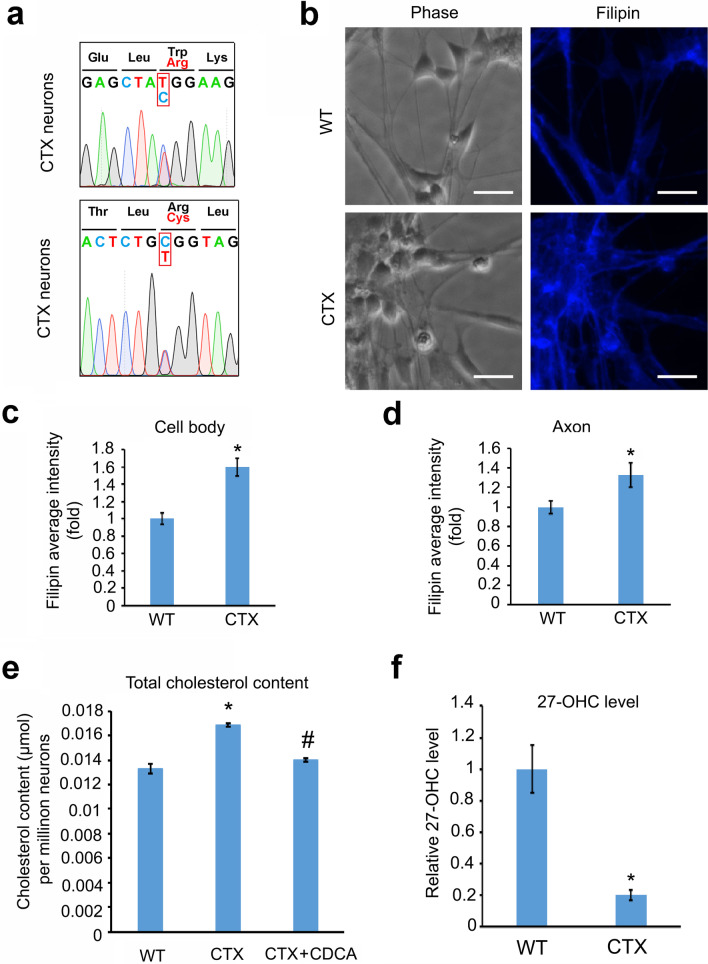
Background: Biallelic mutations in CYP27A1 and CYP7B1, two critical genes regulating cholesterol and bile acid metabolism, cause cerebrotendinous xanthomatosis (CTX) and hereditary spastic paraplegia type 5 (SPG5), respectively. These rare diseases are characterized by progressive degeneration of corticospinal motor neuron axons, yet the underlying pathogenic mechanisms and strategies to mitigate axonal degeneration remain elusive.

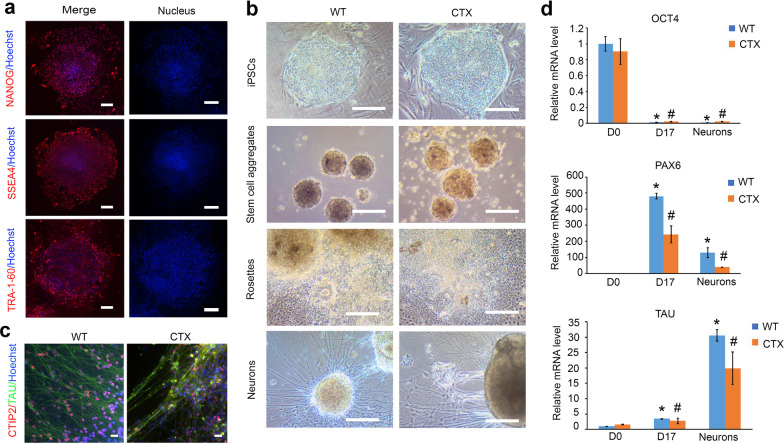
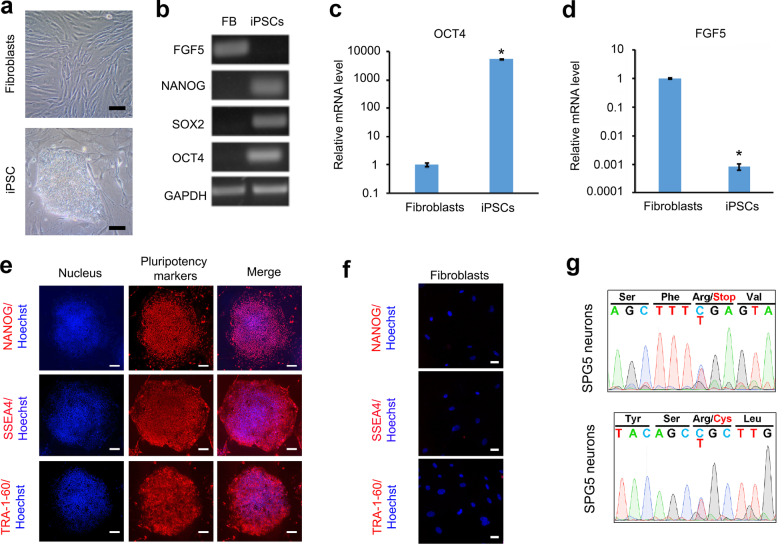
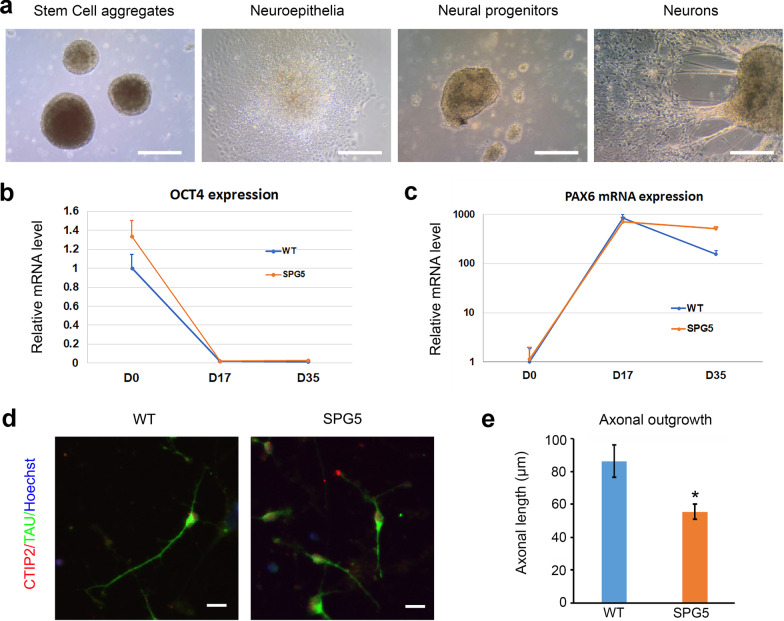
Methods: To generate induced pluripotent stem cell (iPSC)-based models for CTX and SPG5, we reprogrammed patient skin fibroblasts into iPSCs by transducing fibroblast cells with episomal vectors containing pluripotency factors. These patient-specific iPSCs, as well as control iPSCs, were differentiated into cortical projection neurons (PNs) and examined for biochemical alterations and disease-related phenotypes.

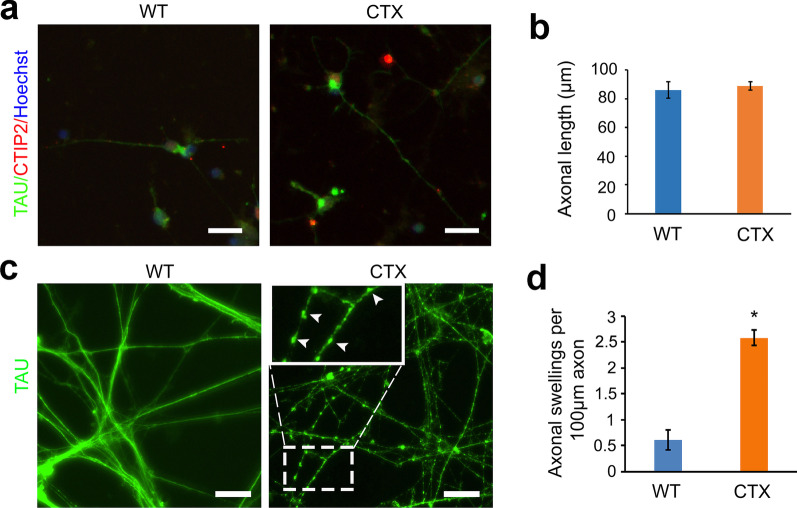
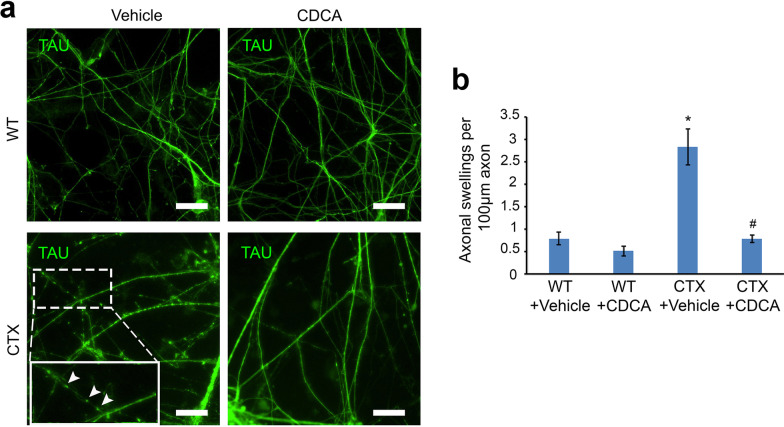
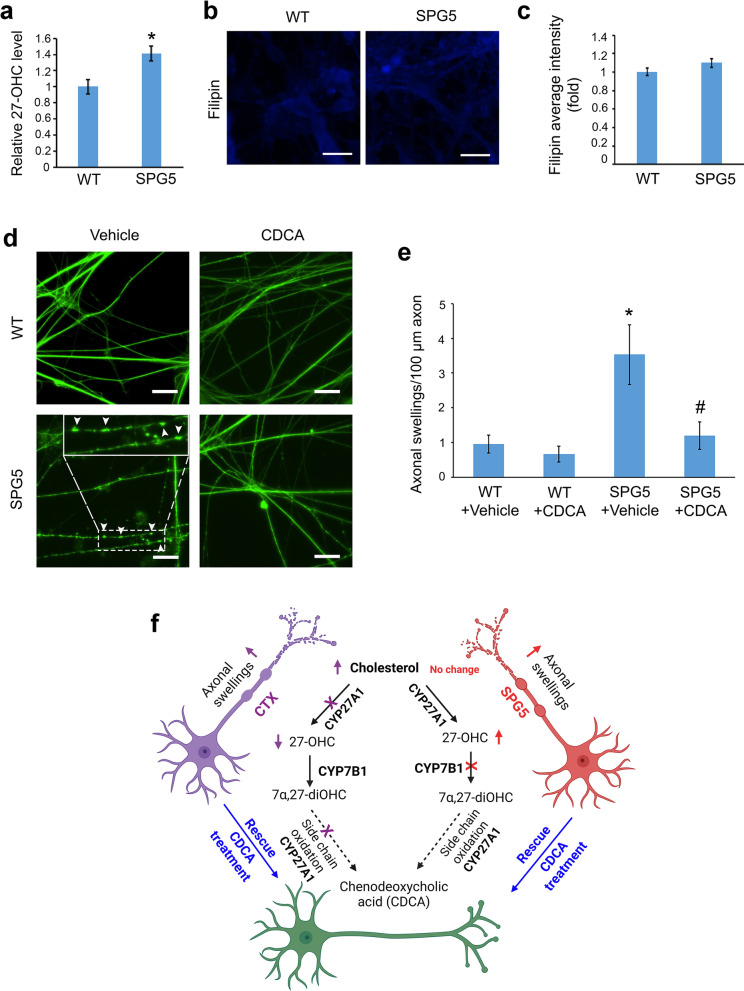
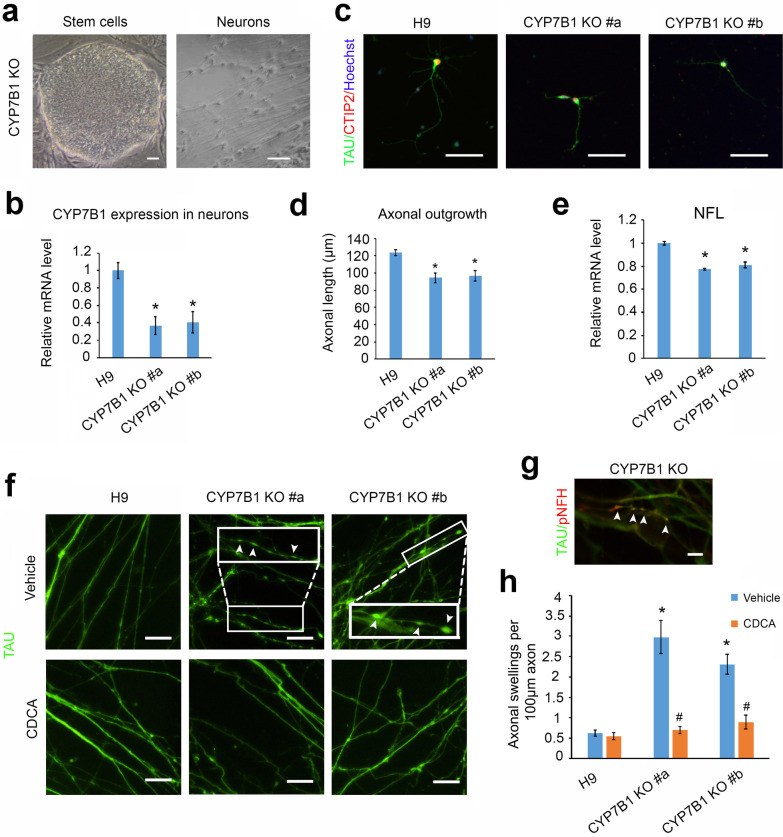
Results: CTX and SPG5 patient iPSC-derived cortical PNs recapitulated several disease-specific biochemical changes and axonal defects of both diseases. Notably, the bile acid chenodeoxycholic acid (CDCA) effectively mitigated the biochemical alterations and rescued axonal degeneration in patient iPSC-derived neurons. To further examine underlying disease mechanisms, we developed CYP7B1 knockout human embryonic stem cell (hESC) lines using CRISPR-cas9-mediated gene editing and, following differentiation, examined hESC-derived cortical PNs. Knockout of CYP7B1 resulted in similar axonal vesiculation and degeneration in human cortical PN axons, confirming a cause-effect relationship between gene deficiency and axonal degeneration. Interestingly, CYP7B1 deficiency led to impaired neurofilament expression and organization as well as axonal degeneration, which could be rescued with CDCA, establishing a new disease mechanism and therapeutic target to mitigate axonal degeneration.

Conclusions: Our data demonstrate disease-specific lipid disturbances and axonopathy mechanisms in human pluripotent stem cell-based neuronal models of CTX and SPG5 and identify CDCA, an established treatment of CTX, as a potential pharmacotherapy for SPG5. We propose this novel treatment strategy to rescue axonal degeneration in SPG5, a currently incurable condition.

Keywords: Axonal degeneration; Cerebrotendinous xanthomatosis; Chenodeoxycholic acid; Induced pluripotent stem cell; Spastic paraplegia type 5.


Conflict of interest statement

The authors declare that they have no competing financial interests.

Figures

Fig. 1
Fig. 1
CTX iPSC characterization and cortical PN differentiation. a Immunostaining of NANOG, SSEA4, and TRA-1-60 in CTX iPSCs. Red: NANOG, SSEA, TRA-1-60, respectively. Blue indicates Hoechst-stained nuclei. Scale bar, 100 µm. b Representative phase-contrast images of CTX iPSCs at different stages of cortical PN differentiation including stem cell colony, stem cell aggregates (also known as embryoid bodies), neuroepithelial cells (rosettes), and neurons. Scale bar: 200 μm. c Immunostaining images of CTIP2+ and TAU+ cortical PNs in WT and CTX neural cultures. Red: CTIP2; green: TAU; blue: Hoechst. Scale bar, 20 μm. d qPCR quantification of pluripotency (OCT4), neural progenitor (PAX6), and neuronal (TAU) gene expression at different stages of cortical PN differentiation in WT and CTX cells. Data are represented as means ± SEM. *p < 0.05 compared to D0 WT, #p < 0.05 compared to D0 CTX by Dunnett’s test after ANOVA
Fig. 2
Fig. 2
Axonal degeneration of cortical PNs derived from CTX iPSCs. a Representative images showing neurite outgrowth of WT and CTX cortical PNs, 2 days after plating, with immunostaining for CTIP2 and TAU. Red: CTIP2; green: TAU; blue: Hoechst. Scale bar, 20 μm. b Quantification of axonal outgrowth of WT and CTX cortical PNs. Data are represented as means ± SEM, with no significant differences between CTX and WT groups. c Representative pictures of axonal swellings, with immunostaining for TAU in WT and CTX cortical PNs. Accumulated axonal swellings were observed in CTX neurons; representative images of axonal swellings are magnified and indicated with arrowheads. Green: TAU. Scale bar: 20 μm. d Quantitative graph showing axonal swellings of WT and CTX cortical PNs. Data are represented as means ± SEM. *p < 0.05 compared to WT by two-sided Student t-test
Fig. 3
Fig. 3
Cholesterol accumulation in CTX cortical PNs. a Genomic DNA sequencing confirmed the compound heterozygous mutations c.397 T > C, p.Trp133Arg and c.1183C > T, p.Arg395Cys in the CYP27A1 gene in CTX PNs. b Representative images showing Filipin staining in WT and CTX cortical PNs. Blue: Filipin. Scale bar, 20 μm. c and d Quantitative graphs showing the Filipin intensity fold change in cell body (c) and axon (d) of WT and CTX cortical PNs. Filipin staining intensities in CTX neurons were significantly increased compared to control neurons. e Total cholesterol content in WT and CTX cortical PNs, and CTX cortical PNs treated with CDCA. f Relative 27-OH-cholesterol levels in CTX cortical PNs were significantly reduced compared to WT neurons. Data are represented as means ± SEM. *p < 0.05 compared to WT by two-sided Student t-test (for c, d and f). *p < 0.05 compared to WT, #p < 0.05 compared to CTX control by Tukey’s range test after ANOVA (for e)
Fig. 4
Fig. 4
Axonal swellings of CTX cortical PNs after treatment with vehicle or CDCA. a Representative immunostaining images of TAU in WT and CTX cortical PNs after treatment with vehicle or CDCA. Accumulated axonal swellings are observed in CTX vehicle-treated neurons. Representative axonal swellings are magnified and indicated with arrowheads. Scale bar, 20 μm. b Quantitation of axonal swellings in WT and CTX cortical PNs after treatment with vehicle or CDCA. Axonal swellings in CTX neurons were significantly suppressed by CDCA treatment. Data are represented as means ± SEM. *p < 0.05 compared to WT groups, #p < 0.05 compared to CTX + vehicle by Tukey’s range test after ANOVA
Fig. 5
Fig. 5
Establishment and characterization of SPG5 iPSCs. a Phase-contrast images of SPG5 dermal fibroblasts and iPSCs. b PCR gel images showing the expression of FGF5, NANOG, SOX2, and OCT4 in SPG5 fibroblasts (FB) and iPSCs. GAPDH is a housekeeping gene. c and d The mRNA expression of OCT4 and FGF5 in fibroblasts and iPSCs by qRT-PCR. e Immunostaining showing the protein expression of pluripotency markers NANOG, SSEA4, and TRA-1-60 (red) in iPSCs. Blue: Hoechst. f No expression of pluripotency markers was detected in SPG5 fibroblasts. Blue: Hoechst. g Genomic DNA sequencing confirmed the compound heterozygous mutations c.334C > T, p.Arg112* and c.1456C > T, p.Arg486Cys in the CYP7B1 gene. Data are represented as means ± SD. *p < 0.05 compared to fibroblast cells by two-sided Student’s t-test. Scale bars, 100 µm (a) and 50 µm (e and f)
Fig. 6
Fig. 6
Reduced axonal outgrowth of SPG5 iPSC-derived cortical PNs. a Representative phase-contrast images showing different stages during differentiation of cortical PNs from SPG5 iPSCs. Scale bar, 100 µm. b and c qPCR quantification of OCT4 and PAX6 expression at different time points during the differentiation of cortical PNs from WT and SPG5 iPSCs: D0 (Day 0), stem cell stage. D17 (day 17), neuroepithelial cells, D35 (day 35), neurons. Expression of both genes at day 17 and day 35 was significantly altered compared to day 0 by Dunnett’s test. d Double immunostaining for TAU and CTIP2 in WT and SPG5 cortical PNs. Red: CTIP2; green: TAU; blue: Hoechst. Scale bar, 20 µm. e Axonal outgrowth quantification of WT and SPG5 cortical PNs revealed a significant reduction of axonal length in SPG5 cortical PNs compared to WT neurons. Data are represented as means ± SD. *p < 0.05 compared to WT by two-sided Student t-test
Fig. 7
Fig. 7
Impaired cholesterol metabolism and axonal swellings in SPG5 cortical PNs. a Relative 27-OH-cholesterol levels in SPG5 cortical PNs were significantly increased compared to WT controls. *p < 0.05 compared to WT by two-sided Student t-test. b Filipin staining was used to determine cholesterol levels in cultures. Representative pictures showed Filipin staining (blue) of WT and SPG5 cortical PNs. Scale bar, 20 µm. c Quantification of Filipin average intensity showed similar levels in WT and SPG5 forebrain neurons. d Representative pictures of TAU immunostaining (green) in WT and SPG5 cortical PNs after vehicle or CDCA treatment. Axonal swellings are magnified and indicated with arrowheads. Scale bar, 20 µm. e Quantification of axonal swellings in WT and SPG5 cortical PNs. Data are represented as means ± SEM. *p < 0.05 compared to WT groups, #p < 0.05 compared to SPG5 + vehicle by Tukey’s range test after ANOVA. (f) Schematic summary of the iPSC models of SPG5 and CTX (created with BioRender.com)
Fig. 8
Fig. 8
CDCA treatment rescued axonal degeneration induced by loss of CYP7B1. a Representative phase-contrast image showing CYP7B1 KO stem cell clones generated via CRISPR-cas9-mediated gene editing of hESCs. These ESCs were then differentiated into neurons. Scale bar, 50 µm. b qPCR showing mRNA expression of CYP7B1 in H9, CYP7B1 KO #a, and CYP7B1 KO #b cortical PNs. c Double immunostaining of TAU and CTIP2 in the indicated cortical PNs. Red: CTIP2; green: TAU; blue: Hoechst. Scale bar, 50 µm. d Axonal outgrowth quantifications of the indicated cortical PNs. e Quantifications of NFL expression in the indicated PNs. f Representative images showing immunostaining of TAU in H9, CYP7B1 KO #a, and CYP7B1 KO #b cortical PNs after vehicle or CDCA treatment. Axonal swellings are magnified and indicated with arrowheads. Scale bar, 20 µm. g A representative image showing double immunostaining of TAU and pNFH in CYP7B1 KO cortical PN axon swellings (arrowheads). Scale bar, 5 µm. h Quantification of TAU+ axonal swellings in H9, CYP7B1 KO #a, and CYP7B1 KO #b cortical PNs after vehicle or CDCA treatment. Data are represented as means ± SEM. *p < 0.05 compared to H9 neurons treated with vehicle by Dunnett’s test after ANOVA (b, d, e, and h). #p < 0.05 compared to CYP7B1 KO vehicle-treated group by two-sided Student t-test (h)

Similar articles

Cited by

References

    1. Fester L, Zhou L, Butow A, Huber C, von Lossow R, Prange-Kiel J, et al. Cholesterol-promoted synaptogenesis requires the conversion of cholesterol to estradiol in the hippocampus. Hippocampus. 2009;19(8):692–705. doi: 10.1002/hipo.20548. - DOI - PubMed
    1. Goritz C, Mauch DH, Pfrieger FW. Multiple mechanisms mediate cholesterol-induced synaptogenesis in a CNS neuron. Mol Cell Neurosci. 2005;29(2):190–201. doi: 10.1016/j.mcn.2005.02.006. - DOI - PubMed
    1. Abdel-Khalik J, Yutuc E, Crick PJ, Gustafsson JA, Warner M, Roman G, et al. Defective cholesterol metabolism in amyotrophic lateral sclerosis. J Lipid Res. 2017;58(1):267–278. doi: 10.1194/jlr.P071639. - DOI - PMC - PubMed
    1. Bjorkhem I, Leoni V, Meaney S. Genetic connections between neurological disorders and cholesterol metabolism. J Lipid Res. 2010;51(9):2489–2503. doi: 10.1194/jlr.R006338. - DOI - PMC - PubMed
    1. Tsaousidou MK, Ouahchi K, Warner TT, Yang Y, Simpson MA, Laing NG, et al. Sequence alterations within CYP7B1 implicate defective cholesterol homeostasis in motor-neuron degeneration. Am J Hum Genet. 2008;82(2):510–515. doi: 10.1016/j.ajhg.2007.10.001. - DOI - PMC - PubMed

Publication types

MeSH terms

LinkOut - more resources