. 2023 Jun;14(3):1410-1423.
doi: 10.1002/jcsm.13222. Epub 2023 Apr 6.

A novel orthotopic mouse model replicates human lung cancer cachexia

Affiliations

A novel orthotopic mouse model replicates human lung cancer cachexia

Wouter R P H van de Worp et al. J Cachexia Sarcopenia Muscle. 2023 Jun.

Abstract

Introduction: Cancer cachexia, highly prevalent in lung cancer, is a debilitating syndrome characterized by involuntary loss of skeletal muscle mass and is associated with poor clinical outcome, decreased survival and negative impact on tumour therapy. Various lung tumour-bearing animal models have been used to explore underlying mechanisms of cancer cachexia. However, these models do not simulate anatomical and immunological features key to lung cancer and associated muscle wasting. Overcoming these shortcomings is essential to translate experimental findings into the clinic. We therefore evaluated whether a syngeneic, orthotopic lung cancer mouse model replicates systemic and muscle-specific alterations associated with human lung cancer cachexia.

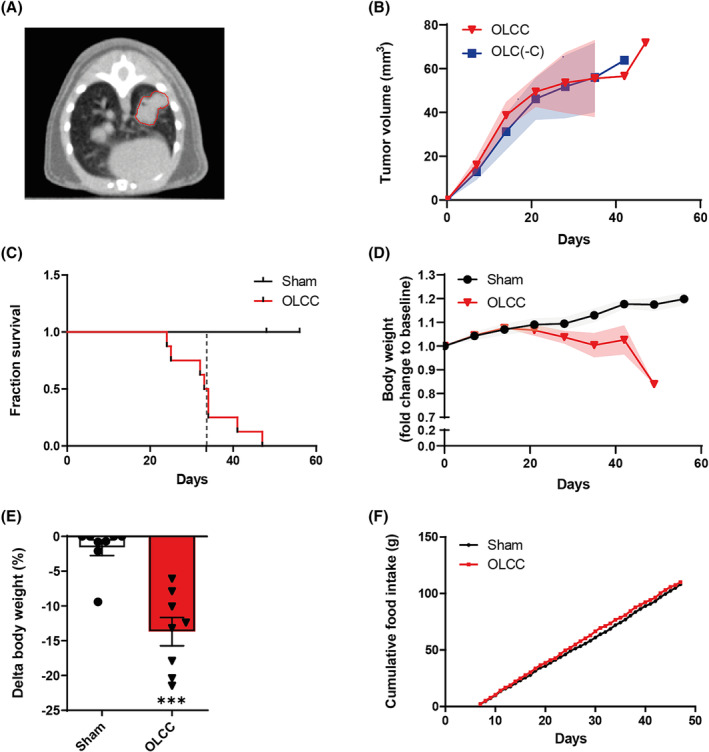
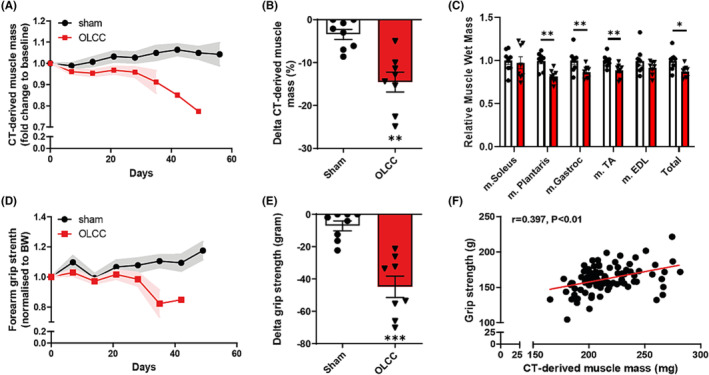
Methods: Immune competent, 11 weeks old male 129S2/Sv mice, were randomly allocated to either (1) sham control group or (2) tumour-bearing group. Syngeneic lung epithelium-derived adenocarcinoma cells (K-rasG12D ; p53R172HΔG ) were inoculated intrapulmonary into the left lung lobe of the mice. Body weight and food intake were measured daily. At baseline and weekly after surgery, grip strength was measured and tumour growth and muscle volume were assessed using micro cone beam CT imaging. After reaching predefined surrogate survival endpoint, animals were euthanized, and skeletal muscles of the lower hind limbs were collected for biochemical analysis.

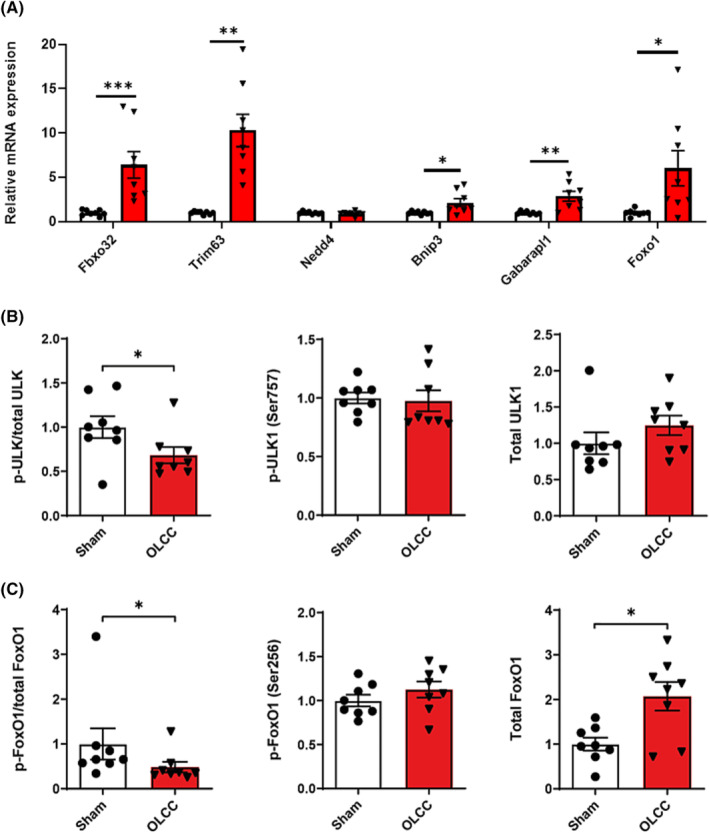
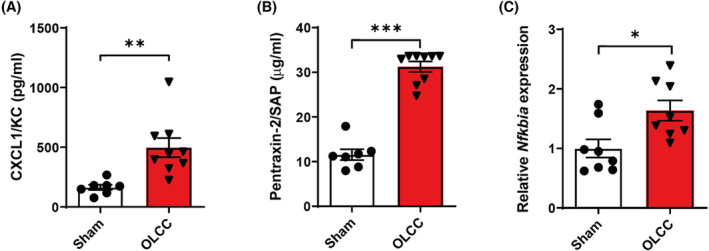
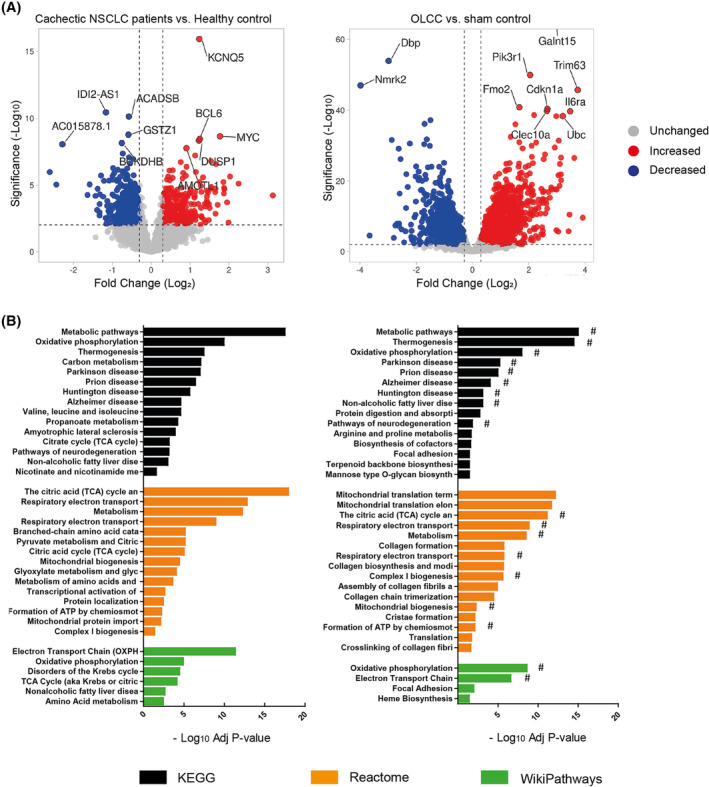
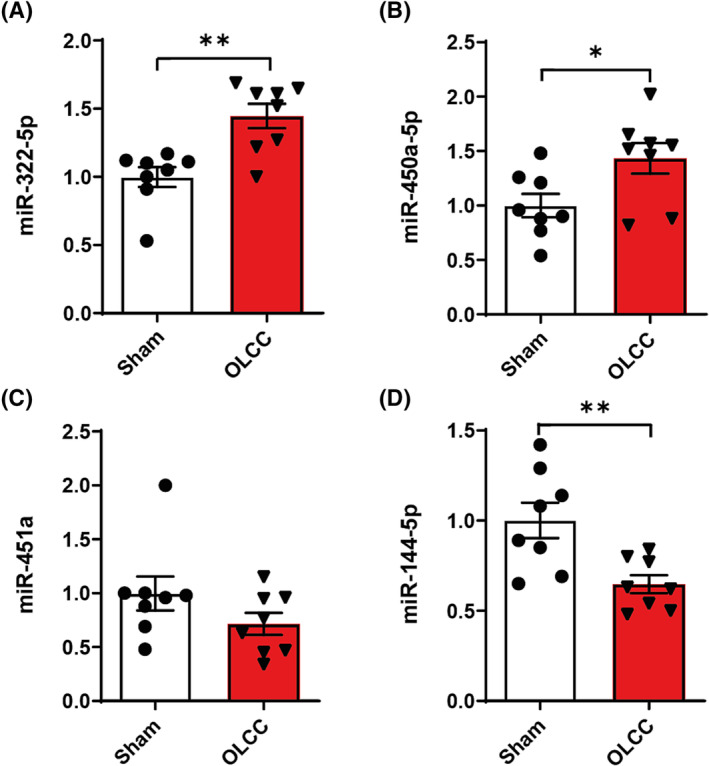
Results: Two-third of the tumour-bearing mice developed cachexia based on predefined criteria. Final body weight (-13.7 ± 5.7%; P < 0.01), muscle mass (-13.8 ± 8.1%; P < 0.01) and muscle strength (-25.5 ± 10.5%; P < 0.001) were reduced in cachectic mice compared with sham controls and median survival time post-surgery was 33.5 days until humane endpoint. Markers for proteolysis, both ubiquitin proteasome system (Fbxo32 and Trim63) and autophagy-lysosomal pathway (Gabarapl1 and Bnip3), were significantly upregulated, whereas markers for protein synthesis (relative phosphorylation of Akt, S6 and 4E-BP1) were significantly decreased in the skeletal muscle of cachectic mice compared with control. The cachectic mice exhibited increased pentraxin-2 (P < 0.001) and CXCL1/KC (P < 0.01) expression levels in blood plasma and increased mRNA expression of IκBα (P < 0.05) in skeletal muscle, indicative for the presence of systemic inflammation. Strikingly, RNA sequencing, pathway enrichment and miRNA expression analyses of mouse skeletal muscle strongly mirrored alterations observed in muscle biopsies of patients with lung cancer cachexia.

Conclusions: We developed an orthotopic model of lung cancer cachexia in immune competent mice. Because this model simulates key aspects specific to cachexia in lung cancer patients, it is highly suitable to further investigate the underlying mechanisms of lung cancer cachexia and to test the efficacy of novel intervention strategies.

Keywords: Cancer cachexia; Lung cancer; Mouse model; Muscle wasting; OLCC; Orthotopic mouse model.


Conflict of interest statement

Wouter van de Worp, Jan Theys, Alba Sanz González, Brent van der Heyden, Florian Caiment, Duncan Hauser, Bert Smeets, Annemie Schols and Ramon Langen do not have any conflicts of interest. Frank Verhaegen is co‐founder of SmART Scientific Solutions B. V. Ardy van Helvoort is employed by Danone Nutricia Research.

Figures

Figure 1
Figure 1
Tumour, body weight and survival characteristics in orthotopic lung cancer cachexia (OLCC) mice. (A) Representative axial slice of a μCBCT image illustrating a single nodule in the left lung lobe of the OLCC mouse. (B) Tumour volume (mm3) of tumour‐bearing mice with (OLCC, n = 8) and without cachexia (OLC(‐C), n = 4) over time, measured by μCBCT. (C) Kaplan–Meier survival plot for sham and OLCC mice. The dotted vertical line indicates the median surrogate survival time for the OLCC mice (33.5 days). (D) Total mouse body weight over time, normalized to body weight at baseline (pre‐surgery). (E) Relative change (%) in body weight (∆BW) at the end of the experiment. (F) Cumulative food intake from 7 days post‐surgery. Data are presented as mean ± SEM, sham control n = 8 and OLCC mice n = 8. Comparisons were statistically tested with the Mann–Whitney U test. Significance is shown as **P < 0.01.
Figure 2
Figure 2
Loss of muscle mass and function in OLCC mice. (A) μCBCT‐derived muscle mass over time, normalized to μCBCT‐derived muscle mass at baseline (pre‐surgery). (B) Relative change (%) in μCBCT‐derived muscle mass at the end of the experiment. (C) Relative change in muscle wet mass at the end of the experiment. (D) Forearm grip strength (gram) over time, normalized to total body weight (gram) at baseline. (E) Absolute change in grip strength (gram) at the end of the experiment. (F) Correlation between forearm grip strength and μCBCT‐derived muscle mass (mg), r = 0.397 (n = 98). The correlation was statistically tested with Pearson's correlation coefficient (two‐tailed). Data are presented as mean ± SEM, sham control n = 8 and OLCC mice n = 8. Comparisons were statistically tested with two‐tailed unpaired t‐test for normally distributed data or Mann–Whitney U test for non‐parametric data. Significances are shown as *P < 0.05; **P < 0.01, and ***P < 0.001.
Figure 3
Figure 3
Increased proteolysis signalling in the muscle of OLCC mice. (A) Relative mRNA expression levels of Fbxo32, Trim63, Nedd4, Bnip3, Gabarapl1 and Foxo1 measured in the m. gastrocnemius. (B) Ratio of phosphorylated ULK (Ser757) over total ULK, and the relative protein expression of phosphorylated ULK (Ser757) and total ULK. (C) Ratio of phosphorylated FoxO1 (Ser256) over total FoxO1, and the relative protein expression of phosphorylated FoxO1 (Ser256) and total FoxO1. Representative pictures of the western blot data are shown in Figure S4. Data are presented as mean ± SEM, sham control n = 8 and OLCC mice n = 8. Comparisons were statistically tested with two‐tailed unpaired t‐test for normally distributed data or Mann–Whitney U test for non‐parametric data. Significances are shown as *P < 0.05; **P < 0.01, and ***P < 0.001.
Figure 4
Figure 4
Decreased protein synthesis signalling in the muscle of OLCC mice. (A) Ratio of phosphorylated Akt (Ser473) over total Akt, and the relative protein expression of phosphorylated Akt (Ser473) and total Akt. (B) Ratio of phosphorylated mTOR (Ser2448) over total mTOR, and the relative protein expression of phosphorylated mTOR (Ser2448) and total mTOR. (C) Ratio of phosphorylated S6 (Ser235/236) over total S6, and the relative protein expression of phosphorylated S6 (Ser235/236) and total S6. (D) Phosphorylation distribution of 4E‐BP1. Representative pictures of the Western blot data are shown in Figure S4. (E) Relative mRNA expression of Ddit4 (REDD1). Data are presented as mean ± SEM, sham control n = 8 and OLCC mice n = 8. Comparisons were statistically tested with two‐tailed unpaired t‐test for normally distributed data or Mann–Whitney U test for non‐parametric data. Significances are shown as *P < 0.05; **P < 0.01, and ***P < 0.001.
Figure 5
Figure 5
Increased systemic inflammation and inflammatory signalling in the muscle of OLCC mice. Blood plasma expression levels of (A) CXCL1/KC in pg/mL and (B) Pentraxin‐2 in μg/mL. (C) Relative mRNA expression of Nfkbia (IκBα) measured in the m. gastrocnemius. Data are presented as mean ± SEM, sham control n = 8 and OLCC mice n = 8. Comparisons were statistically tested with two‐tailed unpaired t‐test for normally distributed data or Mann–Whitney U test for non‐parametric data. Significances are shown as *P < 0.05; **P < 0.01, and ***P < 0.001.
Figure 6
Figure 6
Comparative transcriptomic analysis in muscle biopsies of cachectic NSCLC patients and OLCC mice. (A) Volcano plot of RNA sequencing data of newly diagnosed treatment naïve non‐small cell lung cancer (NSCLC) patients with cachexia (n = 8) compared with age‐ and gender‐matched healthy controls (n = 8; left panel) and OLCC mice (n = 4) compared with sham control (n = 4; right panel). Volcano plots are depicted with fold change (Log 2) and significance (‐Log 10 adjusted P‐value). Significantly upregulated genes are shown in red, while significantly downregulated genes are shown in blue. (B) Horizontal bar chart of enriched biological pathways among significantly downregulated genes in NSCLC patients with cachexia (left panel) and OLCC mice (right panel). Enriched biological pathways are derived from three independent databases: Kyoto Encyclopedia of Genes and Genomes (KEGG; black bars), Reactome (orange bars) and WikiPathways (green bars). Overlapping pathways NSCLC patients with cachexia and OLCC mice are indicated with a hashtag (#).
Figure 7
Figure 7
Relative miRNA expression of (A) mmu‐miR‐322‐5p, (B) mmu‐miR‐450a‐5p, (C) mmu‐miR‐451a, and (D) mmu‐miR‐144‐5p measured in the m. gastrocnemius. Data are presented as mean ± SEM, sham control n = 8 and orthotopic lung cancer cachexia (OLCC) n = 8. Comparisons were statistically tested with two‐tailed unpaired t‐test for normally distributed data or Mann–Whitney U test for non‐parametric data. Significances are shown as *P < 0.05; **P < 0.01, and ***P < 0.001.

Similar articles

Cited by

References

    1. Sung H, Ferlay J, Siegel RL, Laversanne M, Soerjomataram I, Jemal A, et al. Global Cancer Statistics 2020: GLOBOCAN Estimates of Incidence and Mortality Worldwide for 36 Cancers in 185 Countries. CA Cancer J Clin 2021;71:209–249. - PubMed
    1. Herbst RS, Heymach JV, Lippman SM. Lung cancer. N Engl J Med 2008;359:1367–1380. - PMC - PubMed
    1. Anker MS, Holcomb R, Muscaritoli M, von Haehling S, Haverkamp W, Jatoi A, et al. Orphan disease status of cancer cachexia in the USA and in the European Union: a systematic review. J Cachexia Sarcopenia Muscle 2019;10:22–34. - PMC - PubMed
    1. Dewys WD, Begg C, Lavin PT, Band PR, Bennett JM, Bertino JR, et al. Prognostic effect of weight loss prior to chemotherapy in cancer patients. Eastern Cooperative Oncology Group. Am J Med 1980;69:491–497. - PubMed
    1. Ross PJ, Ashley S, Norton A, Priest K, Waters JS, Eisen T, et al. Do patients with weight loss have a worse outcome when undergoing chemotherapy for lung cancers? Br J Cancer 2004;90:1905–1911. - PMC - PubMed

Publication types