Review
. 2023 Mar 27:14:380-419.
doi: 10.3762/bjnano.14.33. eCollection 2023.

Plasmonic nanotechnology for photothermal applications - an evaluation

Affiliations
Review

Plasmonic nanotechnology for photothermal applications - an evaluation

A R Indhu et al. Beilstein J Nanotechnol. .

Abstract

The application of plasmonic nanoparticles is motivated by the phenomenon of surface plasmon resonance. Owing to the tunability of optothermal properties and enhanced stability, these nanostructures show a wide range of applications in optical sensors, steam generation, water desalination, thermal energy storage, and biomedical applications such as photothermal (PT) therapy. The PT effect, that is, the conversion of absorbed light to heat by these particles, has led to thriving research regarding the utilization of plasmonic nanoparticles for a myriad of applications. The design of conventional nanomaterials for PT conversion has focussed predominantly on the manipulation of photon absorption through bandgap engineering, doping, incorporation, and modification of suitable matrix materials. Plasmonic nanomaterials offer an alternative and attractive approach in this regard, through the flexibility in the excitation of surface plasmons. Specific advantages are the considerable improved bandwidth of the absorption, a higher efficiency of photon absorption, facile tuning, as well as flexibility in the synthesis of plasmonic nanomaterials. This review of plasmonic PT (PPT) research begins with a theoretical discussion on the plasmonic properties of nanoparticles by means of the quasi-static approximation, Mie theory, Gans theory, generic simulations on common plasmonic material morphologies, and the evaluation processes of PT performance. Further, a variety of nanomaterials and material classes that have potential for PPT conversion are elucidated, such as plasmonic metals, bimetals, and metal-metal oxide nanocomposites. A detailed investigation of the essential, but often ignored, concept of thermal, chemical, and aggregation stability of nanoparticles is another part of this review. The challenges that remain, as well as prospective directions and chemistries, regarding nanomaterials for PT conversion are pondered on in the final section of the article, taking into account the specific requirements from different applications.

Keywords: nanoparticle heating; phonons; photothermal; plasmonic; stability; surface plasmon resonance.


Figures

Figure 1
Figure 1
Schematic representation of surface plasmon resonance (SPR) excitation. (a) SPR wave or surface plasmon polariton (SPP). (b) Localized SPR (LSPR) in a spherical nanoparticle and the associated absorbance spectrum. Figure 1a,b was used with permission of The Royal Society of Chemistry, from [31] (“Portable and field-deployed surface plasmon resonance and plasmonic sensors”, J.-F. Masson, Analyst, vol. 145, issue 11, © Copyright 2020); permission conveyed through Copyright Clearance Center, Inc. This content is not subject to CC BY 4.0.
Figure 2
Figure 2
Optical spectra (absorption – red, scattering – blue, and extinction – black) of different morphologies of Ag nanoparticles representing shape effects of (a) nanosphere, (b) nanocube, (c) tetrahedron, (d) octahedron, and (e, f) core–shell structures with different shell thicknesses. Figure 2a–f was reprinted with permission from [40], Copyright 2006 American Chemical Society. This content is not subject to CC BY 4.0.
Figure 3
Figure 3
Manifestation of the governing factors of SPR. Shown are the changes to the peak position while considering only the shape (red circles), the shape as well as the electron density (blue squares), and the combination of shape, electron density, and deformation potential (green diamonds). Figure 3 was reprinted with permission from [53], Copyright 2017 American Chemical Society. This content is not subject to CC BY 4.0.
Figure 4
Figure 4
Dissipation ratio of electron–hole pair loss vs phonon loss of the surface plasmon excitation for different metal oxides. Figure 4 was reprinted with permission from [56], Copyright 2015 by the American Physical Society. This content is not subject to CC BY 4.0.
Figure 5
Figure 5
Extinction efficiencies of gold nanospheres calculated through the quasi-static approximation vs using Mie theory. The expected trends in the plasmonic peak shifts with particle size post the quasi-static limit can be seen to be predicted better by Mie theory. Figure 5 was reprinted by permission from Springer Nature from [58] ("Optical Properties of Metal Nanoparticles" by N. Harris et al., in Encyclopaedia of Nanotechnology, 2nd edition, Springer Dordrecht 2016, pp. 3027–3048), Copyright 2016 Springer Nature. This content is not subject to CC BY 4.0.
Figure 6
Figure 6
Absorption spectra of Au nanospheres of different diameters showing the shift of excitation wavelengths. The broadening of the SPR curve due to damping effects is evident. Figure 6 was reprinted from [59] (© 2018 H. S. Kim and Y. Lee, distributed under the terms of the Creative Commons Attribution 4.0 International License, https://creativecommons.org/licenses/by/4.0).
Figure 7
Figure 7
Normalized absorption spectra of Ag-NMs with different radii of the concentric spheres irradiated under with 1 mW/μm2. The appearance of periodic absorption peaks corresponding to multipolar excitations can be observed. Figure 7 was reprinted by permission from Springer Nature from [63] (“Analyzing Photothermal Heat Generation Efficiency in a Molecular Plasmonic Silver Nanomatryushka Dimer” by A. Ahmadivand; N. Pala, Plasmonics, Vol. 11, pp. 493–501, 2016), Copyright 2015 Springer Nature. This content is not subject to CC BY 4.0.
Figure 8
Figure 8
The PT conversion mechanism. (a) Photoexcitation of plasmons. (b) Electron thermalization. (c) Electron–phonon coupling. (d) Energy dissipation from the nanoparticle lattice to the surrounding. Figure 8a–d was redrawn from [66].
Figure 9
Figure 9
Radiative and non-radiative decay time scales of the conversion processes in PPT materials. For the right panel, the characteristic time scales of non-radiative decay were taken from [67].
Figure 10
Figure 10
Hot carrier lifetimes on the Fermi surface and variation between positive and negative curvature, elucidating the variations occurring in relaxation rates and, by extension, electron thermalization of (a) Al, (b) Ag, (c) Au, and (d) Cu. Figure 10a–d was adapted with permission from [29], Copyright 2016 American Chemical Society. This content is not subject to CC BY 4.0.
Figure 11
Figure 11
Electron–phonon coupling timescales for different diameters of metal nanoparticles: (a) Ag, (b) Au, and (right panel) Cu. Figure 11a and Figure 11b were reprinted with permission from [75], Copyright 2003 by the American Physical Society. This content is not subject to CC BY 4.0. Figure 11, right panel was reprinted with permission from [76] , Copyright 2000 by the American Physical Society. This content is not subject to CC BY 4.0.
Figure 12
Figure 12
Comparison of the probability distribution of electrons and holes at various energy levels for coinage plasmonic metals. Figure 12 was reproduced from [80] (© 2014 R. Sundararaman et al., published by Springer Nature, distributed under the terms of the Creative Commons Attribution 4.0 International License, https://creativecommons.org/licenses/by/4.0).
Figure 13
Figure 13
Relaxation process of the phonon vibration. Figure 13i (left panel) was redrawn from [82]. Figure 13ii (right panel) was adapted with permission of The Royal Society of Chemistry, from [72] (“Solar absorber material and system designs for photothermal water vaporization towards clean water and energy production”, by M. Gao et al., Energy & Environmental Science, vol. 20, issue 3, © 2019); permission conveyed through Copyright Clearance Center, Inc. This content is not subject to CC BY 4.0.
Figure 14
Figure 14
Thermal capacitance coefficient (β) for the ellipsoidal, rod, disk, and ring morphologies of Au nanoparticles as a function of the aspect ratio D/d. Figure 14 was reprinted with permission from [96], Copyright 2010 American Chemical Society. This content is not subject to CC BY 4.0.
Figure 15
Figure 15
Absorption spectra of spherical nanoparticles of Ag, Au, and Cu with radii between 50 and 100 nm and the corresponding valence orbitals.
Figure 16
Figure 16
PT conversion and thermalization of plasmonic nanoparticles after absorption of a laser pulse. The hatched area shows the border between bubble mode and pressure wave mode due to the increase of the nanoparticle temperature during plasmonic interaction. Figure 16 was reprinted with permission from [106] (D. Lapotko, “Optical excitation and detection of vapor bubbles around plasmonic nanoparticles”, Opt. Express, vol. 17, issue 4, article no. 2538, 2009), © The Optical Society. This content is not subject to CC BY 4.0.
Figure 17
Figure 17
SEM images of Au nanoassemblies. (a) Hexagonally filled Au polyhedra. (b) Hexagonally filled Au polyhedra with periodic monosteps. (c) Tetragonally packed Au nanocubes. (d) Nanocubes stacked in layers. (e) A 3D ordered superstructure formed of Au bipyramids. (f) Nematic structure formed of Au bipyramids. Figure 17a–f was reproduced from [107], T. Ming. et al., “Ordered Gold Nanostructure Assemblies Formed By Droplet Evaporation”, Angew. Chem., Int. Ed., with permission from John Wiley and Sons. Copyright © 2008 Wiley-VCH Verlag GmbH & Co. KGaA, Weinheim. This content is not subject to CC BY 4.0.
Figure 18
Figure 18
(i) FDTD calculation of absorption spectra of Au nanorods (aspect ratio of ca. 3) for different numbers (x) of nanorod assemblies: (a) Side-side assembly. (b) SPR peak shift for side-by-side assembled Au nanorods. (c) End-to-end assembly. (d) SPR peak shift for end-to-end assembled Au nanorods. Figure 18 panel i was reprinted by permission from Springer Nature from [110] (“Plasmonic Properties of the End-to-End and Side-by-Side Assembled Au Nanorods” by J. Liu et al., Plasmonics, Vol. 10, pp. 117–124, 2015), Copyright 2015 Springer Nature. This content is not subject to CC BY 4.0. (ii) Scattering spectra of Au rods in different orientations (aspect ratio of 2–2.7) on ITO substrates with interparticle distances smaller than 1 nm. Figure 18 panel ii was reprinted with permission from [111], Copyright 2009 American Chemical Society. This content is not subject to CC BY 4.0. (iii) Extinction spectra of a 2D array of the Au nanoparticle pairs with interparticle distances from 450 to 150 nm: (a) Parallel to the long particle pair axis and (b) normal to this axis. Figure 18 panel iii was reprinted from [109], Optics Communications, vol. 220, by W. Rechberger; A. Hohenau; A. Leitner; J. R. Krenn; B. Lamprecht; F. R. Aussenegg, “Optical properties of two interacting gold nanoparticles”, pages 137–141, Copyright (2003), with permission from Elsevier. This content is not subject to CC BY 4.0.
Figure 19
Figure 19
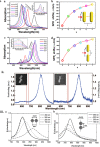
TEM images with 50 nm scale bars of linked Ag nanospheres prepared with an injection rate of 5 μL/min and for different concentrations of the precursor solution: (a) 15 μL, (b) 25 μL, (c) 35 μL, and (d) 65 μL. (i) Schematic diagram showing the model considered in finite-difference time-domain (FDTD) simulations. (ii) Simulated and normalised extinction graph for Ag nanoparticles for different chain lengths. (iii) Simulated FDTD results for the enhancement for the electric near field along the Ag nanoparticle chain (N = 11) excited by incident light of different wavelengths (420, 460, and 500 nm). Figure 19 panels i–iii were adapted with permission from [114], Copyright 2019 American Chemical Society. This content is not subject to CC BY 4.0.
Figure 20
Figure 20
TEM images of CuS, metal, and bimetal plasmonic nanoparticles and the corresponding temperature rise. (i) (a) SEM and TEM image of hierarchical Cu7S4@ZIF8 core–shell nanostructures. (b) Temperature rise of Cu7S4@ZIF8 nanoparticles under a laser power irradiation of 100 mW/cm2. Figure 20 panel i a,b was adapted from [176] (“Photothermal-enhanced catalysis in core-shell plasmonic hierarchical Cu7S4 microsphere@zeolitic imidazole framework-8”, © 2016 F. Wang et al., published by The Royal Society of Chemistry, distributed under the terms of the Creative Commons Attribution 3.0 Unported License, https://creativecommons.org/licenses/by/3.0/). (ii) (a) TEM image of Pd nanosheets. (b) TEM image of Pd@Pt nanoplates. (c) Temperature rise of Pd and Pd@Pt nanostructures under a laser intensity of 0.5 mW/cm2. Figure 20 panel ii a–c was adapted from [163], J. Wei et al., “A Novel theranostic Nanoplatform based on Pd@Pt-PEG-Ce6 for Enhanced Photodynamic therapy by modulating tumor Hypoxia microenvironment”, Adv. Funct. Mater., with permission from John Wiley and Sons. Copyright © 2018 WILEY-VCH Verlag GmbH & Co. KGaA, Weinheim. This content is not subject to CC BY 4.0.
Figure 21
Figure 21
(i) (a, b) SEM images of a black Au membrane in a hexagonal ordered array of AAO. (c) Thermal images of the black gold membrane floating on water in a cuvette and (d) at the bottom of the cuvette under an irradiation density of 10 kW/m2. Figure 21 panel i a–d was adapted from [184] (© 2015 K. Bae et al., distributed under the terms of the Creative Commons Attribution 4.0 International License, https://creativecommons.org/licenses/by/4.0). ii. a. SEM image of AAO capped Au nanotube array. b.–d. Simulated electric field intensity of AAO capped Au nanotube array at different wavelengths (the nanotubes are 120 nm long with a 24 nm inner diameter, 8 nm wall thickness and 60 nm spacing. Caps are 12 nm thick. Figure 21 panel ii a–d was adapted from [185] (W. R. Hendren et al., “Fabrication and optical properties of gold nanotube arrays”, J. Phys.: Condens. Matter, vol. 20, article no. 362203, published on 14 August 2008; DOI: 10.1088/0953-8984/20/36/362203); © 2008 IOP Publishing. Reproduced with permission via Copyright Clearance Center. All rights reserved. This content is not subject to CC BY 4.0.
Figure 22
Figure 22
(i) Simulated electric field intensities of Ag/SiO2 at the ZX plane: (a) Core–shell (dAg = 40 nm, tSiO2 = 10 nm). (b) Nanodisk (dAg = 60 nm, tAg = 5 nm, and tSiO2 = 10 nm). (c) Nanoprism (lAg = 70 nm, tAg = 5 nm, and tSiO2 = 10 nm. Figure 22 panel i a–c was reproduced from [133], A. R. Mallah et al., “An innovative, high-efficiency silver/silica nanocomposites for direct absorption concentrating solar thermal power”, Int. J. Energy Res., with permission from John Wiley and Sons. Copyright © 2020 John Wiley & Sons, Ltd. This content is not subject to CC BY 4.0. (ii) TEM images of (a, c) Pd@Ag@mSiO2 and (b, d) Pd@Ag@mSiO2-Ce6. Figure 22 panel ii a–d was reproduced with permission of The Royal Society of Chemistry, from [191] (“Photothermally enhanced photodynamic therapy based on mesoporous Pd@Ag@mSiO2 nanocarriers”, by S. Shi et al., J. Mater. Chem. B, vol. 1, issue 8, © 2013); permission conveyed through Copyright Clearance Center, Inc. This content is not subject to CC BY 4.0.
Figure 23
Figure 23
Integrated nanostructures for PT conversion. (i) Hollow mesoporous bimetallic (Ag/Au) nanoshells for solar vapour generation. Figure 23 panel i was redrawn from [169]. (ii) Sandwich hydrogel with Cu/Carbon cell. Figure 23 panel ii was redrawn from [206]. (iii) TiN on AAO matrix. Figure 23 panel iii was redrawn from [207].
Figure 24
Figure 24
PT conversion efficiencies of different transition metal nitrides (HfN, ZrN, and TiN) and the corresponding efficiency for Au nanoclusters, all at a laser power intensity of 1.0 W/cm2. Figure 24 was reprinted with permission from [209], Copyright 2020 American Chemical Society. This content is not subject to CC BY 4.0.
Figure 25
Figure 25
Colloidal stability of nanoparticles for different particle sizes from 8 to 68 nm of organic pigment samples. Figure 25 was reprinted with permission from [224], Copyright 2017 American Chemical Society. This content is not subject to CC BY 4.0.
Figure 26
Figure 26
Illustration of the chemical interaction stability of nanoparticles. (i) Chemical interactions between fluid/particle dictate chemical stability. Figure 26 panel i was reprinted from [228], Nanofluids for Heat and Mass Transfer, 2021, by B. Bhanvase; D. Barai, “3 - Stability of nanofluids”, pages 69-97, Copyright (2021), with permission from Elsevier. This content is not subject to CC BY 4.0. (ii) Impact of pH value on stability of nanoparticles, as can be visualized through the zeta potential. Figure 26 panel ii was reprinted from [229], Advances in Chemical Mechanical Planarization (CMP) (Second Edition), 2021, Babu, S., Ed.; by K. Pate; P. Safier, “13 - Chemical metrology methods for CMP quality”, pages 355–383, Copyright (2022), with permission from Elsevier. This content is not subject to CC BY 4.0.
Figure 27
Figure 27
Thermal stability of Ag and Au nanoparticles of different shapes at different temperatures. (i) (a) Au nanocube, (b) rhombic dodecahedron, (c) tetrahedron, (d) octahedron, and (e) truncated octahedron. Figure 27 panel i was used with permission of The Royal Society of Chemistry, from [222] (“Single-crystalline and multiple-twinned gold nanoparticles: an atomistic perspective on structural and thermal stabilities”, by R. Huang et al., RSC Adv., vol. 4, issue 15, © 2014); permission conveyed through Copyright Clearance Center, Inc. This content is not subject to CC BY 4.0. (ii) Ag nanospheres and Ag nanoplates of different sizes that can be realized as a function of temperature. Figure 27 panel ii was reprinted with permission from [244], Copyright 2020 American Chemical Society. This content is not subject to CC BY 4.0.
Figure 28
Figure 28
Thermal stability of Au nanorods at increasing temperatures. (i) Aspect ratio and plasmonic absorbance spectra of Au nanorods shift with increasing temperature. Figure 28 panel i was adapted with permission of The Royal Society of Chemistry, from [245] (“On the temperature stability of gold nanorods: comparison between thermal and ultrafast laser-induced heating”, by H. Petrova et al., Phys. Chem. Chem. Phys., vol. 8, issue 7, © 2006); permission conveyed through Copyright Clearance Center, Inc. This content is not subject to CC BY 4.0. (ii) (a–c) To prevent this, AuNPs can be incorporated into support materials such as yttrium-stabilized zirconia, titania, or resorcinol formaldehyde (RF). Figure 28 panel ii a was adapted with permission from [114], Copyright 2019 American Chemical Society. This content is not subject to CC BY 4.0. Figure 28 panel ii b was adapted with permission from [246], Copyright 2017 American Chemical Society. This content is not subject to CC BY 4.0. Figure 28 panel ii c was adapted with permission of SPIE from [218] (“Investigation of the optical and sensing characteristics of nanoparticle arrays for high temperature applications”, by G. Dharmalingam and M. A. Carpenter, Sensors for Extreme Harsh Environments II, vol. 9491, 13 May 2015, article no. 949108, © 2015 SPIE); This content is not subject to CC BY 4.0.

Similar articles

Cited by

References

    1. Dirker J, Juggurnath D, Kaya A, Osowade E A, Simpson M, Lecompte S, Noori Rahim Abadi S M A, Voulgaropoulos V, Adelaja A O, Dauhoo M Z, et al. Front Energy Res. 2019;6:10.3389/fenrg.2018.00147. doi: 10.3389/fenrg.2018.00147. - DOI
    1. Gärtner W W. Phys Rev. 1961;122(2):419–424. doi: 10.1103/physrev.122.419. - DOI
    1. Jung H S, Verwilst P, Sharma A, Shin J, Sessler J L, Kim J S. Chem Soc Rev. 2018;47:2280–2297. doi: 10.1039/c7cs00522a. - DOI - PMC - PubMed
    1. Cortezon-Tamarit F, Ge H, Mirabello V, Theobald M B M, Calatayud D G, Pascu S I. Inorganic and Organometallic Transition Metal Complexes with Biological Molecules and Living Cells. Academic Press; 2017. Carbon Nanotubes and Related Nanohybrids Incorporating Inorganic Transition Metal Compounds and Radioactive Species as Synthetic Scaffolds for Nanomedicine Design; pp. 245–327. - DOI
    1. Li S, Wang X, Hu R, Chen H, Li M, Wang J, Wang Y, Liu L, Lv F, Liang X-J, et al. Chem Mater. 2016;28(23):8669–8675. doi: 10.1021/acs.chemmater.6b03738. - DOI

LinkOut - more resources