

Genetic causal relationship between age at menarche and benign oesophageal neoplasia identified by a Mendelian randomization study
- PMID: 37025412
- PMCID: PMC10071044
- DOI: 10.3389/fendo.2023.1113765
Genetic causal relationship between age at menarche and benign oesophageal neoplasia identified by a Mendelian randomization study
Abstract
Objective: The occurrence and development of oesophageal neoplasia (ON) is closely related to hormone changes. The aim of this study was to investigate the causal relationships between age at menarche (AAMA) or age at menopause (AAMO) and benign oesophageal neoplasia (BON) or malignant oesophageal neoplasia (MON) from a genetic perspective.
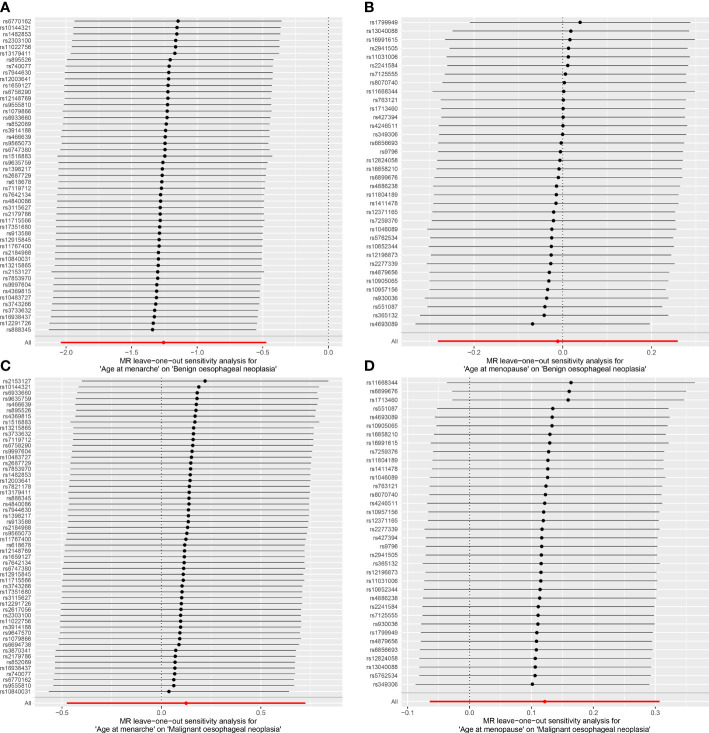
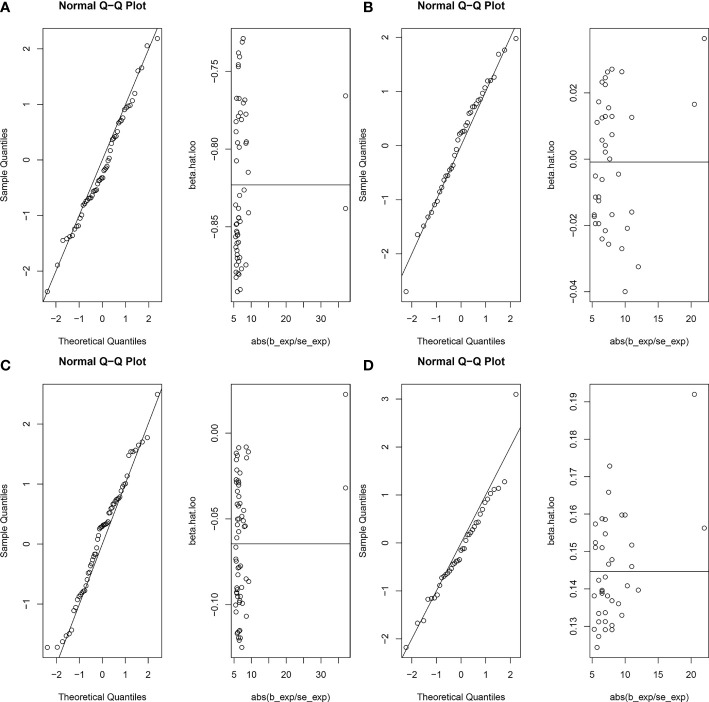
Methods: Genome-wide association study (GWAS) summary data of exposures (AAMA and AAMO) and outcomes (BON and MON) were obtained from the IEU OpenGWAS database. We performed a two-sample Mendelian randomization (MR) study between them. The inverse variance weighted (IVW) was used as the main analysis method, while the MR Egger, weighted median, simple mode, and weighted mode were supplementary methods. The maximum likelihood, penalized weighted median, and IVW (fixed effects) were validation methods. We used Cochran's Q statistic and Rucker's Q statistic to detect heterogeneity. The intercept test of the MR Egger and global test of MR pleiotropy residual sum and outlier (MR-PRESSO) were used to detect horizontal pleiotropy, and the distortion test of the MR-PRESSO analysis was used to detect outliers. The leave-one-out analysis was used to detect whether the MR analysis was affected by single nucleotide polymorphisms (SNPs). In addition, the MR robust adjusted profile score (MR-RAPS) method was used to assess the robustness of MR analysis.
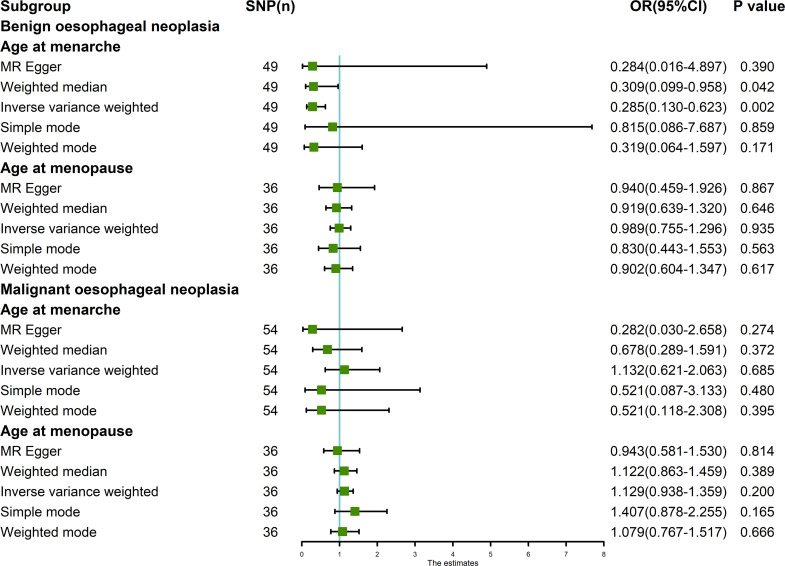
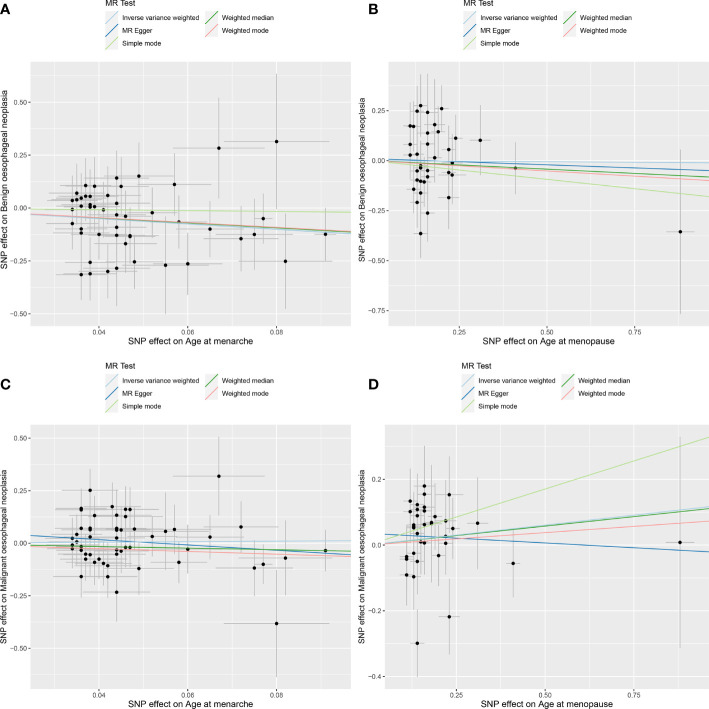
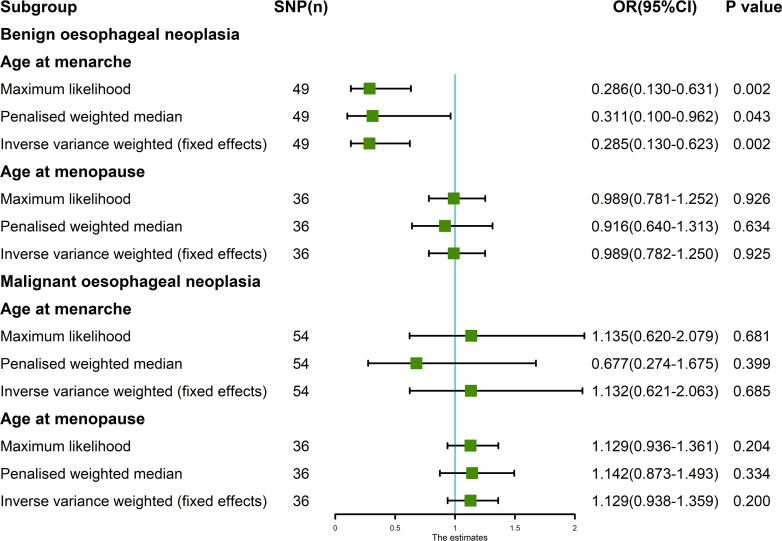
Results: The random-effects IVW results showed that AAMA had a negative genetic causal relationship with BON (odds ratio [OR] = 0.285 [95% confidence interval [CI]: 0.130-0.623], P = 0.002). The weighted median, maximum likelihood, penalized weighted median, and IVW (fixed effects) were consistent with random-effects IVW (P < 0.05). The MR Egger, simple mode and weighted mode results showed that AAMA had no genetic causal relationship with BON (P > 0.05). However, there were no causal genetic relationships between AAMA and MON (OR = 1.132 [95%CI: 0.621-2.063], P = 0.685), AAMO and BON (OR = 0.989 [95%CI: 0.755-1.296], P = 0.935), or AAMO and MON (OR = 1.129 [95%CI: 0.938-1.359], P = 0.200). The MR Egger, weighted median, simple mode, weighted mode, maximum likelihood, penalized weighted median, and IVW (fixed effects) were consistent with a random-effects IVW (P > 0.05). MR analysis results showed no heterogeneity, the horizontal pleiotropy and outliers (P > 0.05). They were not driven by a single SNP, and were normally distributed (P > 0.05).
Conclusion: Only AAMA has a negative genetic causal relationship with BON, and no genetic causal relationships exist between AAMA and MON, AAMO and BON, or AAMO and MON. However, it cannot be ruled out that they are related at other levels besides genetics.
Keywords: age at menopause; confounding factor; genetic; hormone; instrumental variables.
Copyright © 2023 Su, Hu, Xu, Yang, Wu and Peng.
Conflict of interest statement
The authors declare that the research was conducted in the absence of any commercial or financial relationships that could be construed as a potential conflict of interest.
Figures
Similar articles
-
[Genetic Causation Analysis of Hyperandrogenemia Testing Indicators and Preeclampsia].Sichuan Da Xue Xue Bao Yi Xue Ban. 2024 May 20;55(3):566-573. doi: 10.12182/20240560106. Sichuan Da Xue Xue Bao Yi Xue Ban. 2024. PMID: 38948277 Free PMC article. Chinese.
-
The genetic causal relationship between type 2 diabetes, glycemic traits and venous thromboembolism, deep vein thrombosis, pulmonary embolism: a two-sample Mendelian randomization study.Thromb J. 2024 Mar 29;22(1):33. doi: 10.1186/s12959-024-00600-z. Thromb J. 2024. PMID: 38553747 Free PMC article.
-
No evidence of genetic causal association between sex hormone-related traits and systemic lupus erythematosus: A two-sample Mendelian randomization study.Clin Rheumatol. 2023 Dec;42(12):3237-3249. doi: 10.1007/s10067-023-06700-x. Epub 2023 Jul 26. Clin Rheumatol. 2023. PMID: 37495778
-
Mendelian randomization of individual sleep traits associated with major depressive disorder.J Affect Disord. 2024 Nov 15;365:105-111. doi: 10.1016/j.jad.2024.08.068. Epub 2024 Aug 15. J Affect Disord. 2024. PMID: 39153551 Review.
-
Exploring the potential causal relationship between gut microbiota and heart failure: A two-sample mendelian randomization study combined with the geo database.Curr Probl Cardiol. 2024 Feb;49(2):102235. doi: 10.1016/j.cpcardiol.2023.102235. Epub 2023 Nov 30. Curr Probl Cardiol. 2024. PMID: 38040216 Review.
Cited by
-
Mitochondrial proteins as therapeutic targets in diabetic ketoacidosis: evidence from Mendelian randomization analysis.Front Pharmacol. 2024 Oct 14;15:1448505. doi: 10.3389/fphar.2024.1448505. eCollection 2024. Front Pharmacol. 2024. PMID: 39469619 Free PMC article.
-
Telomere Length as Both Cause and Consequence in Type 1 Diabetes: Evidence from Bidirectional Mendelian Randomization.Biomedicines. 2025 Mar 22;13(4):774. doi: 10.3390/biomedicines13040774. Biomedicines. 2025. PMID: 40299325 Free PMC article.
-
The causal effect of oxidative stress on the risk of glaucoma.Heliyon. 2024 Jan 17;10(3):e24852. doi: 10.1016/j.heliyon.2024.e24852. eCollection 2024 Feb 15. Heliyon. 2024. PMID: 38317903 Free PMC article.
-
Causal relationship between rheumatoid arthritis and bronchiectasis: a bidirectional mendelian randomization study.Arthritis Res Ther. 2024 May 23;26(1):104. doi: 10.1186/s13075-024-03336-3. Arthritis Res Ther. 2024. PMID: 38783321 Free PMC article.
-
Late age at first birth is a protective factor for oesophageal cancer and gastro-oesophageal reflux: the evidence from the genetic study.Front Endocrinol (Lausanne). 2024 Jan 15;14:1329763. doi: 10.3389/fendo.2023.1329763. eCollection 2023. Front Endocrinol (Lausanne). 2024. PMID: 38288469 Free PMC article.
References
Publication types
MeSH terms
LinkOut - more resources
Full Text Sources
Medical
Miscellaneous