

Development of an icIEF assay for monitoring AAV capsid proteins and application to gene therapy products
- PMID: 37025949
- PMCID: PMC10070887
- DOI: 10.1016/j.omtm.2023.03.002
Development of an icIEF assay for monitoring AAV capsid proteins and application to gene therapy products
Abstract
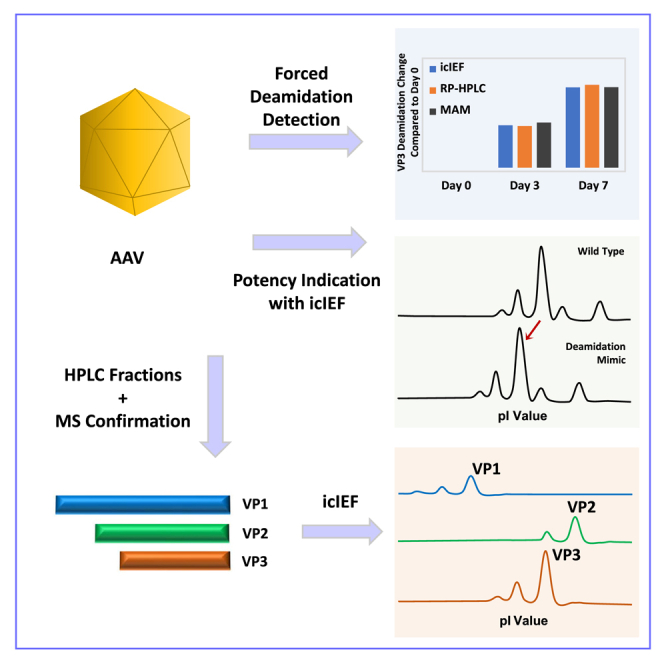
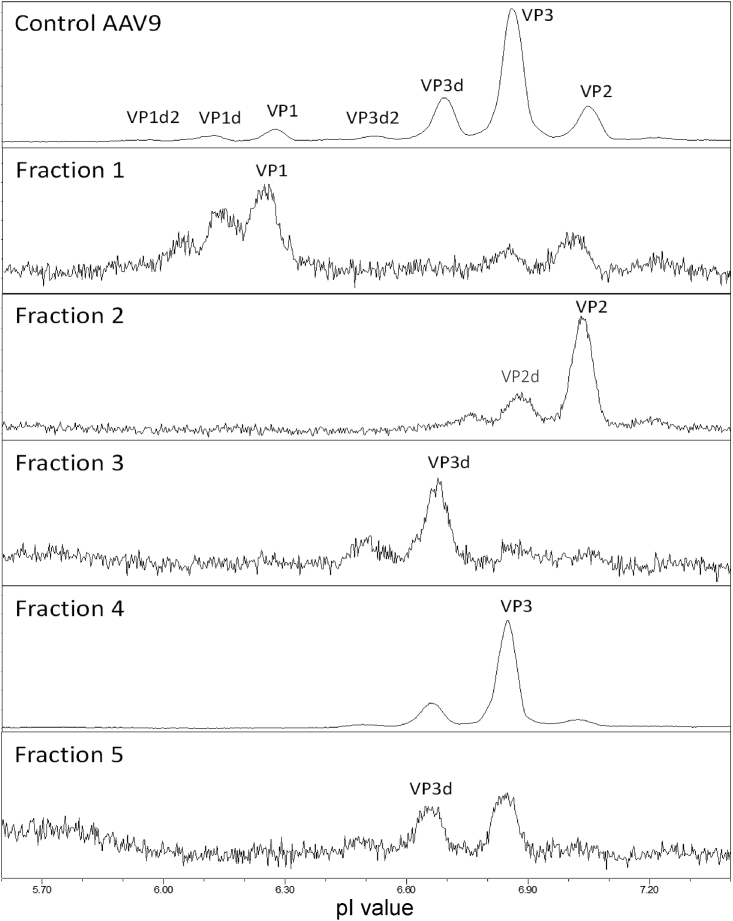
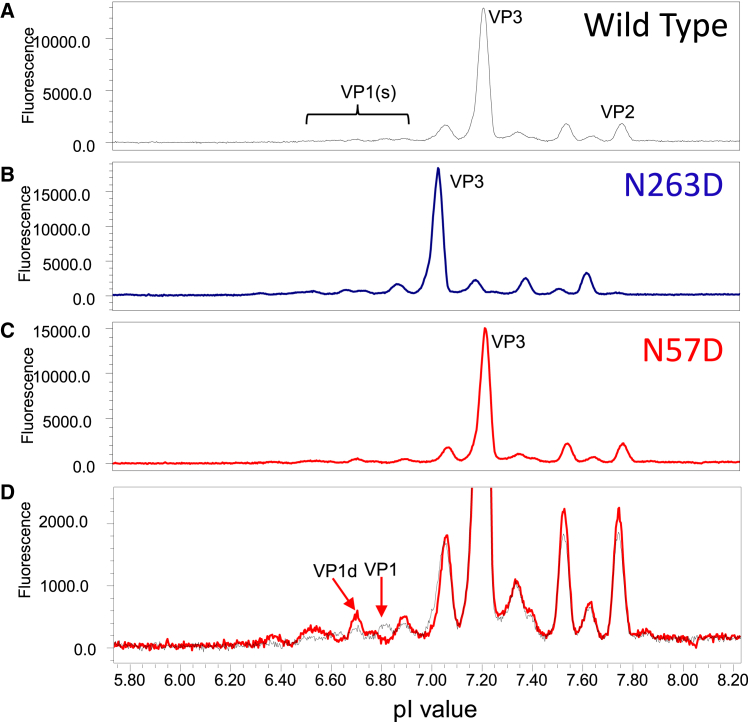
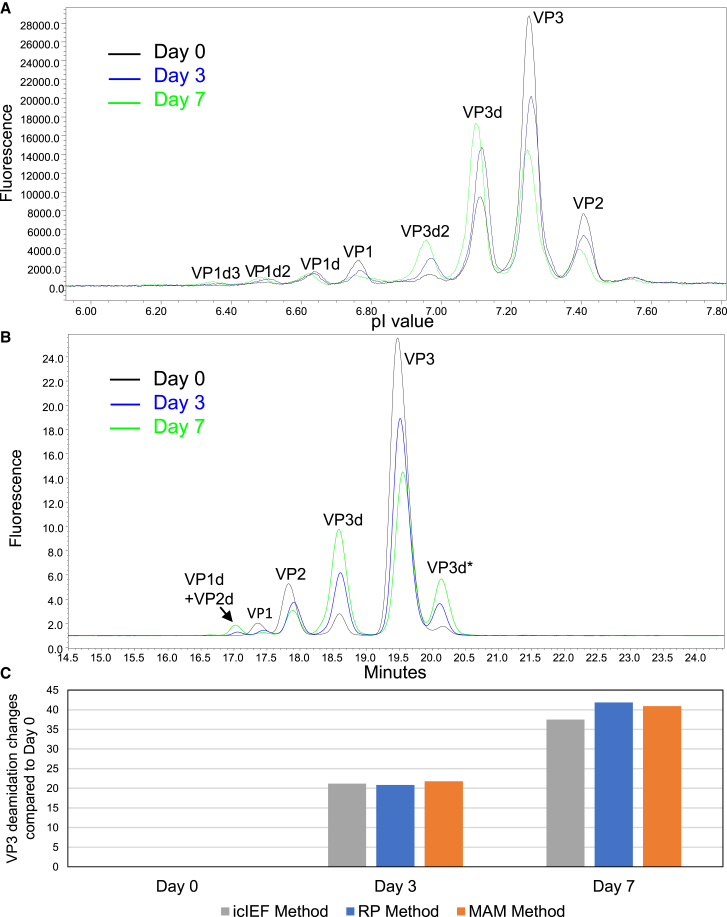
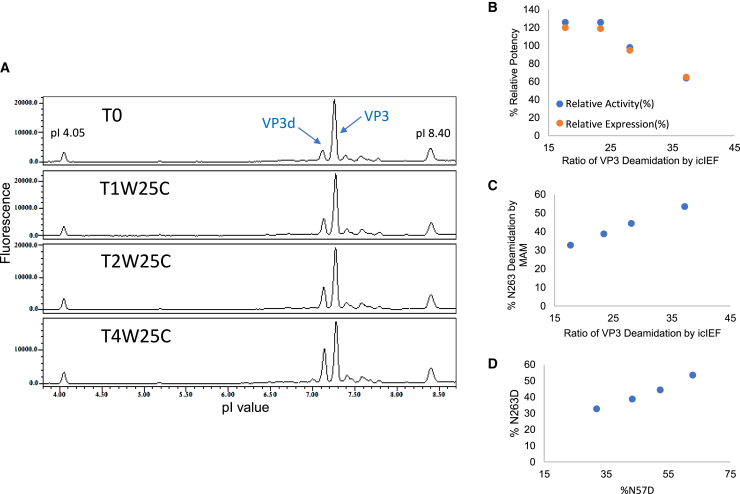
Adeno-associated virus (AAV) gene therapy vectors, which contain a DNA transgene packaged into a protein capsid, have shown tremendous therapeutic potential in recent years. Methods traditionally used in quality control labs, such as high-performance liquid chromatography (HPLC) and capillary electrophoresis (CE), do not provide a complete understanding of capsid viral protein (VP) charge heterogeneity. In the present study, we developed simple, one-step sample preparation and charge-based VP separation using imaged capillary isoelectric focusing (icIEF) for monitoring AAV products. The robustness of the method was confirmed through a design of experiments (DoE) exercise. An orthogonal reverse-phase (RP) HPLC method coupled with mass spectrometry was developed to separate and identify charge species. Additionally, capsid point mutants demonstrate the capability of the method to resolve deamidation at a single site on the viral proteins. Finally, case studies using two different AAV serotype vectors establish the icIEF method as stability indicating and demonstrate that increases in acidic species measured by icIEF correlate with increased deamidation, which, we show, results in decreased transduction efficiency. The addition of a rapid and robust icIEF method to the AAV capsid analytical toolkit enables development and consistent manufacturing of well-characterized gene therapy products.
Keywords: AAV; LC-MS; deamidation; gene therapy research; icIEF charge heterogeneity determination.
Conflict of interest statement
All authors are full-time employees and may be shareholders of Pfizer Inc..
Figures
Similar articles
-
Enabling icIEF Peak Identification of AAV Capsid Proteins by Fractionation on MauriceFlex and Subsequent Analysis by LC-MS.Electrophoresis. 2025 Jan;46(1-2):22-33. doi: 10.1002/elps.202400201. Epub 2025 Jan 20. Electrophoresis. 2025. PMID: 39831456 Free PMC article.
-
Development of a highly sensitive imaged cIEF immunoassay for studying AAV capsid protein charge heterogeneity.Electrophoresis. 2023 Aug;44(15-16):1258-1266. doi: 10.1002/elps.202300039. Epub 2023 May 3. Electrophoresis. 2023. PMID: 37138377
-
Imaged Capillary Isoelectric Focusing (icIEF) Platform for Characterization of Charge Variants of Adeno-Associated Virus (AAV) Capsids and Impact on Their Transduction Efficiency.Curr Gene Ther. 2025 Apr 15. doi: 10.2174/0115665232369708250327081305. Online ahead of print. Curr Gene Ther. 2025. PMID: 40237057
-
Exploring imaged capillary isoelectric focusing parameters for enhanced charge variants quality control.Front Chem. 2025 Feb 20;13:1536222. doi: 10.3389/fchem.2025.1536222. eCollection 2025. Front Chem. 2025. PMID: 40084275 Free PMC article. Review.
-
Mass spectrometry in gene therapy: Challenges and opportunities for AAV analysis.Drug Discov Today. 2023 Jan;28(1):103442. doi: 10.1016/j.drudis.2022.103442. Epub 2022 Nov 14. Drug Discov Today. 2023. PMID: 36396118 Review.
Cited by
-
Quantification of full and empty particles of adeno-associated virus vectors via a novel dual fluorescence-linked immunosorbent assay.Mol Ther Methods Clin Dev. 2024 Jun 24;32(3):101291. doi: 10.1016/j.omtm.2024.101291. eCollection 2024 Sep 12. Mol Ther Methods Clin Dev. 2024. PMID: 39070291 Free PMC article.
-
Adeno-associated viral capsid stability on anion exchange chromatography column and its impact on empty and full capsid separation.Mol Ther Methods Clin Dev. 2023 Sep 19;31:101112. doi: 10.1016/j.omtm.2023.101112. eCollection 2023 Dec 14. Mol Ther Methods Clin Dev. 2023. PMID: 37868210 Free PMC article.
-
Enabling icIEF Peak Identification of AAV Capsid Proteins by Fractionation on MauriceFlex and Subsequent Analysis by LC-MS.Electrophoresis. 2025 Jan;46(1-2):22-33. doi: 10.1002/elps.202400201. Epub 2025 Jan 20. Electrophoresis. 2025. PMID: 39831456 Free PMC article.
-
Characterizing Glycosylation of Adeno-Associated Virus Serotype 9 Capsid Proteins Generated from HEK293 Cells through Glycopeptide Mapping and Released Glycan Analysis.Microorganisms. 2024 May 7;12(5):946. doi: 10.3390/microorganisms12050946. Microorganisms. 2024. PMID: 38792776 Free PMC article.
-
Insights into Adeno-Associated Virus Capsid Charge Heterogeneity.Anal Chem. 2025 Aug 12;97(31):17132-17140. doi: 10.1021/acs.analchem.5c03104. Epub 2025 Jul 17. Anal Chem. 2025. PMID: 40673772 Free PMC article.
References
LinkOut - more resources
Full Text Sources
