. 2023 Mar 21:14:1078958.
doi: 10.3389/fimmu.2023.1078958. eCollection 2023.

CRISPR/Cas9-engineering of HMC-1.2 cells renders a human mast cell line with a single D816V-KIT mutation: An improved preclinical model for research on mastocytosis

Affiliations

CRISPR/Cas9-engineering of HMC-1.2 cells renders a human mast cell line with a single D816V-KIT mutation: An improved preclinical model for research on mastocytosis

Geethani Bandara et al. Front Immunol. .

Abstract

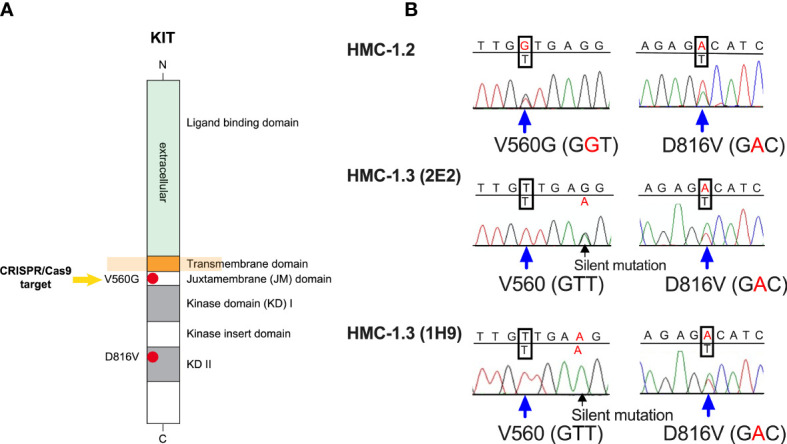
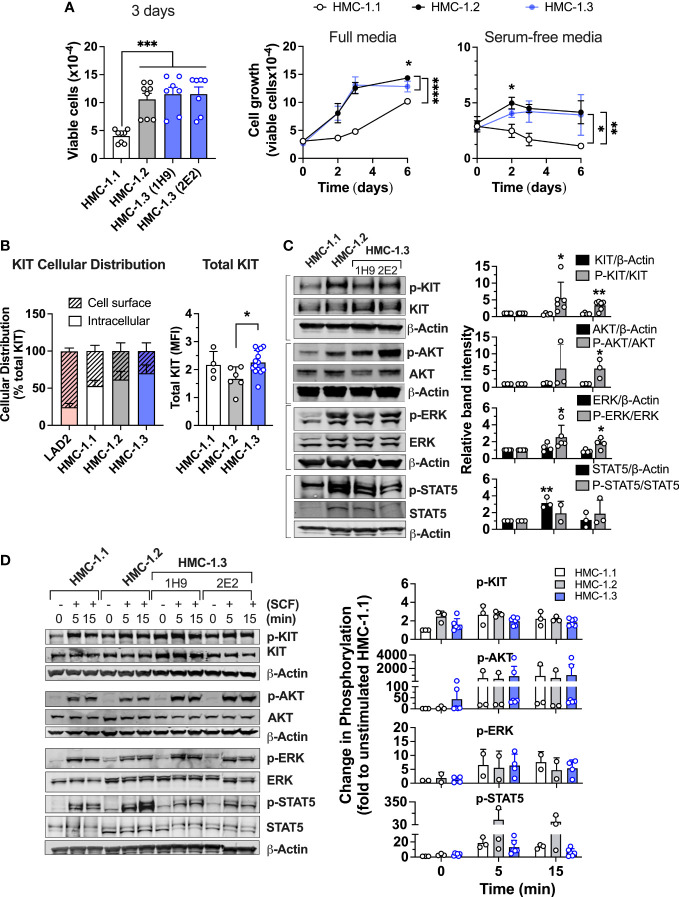
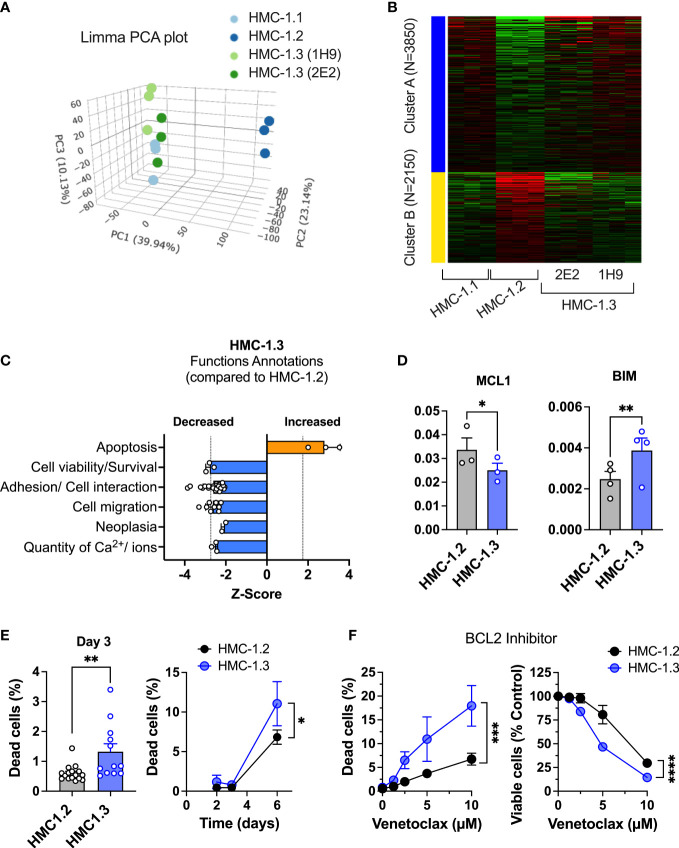
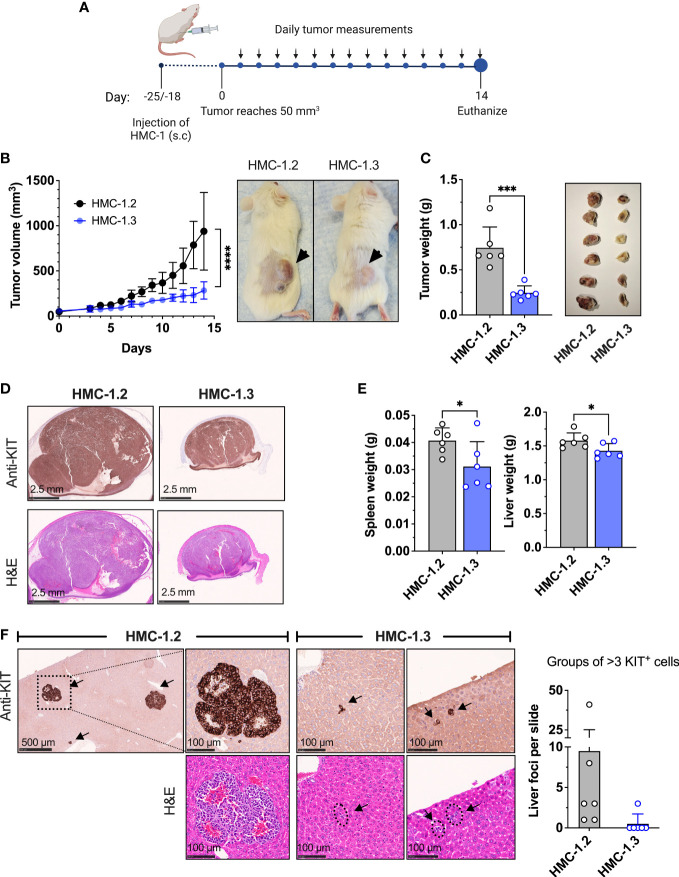
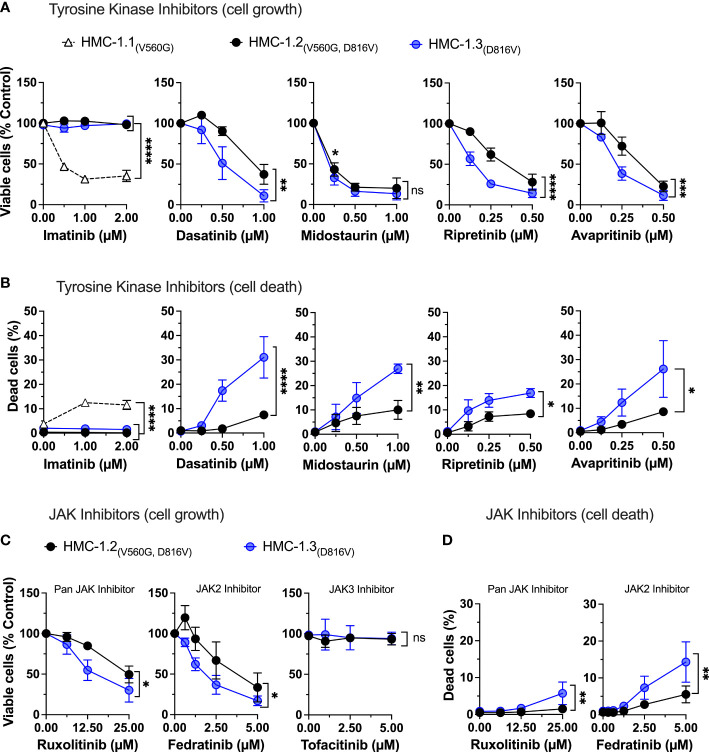
The HMC-1.2 human mast cell (huMC) line is often employed in the study of attributes of neoplastic huMCs as found in patients with mastocytosis and their sensitivity to interventional drugs in vitro and in vivo. HMC-1.2 cells express constitutively active KIT, an essential growth factor receptor for huMC survival and function, due to the presence of two oncogenic mutations (D816V and V560G). However, systemic mastocytosis is commonly associated with a single D816V-KIT mutation. The functional consequences of the coexisting KIT mutations in HMC-1.2 cells are unknown. We used CRISPR/Cas9-engineering to reverse the V560G mutation in HMC-1.2 cells, resulting in a subline (HMC-1.3) with a single mono-allelic D816V-KIT variant. Transcriptome analyses predicted reduced activity in pathways involved in survival, cell-to-cell adhesion, and neoplasia in HMC-1.3 compared to HMC-1.2 cells, with differences in expression of molecular components and cell surface markers. Consistently, subcutaneous inoculation of HMC-1.3 into mice produced significantly smaller tumors than HMC-1.2 cells, and in colony assays, HMC-1.3 formed less numerous and smaller colonies than HMC-1.2 cells. However, in liquid culture conditions, the growth of HMC-1.2 and HMC-1.3 cells was comparable. Phosphorylation levels of ERK1/2, AKT and STAT5, representing pathways associated with constitutive oncogenic KIT signaling, were also similar between HMC-1.2 and HMC-1.3 cells. Despite these similarities in liquid culture, survival of HMC-1.3 cells was diminished in response to various pharmacological inhibitors, including tyrosine kinase inhibitors used clinically for treatment of advanced systemic mastocytosis, and JAK2 and BCL2 inhibitors, making HMC-1.3 more susceptible to these drugs than HMC-1.2 cells. Our study thus reveals that the additional V560G-KIT oncogenic variant in HMC-1.2 cells modifies transcriptional programs induced by D816V-KIT, confers a survival advantage, alters sensitivity to interventional drugs, and increases the tumorigenicity, suggesting that engineered huMCs with a single D816V-KIT variant may represent an improved preclinical model for mastocytosis.

Keywords: D816V-KIT; HMC-1.2 cells; KIT variants; mast cell survival; mastocytosis; neoplastic human mast cells.


Conflict of interest statement

The authors declare that the research was conducted in the absence of any commercial or financial relationships that could be construed as a potential conflict of interest.

Figures

Figure 1
Figure 1
The huMC line HMC-1.3 generated by CRISPR/Cas9-mediated editing of HMC-1.2 cells has a single D816V-KIT mutation. (A) Schematic representation of the structure of KIT, highlighting the presence in HMC-1.2 cells of the oncogenic V560G variant in the juxtamembrane (JM) domain and of D816V-KIT in the kinase domain (KD). The arrow indicates the target mutation for CRISPR/Cas9 editing. (B) Representative Sanger sequencing chromatograms of KIT exons from HMC-1.2 or two separate clones (1H9 and 2E2) of HMC-1.3 cells, demonstrating heterozygous presence of D816V in both HMC-1.2 and in HMC-1.3, and a heterozygous V560G mutation in HMC-1.2 (GGT) that was reversed to the normal allele on this site (GTT) after the CRISPR/Cas9-mediated editing in HMC-1.3.
Figure 2
Figure 2
Comparison of cell growth, KIT expression and oncogenic KIT signaling in the various HMC-1 sublines. (A) Cell growth of HMC-1.1, HMC-1.2 and HMC-1.3 (1H9 and 2E2) in standard growing conditions after 72 h (bar graph; n ≥ 7 experiments; Mean ± SEM) and growth curves over time in full (middle panel) or serum-free media (right panel) (n ≥ 3 experiments; Mean ± SEM) showing HMC-1.3 as the average of both 1H9 and 2E2 subclones. *p<0.05; **p<0.01; ***p<0.001;****p<0.0001 using unpaired t-tests or when indicated with a bracket on the side of the curves, two-way ANOVA. Total cells were counted using a Celigo image cytometer and viable cells were calculated after subtraction of the number of dead cells determined by using PI staining. (B) Percent distribution (left) or total cellular expression (right) of KIT protein as determined by FACS analysis where data for HMC-1.3 is the average of both 1H9 and 2E2 subclones. Intracellular KIT was estimated from the difference between total and cell surface. *p<0.05 using an unpaired t-test. Shown is the Mean ± SD. (C) Western blot analysis showing constitutive phosphorylation of proteins in prominent oncogenic KIT signaling pathways in the indicated HMC-1 cell lines grown in normal culture conditions. Representative blots are on the left and quantifications of the average relative band intensities are on the bar graphs on the right (Mean ± SD; n ≥ 3 independent experiments). Relative band intensities in each sample were corrected by the relative intensity of β-actin or total protein expression (as indicated) and expressed as fold change compared to HMC-1.1. *p<0.05; **p<0.01 using unpaired t-tests. (D) Western blot analysis showing phosphorylation changes induced by 100 ng/mL SCF for the indicated times. Cells were serum starved for 2 h before the addition of SCF. Representative blots are on the left and quantifications of the average changes in relative band intensities are on the right (Mean ± SD of 2 to 3 independent experiments). Relative band intensities in each sample were normalized to the relative intensity of β-actin and expressed as fold change compared to HMC-1.1. Full scans of blots shown in (C, D) are shown in Supplementary Figures 8 , 9 , respectively.
Figure 3
Figure 3
Repair of the G560V-KIT mutation in HMC-1.2 results in distinct transcriptional patterns and reduced pathways that promote survival. (A) Principal component analysis plot (Limma) of RNAseq analysis from HMC-1.1, HMC-1.2 and HMC-1.3 subclones illustrating total transcriptional differences between the sublines. (B) Heatmap of 6000 differentially expressed genes between the indicated HMC-1 sublines. (C) Z-Scores of Functions Annotations predicted to be significantly altered in HMC-1.3 compared to HMC-1.2 using QIAGEN IPA. Each bar represents the average z-scores (Mean ± SD) of similar Functions Annotations terms. These Functional Annotations were categorized by IPA in four top Molecular and Cellular Functions categories: Cellular Movement, Cell Death and Survival, Cell-to-Cell Signaling and Interaction, and Cell Signaling and Molecular transport. (D) Relative mRNA expression of the antiapoptotic gene MCL1 and the pro-apoptotic BIM (BCL2L11) in the HMC-1.2 and HMC-1.3 sublines, as indicated. The mRNA levels relative to GAPDH and ACTB (ΔCt) were determined by qPCR. Data are expressed as Mean ± SEM of 3 or 4 independent experiments. * p<0.05; ** p<0.01 using an unpaired t-test. (E) Percentage of dead cells in standard growing conditions for 72 h (n=13 experiments; Mean ± SEM) or at days 2, 3, and 6, as indicated (n=3 independent experiments, Mean ± SD). (F) Effect of BCL-2 inhibitor (venetoclax) on growth and cell death (n=3 independent experiments; Mean ± SD). Viable and dead cells were determined using PI staining and a Celigo Image Cytometer. Data on HMC-1.3 are the average of both 1H9 and 2E2 subclones. *p<0.05; **p<0.01; ***p<0.001; **** p<0.0001 unpaired t-tests or when indicated with a bracket on the side of the curves, two-way ANOVA.
Figure 4
Figure 4
Repair of the V560G-KIT mutation in HMC-1.2 results in diminished tumor growth and metastasis. (A) Illustration of the xenograft protocol. Mice (6 per group) were injected with 1 × 10⁶ HMC-1.2 or HMC 1.3 cells (shown is the 1H9 subclone; similar results were obtained using the other subclone 2E2) into the right flank subcutaneously. Once the tumor volume reached 50 mm3 (usually 18-25 days after injection), measurements were performed daily using a caliper. On day 14, mice were euthanized for tissue collection. This illustration was created using Biorender (biorender.com) (agreement number BT24ABIPLB). (B) Tumor volume measurements on live mice over time. ****p<0.0001 between curves using a two-way ANOVA test. Representative images of the appearance of tumors at endpoint in mice injected with either HMC-1.2 or HMC-1.3 cells. (C) Weight of tumors excised on day 14 from mice injected with either HMC-1.2 or HMC-1.3 cells. The images on the right are all fixed tumors collected in this experiment. (D) Histology slides of excised tumors from mice injected with HMC-1.2 and HMC-1.3 stained with anti-KIT or H&E, as indicated. (E) Average of spleen and liver weights on day 14. (F) Representative images of well-formed foci in livers from mice injected with HMC-1.2 cells or groups of >3 KIT positive cells in livers of mice injected with HMC-1.3 cells (indicated by arrows). KIT immunostaining and H&E staining are shown as indicated. The graph represents the numbers of groups of > 3 cells or foci containing KIT-positive cells in the histological slides (each dot represents one mouse). Data represent Mean ± SD. *p<0.05; ***p<0.001 using unpaired t-tests.
Figure 5
Figure 5
Repair of the G560V-KIT mutation in HMC-1.2 results in higher sensitivity to common tyrosine kinase inhibitors and JAK2 inhibitors. Effects of the indicated tyrosine kinase inhibitors on cell growth (A) and cell death (B) in HMC-1.2 and HMC-1.3 cells. Graph represents the percentage of viable or dead cells after 72 h in the presence of the indicated concentrations of inhibitors compared to the corresponding cells treated with vehicle (0 µM). Effects of the JAK inhibitors on cell growth (C) and cell death (D) in HMC-1.2 and HMC-1.3 cells. Graph represents the percentage of viable or dead cells after 72 h in the presence of the indicated concentrations of inhibitors compared to cells treated with vehicle (0 µM). Total cells were counted using a Celigo Image Cytometer and viable cells calculated after subtraction of dead cells which were positive for PI staining. In (A-D), data represent Mean ± SD of 3 independent experiments. ns not significant; *p<0.05; **p<0.01; ***p<0.001; ****p<0.0001 using two-way ANOVA are indicated as brackets between the curves. Note that there were no differences between the curves of inhibition by midostaurin, but at 0.25 µM the percentage inhibition was significantly greater in HMC-1.3 (* p<0.05) using multiple comparison 2-way ANOVA). Data on HMC-1.3 are the average of both 1H9 and 2E2 subclones.

Similar articles

Cited by

References

    1. Cruse G, Metcalfe DD, Olivera A. Functional deregulation of KIT: link to mast cell proliferative diseases and other neoplasms. Immunol Allergy Clin North Am (2014) 34(2):219–37. doi: 10.1016/j.iac.2014.01.002 - DOI - PMC - PubMed
    1. Galli SJ, Tsai M, Wershil BK, Tam SY, Costa JJ. Regulation of mouse and human mast cell development, survival and function by stem cell factor, the ligand for the c-kit receptor. Int Arch Allergy Immunol (1995) 107(1-3):51–3. doi: 10.1159/000236928 - DOI - PubMed
    1. Jensen BM, Akin C, Gilfillan AM. Pharmacological targeting of the KIT growth factor receptor: a therapeutic consideration for mast cell disorders. Br J Pharmacol (2008) 154(8):1572–82. doi: 10.1038/bjp.2008.204 - DOI - PMC - PubMed
    1. Lennartsson J, Ronnstrand L. Stem cell factor receptor/c-kit: from basic science to clinical implications. Physiol Rev (2012) 92(4):1619–49. doi: 10.1152/physrev.00046.2011 - DOI - PubMed
    1. Lennartsson J, Jelacic T, Linnekin D, Shivakrupa R. Normal and oncogenic forms of the receptor tyrosine kinase kit. Stem Cells (2005) 23(1):16–43. doi: 10.1634/stemcells.2004-0117 - DOI - PubMed

Publication types

Substances