. 2023 Jun 9;51(10):e58.
doi: 10.1093/nar/gkad262.

exFINDER: identify external communication signals using single-cell transcriptomics data

Affiliations

exFINDER: identify external communication signals using single-cell transcriptomics data

Changhan He et al. Nucleic Acids Res. .

Abstract

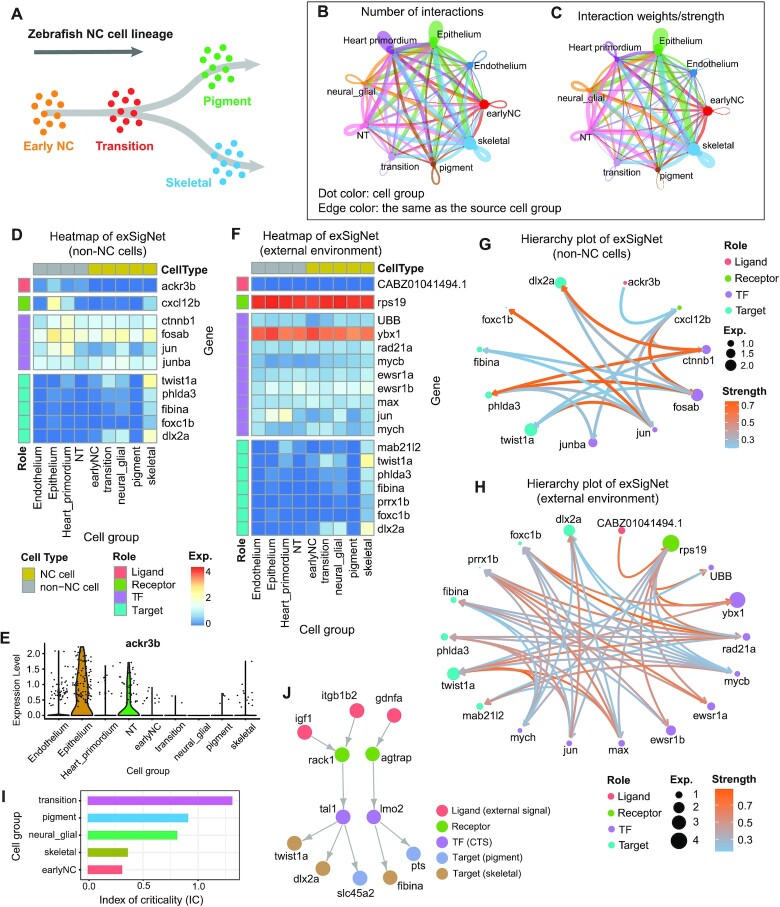
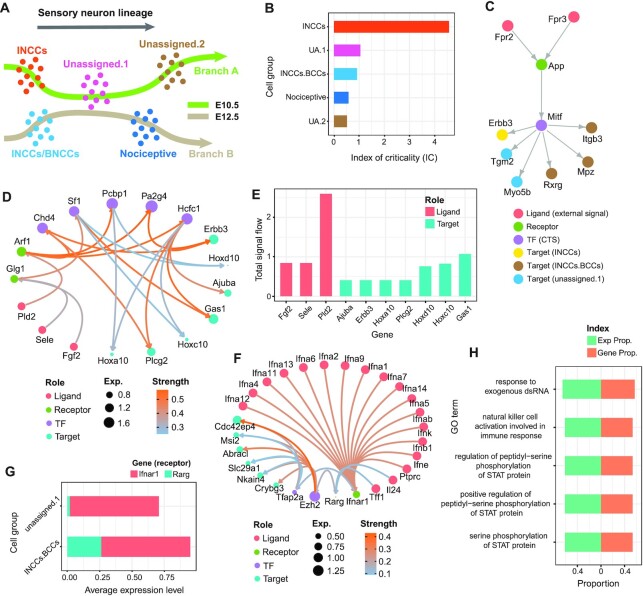
Cells make decisions through their communication with other cells and receiving signals from their environment. Using single-cell transcriptomics, computational tools have been developed to infer cell-cell communication through ligands and receptors. However, the existing methods only deal with signals sent by the measured cells in the data, the received signals from the external system are missing in the inference. Here, we present exFINDER, a method that identifies such external signals received by the cells in the single-cell transcriptomics datasets by utilizing the prior knowledge of signaling pathways. In particular, exFINDER can uncover external signals that activate the given target genes, infer the external signal-target signaling network (exSigNet), and perform quantitative analysis on exSigNets. The applications of exFINDER to scRNA-seq datasets from different species demonstrate the accuracy and robustness of identifying external signals, revealing critical transition-related signaling activities, inferring critical external signals and targets, clustering signal-target paths, and evaluating relevant biological events. Overall, exFINDER can be applied to scRNA-seq data to reveal the external signal-associated activities and maybe novel cells that send such signals.


Figures

Figure 1.
Figure 1.
Overview of exFINDER. (A) exFINDER requires scRNA-seq data, user-assigned cell cluster labels and user-selected target genes as inputs. (B) Additional information, such as differentially expressed genes, pseudo time, and critical transition analysis information, can be included for specific biological problems. (C) exFINDER first infers the ligand–target GRN based on the structure of ligand–receptor–transcriptional factors–target (L–R–TF–T) from exFINDER-DB. It identifies external signals using the scRNA-seq data and infers their corresponding exSigNet. (D) exFINDER predicts the signaling strength, visualizes the exSigNet, and quantitatively analyzes the networks through graph theory methods for interpretation of exSigNet, including identifying critical ligands and target genes, classifying networks between different ligand–target pairs, finding external signal-activated pathways, uncovering critical transition-related signaling networks, and evaluating GO analysis outputs.
Figure 2.
Figure 2.
Benchmarking exFINDER using human skin data. (A, B) The significant ligand–receptor interactions among four cell populations inferred by CellChat. Each dot color represents one cell group, and the edge color is the same as the cell group sending the signal. The dot size is proportional to the population size of the indicated cell group. The edge width is proportional to the indicated number (A) and strength (B) of ligand–receptor pairs. (C) A schematic of the exFINDER-inferred signaling network targeting FBN1+ FIB cells. (D) Heatmap of the expression level of all inferred signals across four cell population groups, with ligand APOE identified as an external signal. (E) Heatmap showing the percentages of ligands inferred by CellChat and ICELLNET as well as captured by exFINDER. The X-axis represents the cell population groups expressing the ligands, and Y-axis represents the cell population groups receiving the signals. The color bar is the percentages of CellChat (top) and ICELLNET (bottom)-inferred ligands that are also identified by exFINDER. The 5th column shows the ligand recovery rate of exFINDER only using prior knowledge, and the rest four columns show the ligand recovery rate of exFINDER using both prior knowledge and the scRNA-seq data. And the grey block indicates no such ligands inferred by CellChat or ICELLNET. (F) Heatmap of the expression level of the components in the exSigNet built by exFINDER.
Figure 3.
Figure 3.
exFINDER identifies cell differentiation-associated external signals during zebrafish neural crest (NC) development. (A) Schematic of neural crest cell lineage, showing the cell differentiation process along the timeline (46). (BC) CellChat analysis for the number and strength of ligand–receptor interactions between different cell populations. (D) Expression heatmap of the exSigNet associated with the inferred signals produced by non-NC cells targeting skeletal cell marker genes. (E) Expression levels of inferred signal ackr3b in each cell group. (F) Expression heatmap of the exSigNet associated with the inferred signals coming from the external environment targeting skeletal cell marker genes. (G, H) Circle plots showing the exSigNets. Node size is proportional to the gene expression level, and the color bar represents the predicted signaling strength. (I) Index of criticality of different NC cell groups generated by BioTIP. (J) Critical transition signal-involved exSigNet inferred by exFINDER.
Figure 4.
Figure 4.
exFINDER identifies external signals and predicts critical signal sources and targets during sensory neurogenesis in the mouse. (A) Schematics of neural crest cell lineage showing cell differentiation from UA.3 cells to the mechanoreception and proprioception cells (61). (B) Expression heatmap of the exSigNet associated with the inferred external signals targeting the proprioception cell marker genes. (C) Hive plot showing the exSigNet. (D) Activation index of the full exSigNet and SLURP-related exSigNet. (E) Circle plot showing the SLURP-related exSigNet. (F) Clustering of the signaling network between different ligand–target pairs. (G) Bar plot of the total signal inflows and outflows of each external signal and target gene, respectively. (H) The expression and gene proportions of top 5 GO terms projecting to the exSigNet.
Figure 5.
Figure 5.
exFINDER suggests roles of external signals in different trajectories and predicts the transition paths during mouse sensory neurogenesis. (A) Schematics showing two branches and the corresponding cell groups. (B) Bar plot showing the index of criticality of cell groups along two branches generated by BioTIP. (C) The network inferred by exFINDER showing the critical transition signal-involved exSigNet. (D) Circle plot for the exSigNet linking external signals and marker genes of INCCs. (E) Bar plot of the total signal inflows and outflows of each external signal and target gene, respectively. (F) Circle plot showing the exSigNet linking external signals and marker genes of nociceptive cells. (G) Bar plot of the expression levels of the receptors in different cell groups. (H) The expression and gene proportions of top 5 GO terms projecting to the exSigNet.
Figure 6.
Figure 6.
exFINDER uncovers the externally added inducers, revealing signaling pathways driving EMT. (A–C) Expression heatmaps of the exSigNets associated with the inferred external signals targeting the EMT regulators under different inducer-treatments in the A549 cells. (DE) Circle plots showing the TGFB1-related and TNF-related exSigNets under the corresponding inducer-treatment in the A549 cells. (F) Box plots of the inferred receptors in different human cell types under different inducer-treatments, solid bar represents the median and the black dot represents the average.

Update of

Similar articles

Cited by

References

    1. Kozar K., Ciemerych M.A., Rebel V.I., Shigematsu H., Zagozdzon A., Sicinska E., Geng Y., Yu Q., Bhattacharya S., Bronson R.T.et al. .. Mouse development and cell proliferation in the absence of D-cyclins. Cell. 2004; 118:477–491. - PubMed
    1. Basson M.A. Signaling in cell differentiation and morphogenesis. Cold Spring Harb. Perspect. Biol. 2012; 4:a008151. - PMC - PubMed
    1. Richardson B.E., Lehmann R.. Mechanisms guiding primordial germ cell migration: strategies from different organisms. Nat. Rev. Mol. Cell Biol. 2010; 11:37–49. - PMC - PubMed
    1. Plas D.R., Thompson C.B.. Cell metabolism in the regulation of programmed cell death. Trends Endocrinol. Metab. 2002; 13:75–78. - PubMed
    1. Deftos M.L., Bevan M.J.. Notch signaling in T cell development. Curr. Opin. Immunol. 2000; 12:166–172. - PubMed

Publication types

MeSH terms