. 2023 May 22;51(9):4191-4207.
doi: 10.1093/nar/gkad265.

The ADAR1 editome reveals drivers of editing-specificity for ADAR1-isoforms

Affiliations

The ADAR1 editome reveals drivers of editing-specificity for ADAR1-isoforms

Renata Kleinova et al. Nucleic Acids Res. .

Abstract

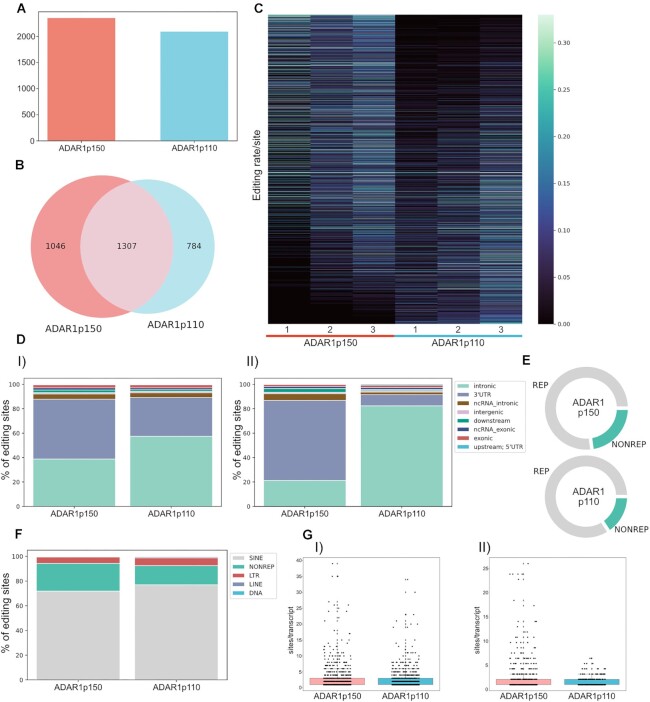
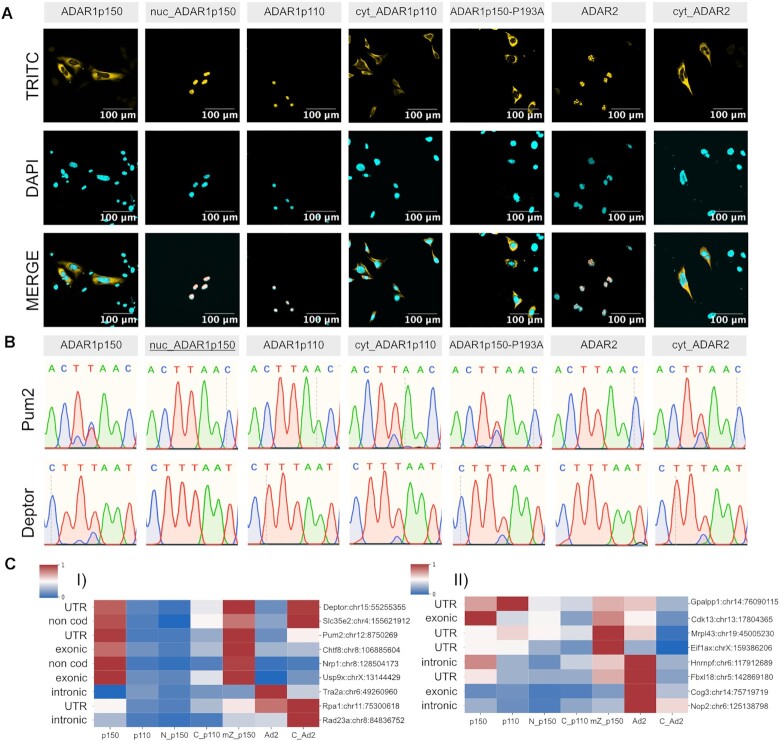
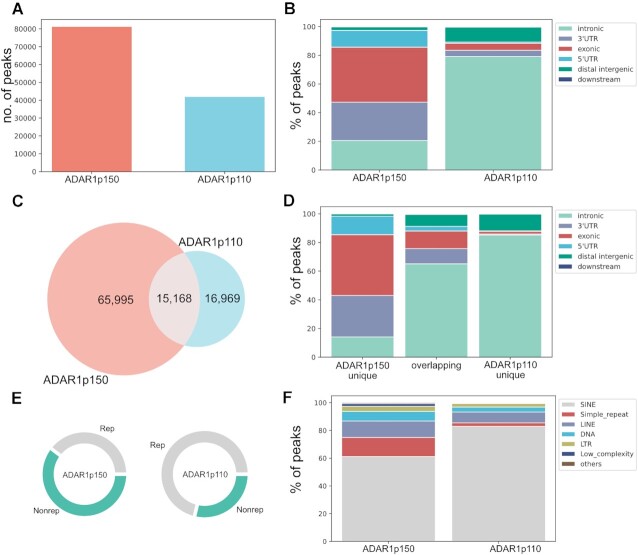
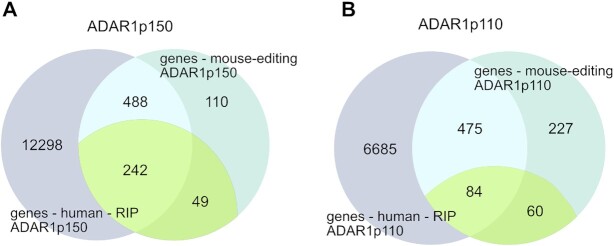
Adenosine deaminase acting on RNA ADAR1 promotes A-to-I conversion in double-stranded and structured RNAs. ADAR1 has two isoforms transcribed from different promoters: cytoplasmic ADAR1p150 is interferon-inducible while ADAR1p110 is constitutively expressed and primarily localized in the nucleus. Mutations in ADAR1 cause Aicardi - Goutières syndrome (AGS), a severe autoinflammatory disease associated with aberrant IFN production. In mice, deletion of ADAR1 or the p150 isoform leads to embryonic lethality driven by overexpression of interferon-stimulated genes. This phenotype is rescued by deletion of the cytoplasmic dsRNA-sensor MDA5 indicating that the p150 isoform is indispensable and cannot be rescued by ADAR1p110. Nevertheless, editing sites uniquely targeted by ADAR1p150 remain elusive. Here, by transfection of ADAR1 isoforms into ADAR-less mouse cells we detect isoform-specific editing patterns. Using mutated ADAR variants, we test how intracellular localization and the presence of a Z-DNA binding domain-α affect editing preferences. These data show that ZBDα only minimally contributes to p150 editing-specificity while isoform-specific editing is primarily directed by the intracellular localization of ADAR1 isoforms. Our study is complemented by RIP-seq on human cells ectopically expressing tagged-ADAR1 isoforms. Both datasets reveal enrichment of intronic editing and binding by ADAR1p110 while ADAR1p150 preferentially binds and edits 3'UTRs.


Figures

Figure 1.
Figure 1.
ADAR1p150 and ADAR1p110 display isoform-specific editing patterns. (A) 2353 editing sites are efficiently edited (≥1% editing ratio) by ADAR1p150, and 2091 sites are efficiently edited by ADAR1p110. (B) Of the detected sites ≈ 42% are efficiently edited by both isoforms (1307); 33% are preferentially edited by ADAR1p150 (1046), and nearly 25% are preferentially edited by ADAR1p110 (784). (C) Heat map showing editing ratio of detected editing sites. Despite the large overlap of editing sites between ADAR1-isoforms, the majority of sites still shows a clear preference for one or another isoform. The sites were sorted based on log2-fold difference in editing ratio (p110/p150 in ascending order, showing the sites preferentially edited by ADAR1p150 on the top and sites edited by ADAR1p110 on the bottom of the heatmap. (D) Gene-region distribution of editing sites for ADAR1-isoforms. (I) Distribution of all efficiently edited sites. ADAR1p110 edits prevalently in introns. Apart from the intronic regions, ADAR1p150 efficiently edits a prominent portion of 3'UTRs. (II) Distribution of editing sites that are preferentially edited by one isoform over the other (sites with log2FD ≥ 1 for ADAR1p110 and sites with log2FD ≤ –1 for ADAR1p150). Editing sites edited by ADAR1p110 are almost exclusively intronic, whereas a major portion of ADAR1p150 specific sites locates to 3'UTRs. (E) ADAR1p150 edits more nonrepetitive regions (∼23%) than ADAR1p110 (∼16%). (F) The majority of editing is located within SINE elements. G) ADAR1p150 edits more hyperedited regions. I) Boxplot of all detected sites; II) Boxplot of sites preferentially edited by one isoform (sites with log2FD ≥ 1 for ADAR1p110 and sites with log2FD ≤ –1 for ADAR1p150). Box depicts range from the 25th to 75th percentile. Whiskers depict 1.5× interquartile range from top/bottom of box. Black dots mark number of editing events per transcript. Grey dots depict outliers.
Figure 2.
Figure 2.
ADAR1-isoform specificity is partially driven by its cellular localization. (A) Confocal microscopy images confirm the cellular localization of mislocalized ADAR mutants. A P193A mutation in ZBDα remains cytoplasmic. TRITC channel shows transfected constructs in confocal sections. DNA is stained with DAPI (scale bar: 100 μm). (B) Sanger sequencing traces showing the impact of mislocalization and ZBDα mutation on editing-specificity of ADAR1. Pum2 (chr12:8750269) and Deptor (chr15:55255355) are efficiently edited by wild-type ADAR1p150 but not by wild-type ADAR1p110. Cytoplasmic ADAR1p110 and cytoplasmic ADAR2 also edit both selected targets, however, only at one of the two adjacent sites. In contrast, nuclear ADAR1p150 does not show any editing of selected targets. The P193A mutation does not affect Deptor editing but leads to reduced editing at one of the two sites in Pum2. The reverse strand is sequenced showing T to C conversion in the chromatogram. (C) Heat maps of editing by wild-type and mutated ADAR versions at selected editing sites detected by amplicon-seq. I) Impact of mislocalization on editing of ADAR1p150 targets. II) Impact of mislocalization on editing of ADAR1p110 targets. At ADAR1p150 sites, the P193A mutation does not affect editing but nuclear localization of ADAR1p150 reduces editing. At the same time, cytoplasmic localization of ADAR1p110 or ADAR2 allows editing of ADAR1p150 sites (p150 = ADAR1p150, p110 = ADAR1p110, N_p150 = nuclear ADAR1p150, C_p110 = cytoplasmic ADAR1_p110, mZ_p150 = mutant ZBD in ADAR1p150, Ad2 = ADAR2, C_Ad2 = cytoplasmic ADAR2). Names and chromosomal positions of editing sites are indicated at the right of the heat map.
Figure 3.
Figure 3.
RIP-seq identifies distinct binding regions for ADAR1-isoforms. (A) Number of peaks identified by peak-caller after passing filtering criteria. ADAR1p150: 81.163, ADAR1p110: 41.900. (B) Peak-distribution in gene regions. ADAR1p110 mainly binds in introns whereas ADAR1p150 shows more complex binding involving exons and 3'UTRs. (C) Isoform-specific and overlapping peaks (depicted ADAR1p150 overlap – 15.168 overlapping peaks). (D) Distribution of isoform-specific and overlapping peaks to gene regions. (E) Peak distribution to repeats and non-repetitive regions. While only 29% of ADAR1p110-peaks cover unique regions >60% of ADAR1p150-peaks span non-repetitive regions. (F) The majority of interacting repeats locates to SINE elements, especially in the case of ADAR1p110. ADAR1p150 binds more diverse repeats, including also simple repeats, LINE and DNA transposons.
Figure 4.
Figure 4.
Intersection of regions bound by ADAR1 isoforms identified by ADAR1 RIP-seq in human cells with editing regions identified in mouse genes. (A) More than 80% (242) of the genes containing non-repetitive editing sites were detected in both experiments performed with ADAR1p150. (B) Only ∼59% (84) was identified between two experimental approaches for ADAR1p110. In purple: genes that were identified by RIP-seq in human cells; turquoise: genes that were identified as editing targets in MEFs; yellow-green: genes containing editing sites in non-repetitive regions and those that were edited in MEFs.
Figure 5.
Figure 5.
Discussion supporting figure. (A, B) Intersection between the peaks identified in this study by MB-UV RIP-seq in HEK cells and editing sites identified by Sun et al. in HEK cells (54). Red and light-blue sections of doughnut plots display the portion of editing sites overlapping with RIP-seq peaks. (A, I) Overlap of ADAR1p150-specific editing sites and ADAR1p150-peaks. (II) Overlap of ADAR1p150-specific editing sites and ADAR1p110-peaks. (B, I) Overlap of editing sites targeted by both ADAR1 isoforms and ADAR1p150-peaks. (II) Overlap of sites edited by both ADAR1 isoforms and ADAR1p110-peaks. (C) Comparison of ADAR1-editome identified in MEFs and ADAR1p150-specific editing sites detected in the brain and the thymus of ADAR1p110−/− ADAR2−/−. (I) Editing sites identified as ADAR1p150-specific in the brain. (II) Editing sites identified as ADAR1p150-specific in the thymus. (D) ADAR1p150 and ADAR1p110-mediated editing ratios detected in MEFs for sites that overlap with ADAR1p150 sites in the brain identified by (Kim et al., 2021).

References

    1. Nishikura K. A-to-I editing of coding and non-coding RNAs by ADARs. Nat. Rev. Mol. Cell Biol. 2016; 17:83–96. - PMC - PubMed
    1. Bazak L., Haviv A., Barak M., Jacob-Hirsch J., Deng P., Zhang R., Isaacs F.J., Rechavi G., Li J.B., Eisenberg E.et al. .. A-to-I RNA editing occurs at over a hundred million genomic sites, located in a majority of human genes. Genome Res. 2014; 24:365–376. - PMC - PubMed
    1. Licht K., Kapoor U., Amman F., Picardi E., Martin D., Bajad P., Jantsch M.F.. A high resolution A-to-I editing map in the mouse identifies editing events controlled by pre-mRNA splicing. Genome Res. 2019; 29:1453–1463. - PMC - PubMed
    1. Picardi E., D’Erchia A.M., Lo Giudice C., Pesole G.. REDIportal: a comprehensive database of A-to-I RNA editing events in humans. Nucleic Acids Res. 2017; 45:D750–D757. - PMC - PubMed
    1. Peng Z., Cheng Y., Tan B.C., Kang L., Tian Z., Zhu Y., Zhang W., Liang Y., Hu X., Tan X.et al. .. Comprehensive analysis of RNA-Seq data reveals extensive RNA editing in a human transcriptome. Nat. Biotechnol. 2012; 30:253–260. - PubMed

Publication types