. 2023 Jul 7;51(12):5948-5980.
doi: 10.1093/nar/gkad259.

Diverse targets of SMN2-directed splicing-modulating small molecule therapeutics for spinal muscular atrophy

Affiliations

Diverse targets of SMN2-directed splicing-modulating small molecule therapeutics for spinal muscular atrophy

Eric W Ottesen et al. Nucleic Acids Res. .

Abstract

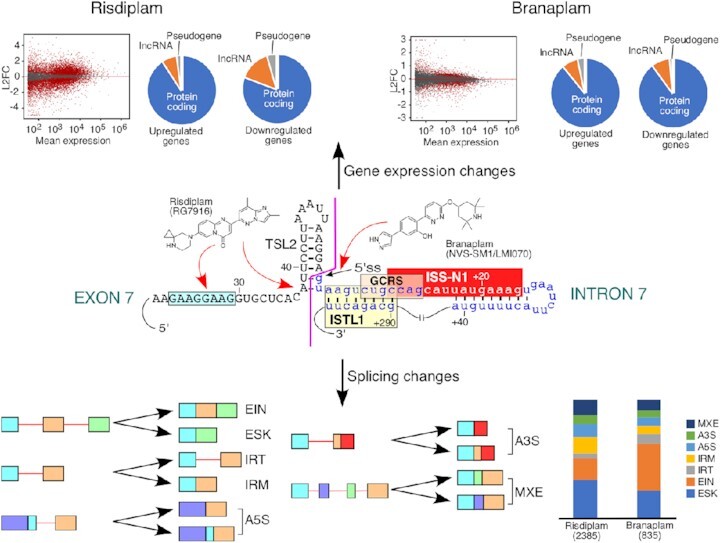
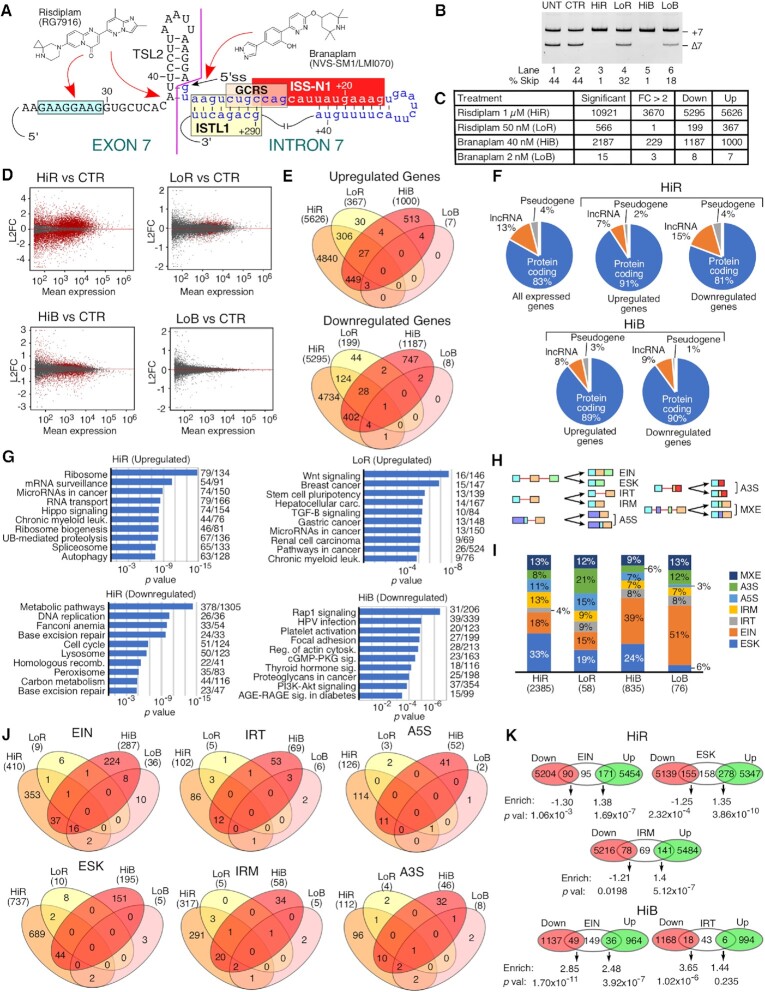
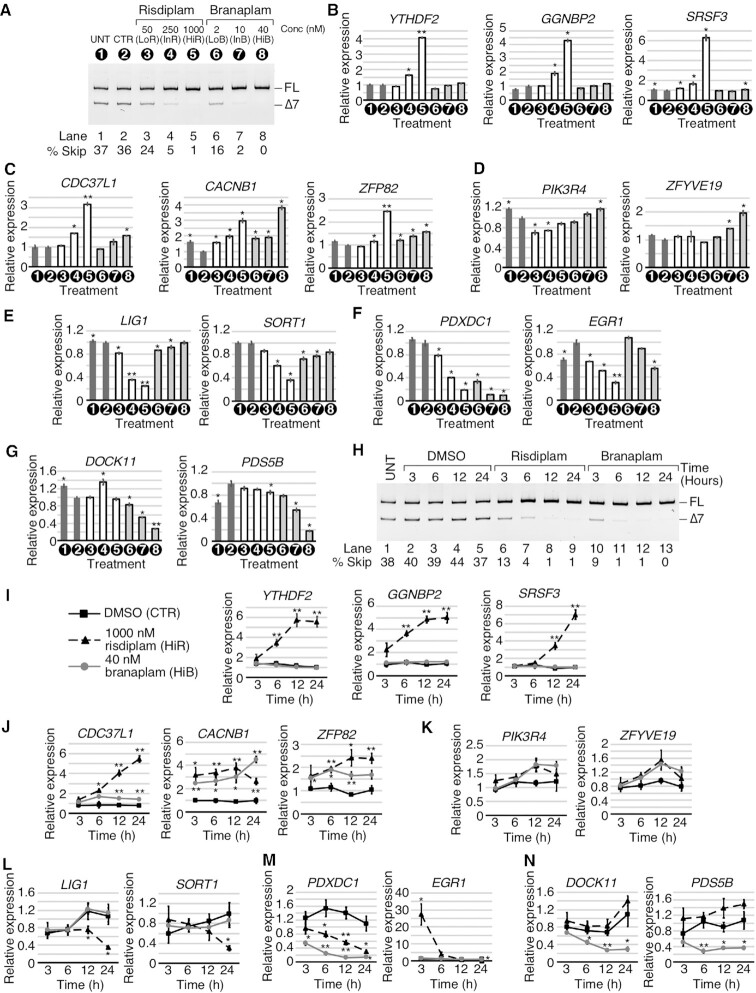
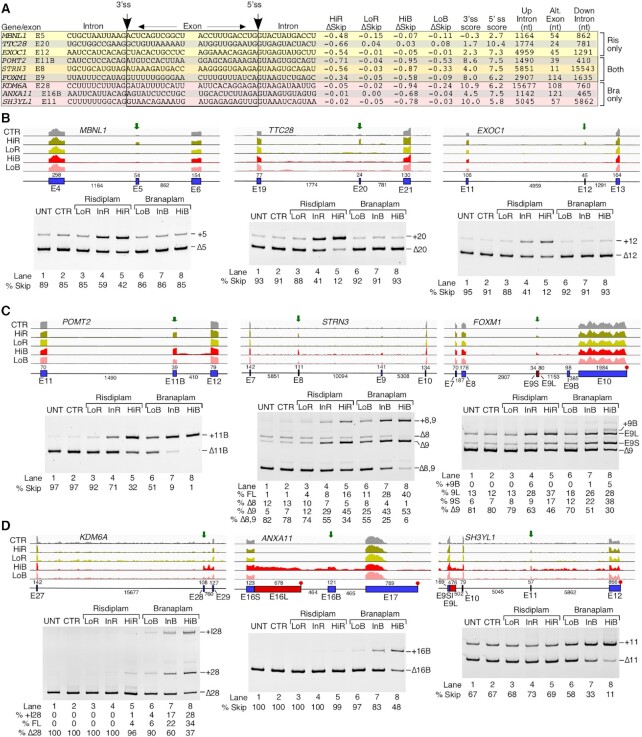
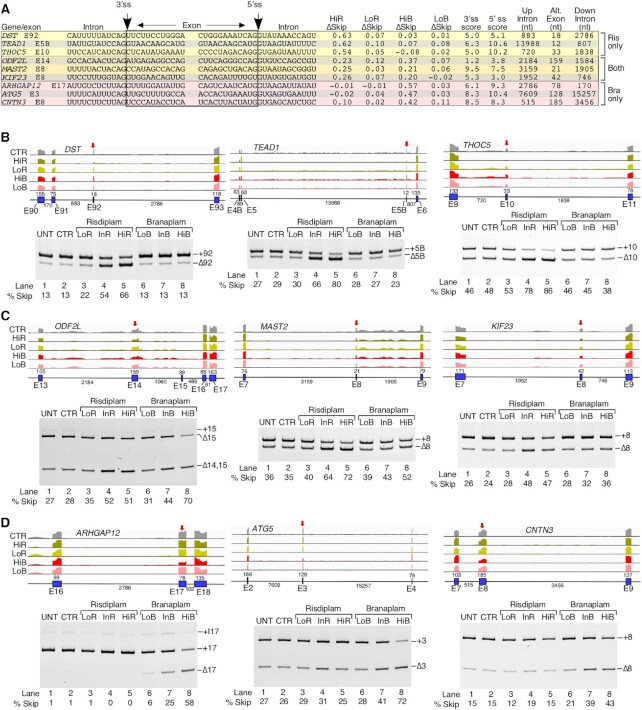
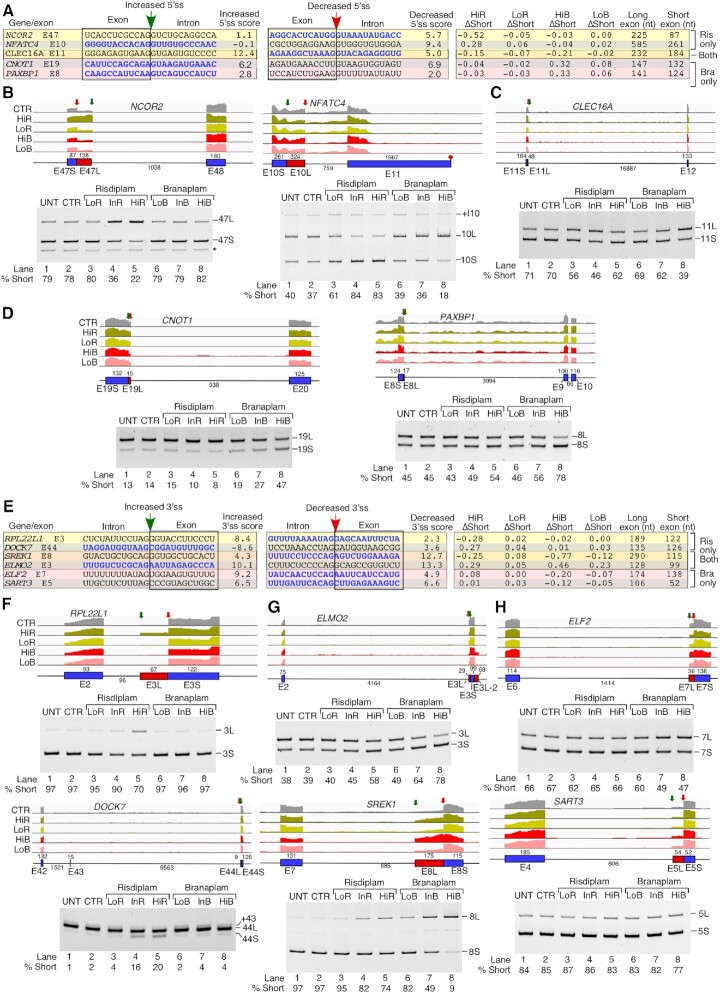
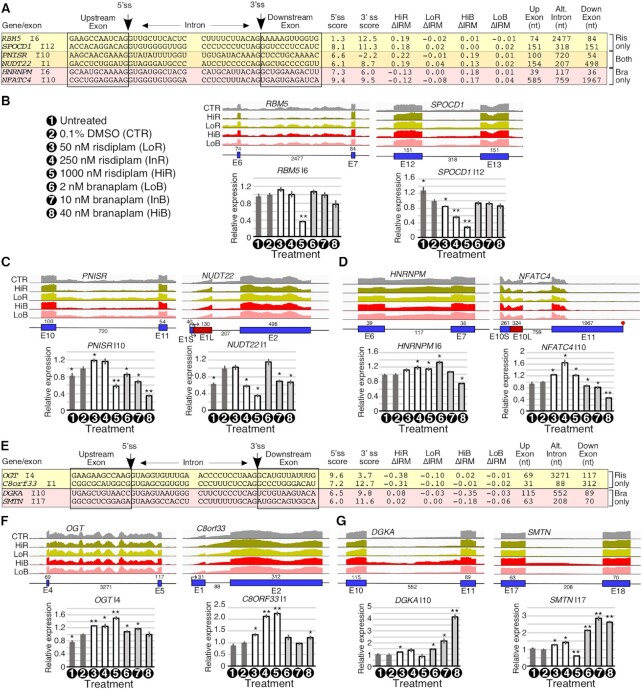
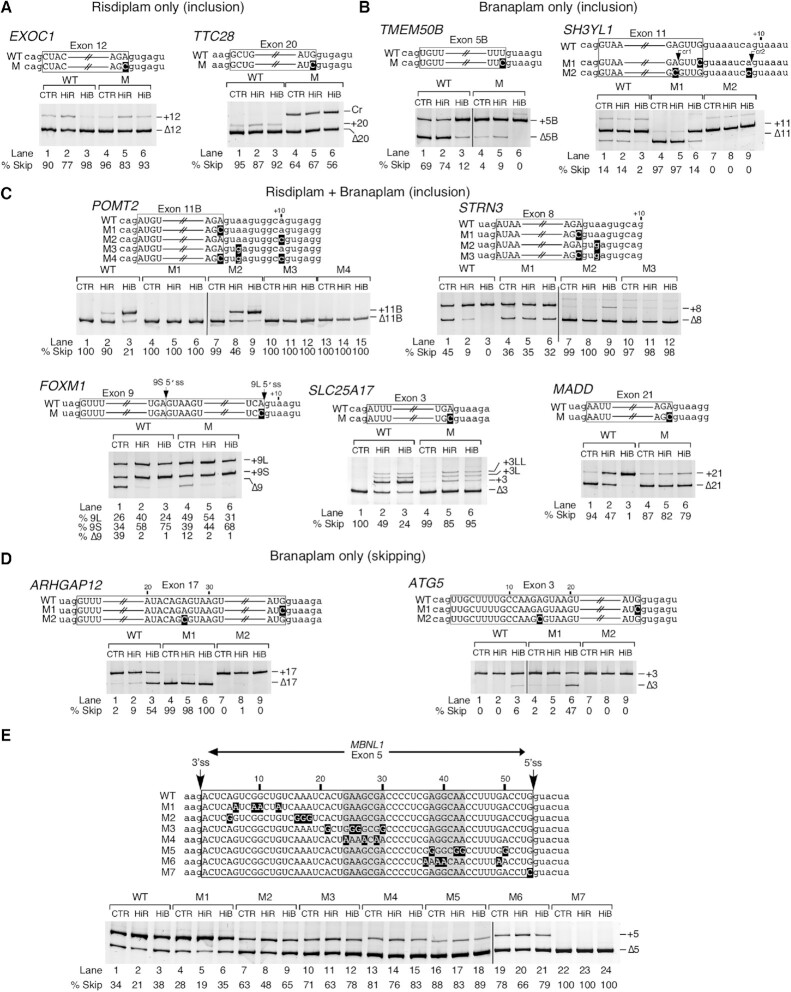
Designing an RNA-interacting molecule that displays high therapeutic efficacy while retaining specificity within a broad concentration range remains a challenging task. Risdiplam is an FDA-approved small molecule for the treatment of spinal muscular atrophy (SMA), the leading genetic cause of infant mortality. Branaplam is another small molecule which has undergone clinical trials. The therapeutic merit of both compounds is based on their ability to restore body-wide inclusion of Survival Motor Neuron 2 (SMN2) exon 7 upon oral administration. Here we compare the transcriptome-wide off-target effects of these compounds in SMA patient cells. We captured concentration-dependent compound-specific changes, including aberrant expression of genes associated with DNA replication, cell cycle, RNA metabolism, cell signaling and metabolic pathways. Both compounds triggered massive perturbations of splicing events, inducing off-target exon inclusion, exon skipping, intron retention, intron removal and alternative splice site usage. Our results of minigenes expressed in HeLa cells provide mechanistic insights into how these molecules targeted towards a single gene produce different off-target effects. We show the advantages of combined treatments with low doses of risdiplam and branaplam. Our findings are instructive for devising better dosing regimens as well as for developing the next generation of small molecule therapeutics aimed at splicing modulation.


Figures

Graphical Abstract
Graphical Abstract
Diverse targets of SMN2-directed splicing-modulating small molecule therapeutics for spinal muscular atrophy.
Figure 1.
Figure 1.
High doses of risdiplam and branaplam cause massive changes in the transcriptome. (A) Structures and proposed interaction sites of risdiplam and branaplam. Sequences and selected structures surrounding the 5′ss of SMN are shown. Cis-elements are labeled and indicated with colored boxes. Exonic sequences are shown in uppercase, intronic sequences in lowercase. Neutral numbering indicates position within exon 7, and positive numbering within intron 7. (B) Representative gel image showing the splicing pattern of SMN2 exon 7 in GM03813 fibroblasts treated with different concentrations of small molecules. Splice isoform identities are indicated at the right side of the gel. Densitometric quantification of exon skipping relative to total RNA expression is indicated at the bottom. Abbreviations: UNT, untreated; CTR, 0.1% DMSO control; HiR, high concentration of risdiplam; LoR, low concentration of risdiplam; HiB, high concentration of branaplam; LoB, low concentration of branaplam. (C) Table summarizing transcriptomic changes detected by RNA-Seq after treatment with the indicated concentrations of the compounds. Significant genes indicate genes with Benjamini and Hochberg-adjusted P-value (adj. P) <0.05. FC >2 indicates genes with more than 2-fold up- or down-regulation. (D) MA plots depicting gene expression changes upon treatment with HiR, LoR, HiB or LoB compared with DMSO control. The y-axis represents the log2 fold change (L2FC) of treated cells compared with DMSO-treated control. The x-axis represents the mean expression in normalized read counts per gene. Red dots indicate genes with significantly altered expression levels (adj. P <0.05). Gray dots indicate unchanged or insignificant genes. (E) Four-way Venn diagrams examining the overlap between upregulated (top) and downregulated (bottom) genes after treatment with high and low doses of the compounds. Each treatment type along with the total number of affected genes are indicated at the top. (F) Proportion of protein-coding genes, pseudogenes and lncRNAs among differentially affected genes after HiR and HiB treatment. (G) The top 10 enriched KEGG pathways among upregulated genes after HiR treatment (top left) and LoR treatment (top right), and downregulated genes after HiR treatment (bottom left) and HiB treatment (bottom right). There were few enriched pathways among upregulated genes after HiB treatment or among downregulated genes after LoR treatment, and not enough affected genes after LoB treatment to perform pathway analysis. The category of expression change and treatment type are indicated at the top of each panel. Pathway names are given on the left side, and numbers of affected genes/total genes in each pathway are indicated on the right. The x-axis represents the P-value of enrichment. (H) Diagrammatic representation of each type of alternative splicing event under investigation. Exons are shown as colored boxes, introns as red lines. Abbreviations: EIN, exon inclusion; ESK, exon skipping; IRT, increased intron retention; IRM, improved intron removal; A5S, alternative 5′ splice site; A3S, alternative 3′ splice site; MXE, mutually exclusive/mixed exons. (I) Stacked bar chart representing the distribution of different types of alternative splicing events affected by high and low doses of the compounds. Color coding for each event type is indicated at the right side of the graph. The treatment and total number of affected events are shown at the bottom. The percentage of total events in each treatment is indicated for each category. (J) Four-way Venn diagrams comparing the alternative splicing events affected by each treatment. Each treatment along with the total number of affected alternative splicing events is indicated at the top. (K) Venn diagrams depicting the most significant overlaps between upregulated and downregulated genes and alternative splicing events after HiR and HiB treatment. For each overlap, enrichment was calculated and assigned a P-value relative to a random distribution using a hypergeometric test.
Figure 2.
Figure 2.
Risdiplam and branaplam affect gene expression in a concentration-dependent manner. (A) Representative gel image showing the splicing pattern of SMN2 exon 7 in GM03813 fibroblasts treated with different concentrations of risdiplam and branaplam. Numbers in black circles represent treatment type and are used throughout the figure. Other labeling is the same as in Figure 1B. (BD) qPCR results measuring the expression of specific genes that were upregulated by risdiplam treatment only (B), by both risdiplam and branaplam treatments (C) or by branaplam treatment only (D). The gene name is indicated above each graph. Treatment types are indicated under the x-axis. The y-axis represents the relative expression as compared with control (CTR) DMSO treatment. Error bars indicate the standard error of the mean (SEM); n= 3; *P <0.05; **P <0.01. (EG) qPCR results measuring the expression of specific genes that were downregulated by risdiplam treatment only (E), by both risdiplam and branaplam treatments (F) or by branaplam treatment only (G). Labeling is the same as in (B–D). (H) Representative gel image showing the splicing pattern of SMN2 exon 7 in GM03813 fibroblasts treated with HiR or HiB at different time points. Treatments and time are indicated at the top of the gel. Other labeling is the same as in Figure 1B. (I–N) qPCR results measuring the expression of the genes examined in (B–G) at different time points. Treatments are marked as indicated in (I). The x-axis represents time of treatment and the y-axis represents relative expression compared with untreated control. Error bars indicate the SEM; n= 3; *P <0.05; **P <0.01.
Figure 3.
Figure 3.
Risdiplam and branaplam promote off-target exon inclusion. (A) Table summarizing splicing-relevant information regarding the top candidate exons with increased inclusion after HiR treatment only, both treatments and after HiB treatment only. Shown sequences correspond to 12 nt located upstream and downstream of the 3′ss and 5′ss. Intronic and exonic sequences are indicated; in addition, exonic sequences are boxed. The 3′ss and 5′ss are marked by arrows. The identity of each exon is given at the beginning of each row. Whether each exon inclusion was affected by HiR or HiB treatment only, or by both, is denoted at the right side. ΔSkip indicates the change in the proportion of total transcript that has skipping of the indicated exon. 3′ss and 5′ss scores indicate the predicted strength of the splice sites as compared with the consensus sites. The last three columns indicate the sizes of the upstream intron, alternative exon and downstream intron. (BD) Genomic views of RNA-Seq reads (upper panels) and RT–PCR results (lower panels) examining EIN events that are triggered by HiR only (B), by both HiR and HiB (C) and by HiB only (D) in GM03813 fibroblasts. For genomic views, treatment types are indicated at the left, and exon/intron arrangement at the bottom. Exons are depicted as blue boxes and introns as black lines. Red boxes indicate longer forms of exons that can be generated by usage of an alternative 5′ss or 3′ss. Exon names and sizes are given below and above each exon, respectively. Intron sizes are indicated below each intron. Transcription termination sites are indicated with a red octagon. Green arrows mark the location of treatment-affected exons. For representative gel images showing the splicing pattern of specific exons, labeling is the same as in Figure 1B.
Figure 4.
Figure 4.
Risdiplam and branaplam promote off-target exon skipping. (A) Table summarizing splicing-relevant information regarding top exons, skipping of which was increased by HiR treatment only, by both HiR and HiB treatments and by HiB treatment only. Table contents are similar to those in Figure 3A. (BD) Genomic views of RNA-Seq reads (upper panels) and RT–PCR results (lower panels) examining ESK events that are triggered by HiR only (B), both HiR and HiB (C) and HiB only (D) in GM03813 fibroblasts. For genomic views, red arrows indicate the location of the affected exon. Other labeling and coloring are the same as in Figure 3B–D.
Figure 5.
Figure 5.
Risdiplam and branaplam affect usage of alternative 5′ss and 3′ss. (A) Table summarizing splicing-relevant information regarding the top candidate exons with altered 5′ss usage after HiR treatment only, both treatments or after HiB treatment only. Sequences represent 12 bases upstream and downstream of the two 5′ss with increased (left) and decreased usage (right) after small compound treatment. Intronic and exonic sequences are indicated; exonic sequences are boxed. The 5′ss score of each splice site is indicated to the right of each sequence. ΔShort indicates the change in proportion of total transcript with the shorter form of the exon due to the usage of the upstream 5′ss. The sizes of the long and short forms of the exon in question are indicated. (BD) Genomic views of RNA-Seq reads (upper panels) and RT–PCR results (lower panels) examining A5S events that are triggered by HiR alone (B), both HiR and HiB (C) and HiB alone (D) in GM03813 fibroblasts. For genomic views, green arrows indicate the location of the 5′ss with increased usage, red arrows the 5′ss with decreased usage. ‘L’ indicates a longer isoform of an exon due to usage of the downstream 5′ss; ‘S’, a shorter one due to usage of the upstream 5′ss. An asterisk marks a non-specific PCR product. Other labeling and coloring are the same as in Figure 3B–D. (E) Table summarizing splicing-relevant information regarding the top candidate exons with altered 3′ss usage after HiR treatment only, both treatments or after HiB treatment only. Table content is similar to (A), except that the 3′ss were analyzed. (FH) Genomic views of RNA-Seq reads (upper panels) and RT–PCR results (lower panels) examining A3S events that are triggered by HiR only (F), both HiR and HiB (G) and HiB only (H). For genomic views, in the case of >2 alternative 3′ss, the intermediate sized region is indicated with a pink box. Green arrows indicate the location of the 3′ss with increased usage, red arrows the 3′ss with decreased usage. ‘L’ indicates a longer isoform of an exon due to usage of the upstream 3′ss; ‘S’, a shorter one due to usage of the downstream 3′ss. Other coloring and labeling are the same as in (B–D).
Figure 6.
Figure 6.
Risdiplam and branaplam trigger changes in intron retention. (A) Table summarizing splicing-relevant information for the top candidate introns with improved removal after HiR only, both treatments or after HiB only. Shown sequences correspond to 12 nt upstream and downstream of the 5′ss and 3′ss that flank the affected intron. The 5′ss and 3′ss scores are given. ΔIRM indicates the change in intron removal after treatment (positive numbers indicate improved removal, and negative numbers indicate retention). The sizes of the upstream exon, affected intron and downstream exon are given. (BD) Genomic views of RNA-Seq reads (upper panels) and qPCR results (lower panels) examining IRM events affected by HiR only (B), both HiR and HiB (C) or HiB only (D) in GM03813 fibroblasts. For genomic views, coloring and labeling are the same as in Figure 3B–D. For qPCR, the gene symbol and measured intron are indicated above each graph. Treatments are indicated under the x-axis. Treatment symbols are the same as in Figure 2 and are described in the leftmost panel of (B). The y-axis represents the relative expression relative to DMSO-treated (CTR) cells of intron-containing transcripts corrected by total expression of the gene in question. Error bars indicate the SEM; n= 3; *P <0.05; **P <0.01. (E) Table summarizing splicing-relevant information for the top candidate introns with increased retention after HiR only or after HiB only. Table contents are similar to (A). (FG) Genomic views of RNA-Seq reads (upper panels) and qPCR measuring intron retention (lower panels) of IRT events affected by HiR alone (F) or HiB alone (G). Coloring, labeling and statistics are similar to (B–D).
Figure 7.
Figure 7.
Usage of minigenes provides insights into the mechanism of action of risdiplam and branaplam on splicing of off-target exons. (A) Enhanced inclusion of exons by HiR in transcripts generated from hybrid minigenes in HeLa cells. Diagrammatic representation of affected exons is given in the upper panel with the first four and last three exonic nucleotides shown in uppercase letters and immediate upstream and downstream intronic sequences in lowercase letters. Exon numbers and names of their corresponding genes are indicated at the top of the diagrams. Minigene names are given on the left. Mutated nucleotides are highlighted in white on a black background. Representative gel images showing the splicing pattern of hybrid minigenes in HeLa cells are given in the lower panel. Treatments and minigene names are presented at the top of each gel image. ‘Δ’ indicates exon skipping; ‘+’, exon inclusion. Abbreviations: Cr, cryptic 5′ss; WT, wild type; M, mutant. Other abbreviations are the same as in Figure 1B. (B) Enhanced inclusion of exons by HiB in transcripts generated from hybrid minigenes. Labeling is the same as in (A). In addition, activated cryptic 5′ss are marked by arrows. (C) Enhanced inclusion of exons by HiR and HiB in transcripts generated from hybrid minigenes. Labeling is the same as in (A). (D) Enhanced skipping of exons by HiB in transcripts generated from hybrid minigenes. Labeling is the same as in (A). (E) Enhanced inclusion of MBNL1 exon 5 by HiR in transcripts generated from a minigene encompassing the entire genomic sequence of MBNL1 from exons 4 to 6. The entire exon 5 and its flanking intronic sequences for MBNL1 minigene mutants are shown in the upper panel. The splice sites are indicated by arrows. Mutated nucleotides are shown in white on a black background. Gray shaded boxes indicate A/G-rich motifs, mutation of which greatly reduces the ability of risdiplam to stimulate exon 5 inclusion. A representative gel image of MBNL1 minigenes splicing in GM03813 patient fibroblasts is given in the lower panel. Labeling of the gel is the same as in (A).
Figure 8.
Figure 8.
Context-specific role of cis-elements in preferential splice site selection by small molecules. (A) Location and sequence of a randomized region of the FOXM1 exon 9 hybrid minigene. The exon is shown as a box, and the flanking intron as lines. The sequences surrounding the 9S and 9L 5′ss are shown above the exon. The randomized region is shown as a gray box, and the sequences of 20 random clones are given below. Numbering is relative to the start of the exon. (B) Splicing pattern of the wild-type (WT) FOXM1 exon 9 hybrid minigene and 20 random clones. Treatments and clone names are indicated above each gel. Splice isoform identities are indicated at the right side. Densitometric quantification of each isoform relative to total RNA expression is indicated at the bottom. (C) Overview of the in vivo selection process. Binding locations for PCR primers are indicated with arrowheads. Other coloring and labeling is the same as in (A). (D) Splicing pattern of the WT FOXM1 hybrid minigene, pooled unselected clones and the final selected pools. Labeling is the same as in (B). (E) Splicing pattern of single clones from the final selected pool. Labeling is the same as in (B).
Figure 9.
Figure 9.
Exonic mutations affect the ability of risdiplam and branaplam to promote exon 7 inclusion in transcripts generated from SMN2 minigenes. (A) Splicing of transcripts produced from SMN2ΔI6 minigenes carrying exonic mutations in HeLa cells. The sequence of the entire exon 7 for each minigene construct is shown in the upper panel. Minigene names are given on the left. Type of treatment and percentage of minigene exon 7 skipping are indicated on the right. Mutated nucleotides are highlighted in white on a black background. Three regions, Exinct, the Conserved tract and 3′ Cluster, shown to affect splicing of SMN exon 7 are indicated (13). C2 and C5 sites show where risdiplam C2 and C5 analogs interact with SMN exon 7 (45,46). A representative gel image showing the splicing pattern of SMN2 minigenes is given in the lower panel. Treatments and minigene names are indicated at the top of the gel image. Labeling is the same as in Figure 1B. (B) Splicing of SMN2 minigenes carrying single versus double mutations in HeLa cells. Labeling is the same as in (A). (C) Diagrammatic representation of the mechanism of small molecule-induced recruitment of U1 snRNP through GG and AC motifs. The sequence of SMN2 exon 7 and surrounding intronic sequences are given. Numbering is relative to the beginning of exon 7. Splicing factors are shown as shaded circles. Critical nucleotides for activity of risdiplam and branaplam are circled. FUBP1/KHSRP interacts with both the GG-rich motif and the small molecule. FUBP1/KHSRP may directly contact the downstream AC residues or help to recruit another factor that interacts with the downstream AC residues. Upstream RNA–protein and protein–protein interactions induced by the small molecule facilitate recruitment of U1 snRNP at the 5′ss that independently interacts with the small molecule and U1 snRNA.
Figure 10.
Figure 10.
Combined treatment of risdiplam and branaplam. (A) Splicing of SMN2 exon 7 in the presence of low concentrations of risdiplam and/or branaplam. Left panel: representative gel image of RT–PCR after 6 or 24 h of treatment of GM03813 fibroblasts is shown. Treatment times and concentrations are indicated at the top of the gel. Other labeling is the same as Figure 1B. Right panel: bar diagram depicting the inclusion:skipping ratio as determined by densitometric quantitation of the gel in the left panel. Black bars represent 6 h treatment and white bars represent 24 h treatment. (BG) Splicing of POMT2 exon 11B (B), MBNL1 exon 5 (C), SH3YL1 exon 11 (D), ODF2L exon 14 (E), DST exon 92 (F) and ARHGAP12 exon 17 (G) in the presence of low concentrations of risdiplam and branaplam. Labeling is the same as in (A).

Comment in

Similar articles

Cited by

References

    1. Ahmad S., Bhatia K., Kannan A., Gangwani L.. Molecular mechanisms of neurodegeneration in spinal muscular atrophy. J. Exp. Neurosci. 2016; 10:39–49. - PMC - PubMed
    1. Jha N.N., Kim J.K., Monani U.R.. Motor neuron biology and disease: a current perspective on infantile-onset spinal muscular atrophy. Future Neurol. 2018; 13:161–172. - PMC - PubMed
    1. Wirth B., Karakaya M., Kye M.J., Mendoza-Ferreira N.. Twenty-five years of spinal muscular atrophy research: from phenotype to genotype to therapy, and what comes next. Annu. Rev. Genomics Hum. Genet. 2020; 21:231–261. - PubMed
    1. Singh R.N., Howell M.D., Ottesen E.W., Singh N.N.. Diverse role of survival motor neuron protein. Biochim. Biophys. Acta. 2017; 1860:299–315. - PMC - PubMed
    1. Singh N.N., Hoffman S., Reddi P.P., Singh R.N.. Spinal muscular atrophy: broad disease spectrum and sex-specific phenotypes. Biochim. Biophys. Acta. 2021; 1867:166063. - PMC - PubMed

Publication types

MeSH terms