. 2023 May;49(5):105.
doi: 10.3892/or.2023.8542. Epub 2023 Apr 7.

NCoA3 upregulation in breast cancer‑associated adipocytes elicits an inflammatory profile

Affiliations

NCoA3 upregulation in breast cancer‑associated adipocytes elicits an inflammatory profile

María Cecilia Lira et al. Oncol Rep. 2023 May.

Abstract

Nuclear receptor coactivator 3 (NCoA3) is a transcriptional coactivator of NF‑κB and other factors, which is expressed at relatively low levels in normal cells and is amplified or overexpressed in several types of cancer, including breast tumors. NCoA3 levels have been shown to be decreased during adipogenesis; however, its role in tumor‑surrounding adipose tissue (AT) remains unknown. Therefore, the present study assessed the modulation of NCoA3 in breast cancer‑associated adipocytes and evaluated its association with the expression of inflammatory markers. 3T3‑L1 adipocytes were stimulated with conditioned medium from human breast cancer cell lines and the expression levels of NCoA3 were evaluated by reverse transcription‑quantitative (q)PCR. NF‑κB activation was measured by immunofluorescence, and tumor necrosis factor and monocyte chemoattractant protein 1 levels were analyzed by qPCR and dot blot assays. The results obtained from the in vitro model were supported using mammary AT (MAT) from female mice, MAT adjacent to tumors from patients with breast cancer and bioinformatics analysis. The results revealed that adipocytes expressing high levels of NCoA3 were mainly associated with a pro‑inflammatory profile. In 3T3‑L1 adipocytes, NCoA3 downregulation or NF‑κB inhibition reversed the expression of inflammatory molecules. In addition, MAT from patients with a worse prognosis exhibited high levels of this coactivator. Notably, adipocyte NCoA3 levels could be modulated by inflammatory signals from tumors. The modulation of NCoA3 levels in synergy with NF‑κB activity in MAT in a tumor context could be factors required to establish breast cancer‑associated inflammation. As adipocytes are involved in the development and progression of breast cancer, this signaling network deserves to be further investigated to improve future tumor treatments.

Keywords: NF‑κB; breast cancer; inflammation; mammary adipose tissue; nuclear receptor coactivator 3.


Conflict of interest statement

The authors declare that they have no competing interests.

Figures

Figure 1.
Figure 1.
NCoA3 expression in 3T3-L1 adipocytes stimulated with BrCM. p-p65 was detected by immunofluorescence. (A) Representative microphotographs are shown; upper panels, p-p65 staining (red); middle panels, Hoechst staining (blue); lower panels, merged. (B) Plots showing the fluorescence intensity profile of the indicated cells in (A) (white arrows). (C) Maximum fluorescence intensity quantification was performed in ≥10 individual cell profiles in 10 fields for each condition. *P<0.05 vs. basal or MCF10A, one-way ANOVA and Tukey's post hoc test. (D) NCoA3 expression was evaluated in 3T3-L1 adipocytes by RT-qPCR. *P<0.05 vs. basal or MCF10A. (E) NCoA3 and tubulin protein expression levels were assessed by western blotting in extracts from 3T3-L1 adipocytes stimulated with or without BrCM. (F) TNF secretion was studied by dot blot assay. (G) mRNA expression levels of MCP1 were determined by RT-qPCR and normalized to CyA. *P<0.05 vs. MCF10A, one-way ANOVA and Tukey's post hoc test. Data are presented as the mean ± SEM. BrCM, conditioned medium from breast cell lines; CyA, cyclophilin A; MCP1, monocyte chemoattractant protein 1; NCoA3, nuclear receptor coactivator 3; p-p, phosphorylated; RDU, relative densitometry units; RT-qPCR, reverse transcription-quantitative PCR; TNF, tumor necrosis factor.
Figure 2.
Figure 2.
NCoA3 knockdown inhibits the expression of pro-inflammatory markers. (A) Knockdown efficiency of shNCoA3 in 3T3-L1 cells. NCoA3 mRNA expression was determined by RT-qPCR and was normalized to CyA mRNA expression, and NCoA3 protein expression was determined by western blotting. *P<0.05 vs. control, unpaired Student's t-test. RDU corresponds to the densitometry unit with respect to tubulin expression. p-p65 location was studied by immunofluorescence in 3T3-L1 adipocytes stimulated with BrCM from T-47D tumoral cells or with serum-free medium (basal) in the presence or absence of SSZ (0.2 mM). (B) Maximum fluorescence intensity quantification for each condition. *P<0.05, two-way ANOVA and Tukey's post hoc test (C) Representative microphotographs are shown. (D) Plots show the fluorescence intensity profile of the indicated cells in (C) (white arrows). Control or shNCoA3-transfected 3T3-L1 adipocytes were incubated with T-47D BrCM or serum-free medium in the presence or absence of SSZ. (E) TNF secretion was studied by dot blot assay, and membranes were incubated with anti-TNF antibody. (F) mRNA MCP1 expression was determined by RT-qPCR and normalized to CyA mRNA. *P<0.05, two-way ANOVA and Tukey's post hoc test. Data are presented as the mean ± SEM. BrCM, conditioned medium from breast cell lines; CyA, cyclophilin A; MCP1, monocyte chemoattractant protein 1; NCoA3, nuclear receptor coactivator 3; p-p, phosphorylated; RDU, relative densitometry units; RT-qPCR, reverse transcription-quantitative PCR; sh, short hairpin; SSZ, sulfasalazine; TNF, tumor necrosis factor.
Figure 3.
Figure 3.
NCoA3 expression in MAT stimulated with BrCM NCoA3 expression levels were detected in murine MAT cultured with or without BrCM from T-47D or MDA-MB-231 cell lines. (A) NCoA3 mRNA expression was analyzed by RT-qPCR. *P<0.05 vs. basal, one-way ANOVA and Tukey's post hoc test. Immunostaining of NCoA3 protein was performed. (B) Representative microphotographs (magnification, ×400) are shown, lower panels are amplifications of the black boxes in the upper panels. (C) Semi-quantification of positive NCoA3 staining area. Immunostaining of p-p65 protein was performed in murine MAT cultured with or without BrCM from T-47D or MDA-MB-231 cell lines. *P<0.05 vs. basal, one-way ANOVA and Tukey's post hoc test. (D) Representative microphotographs (magnification, ×400) are shown, lower panels are amplifications of the black boxes in the upper panels. (E) Semi-quantification of positive p-p65 staining area. *P<0.05 vs. basal, one-way ANOVA and Tukey's post hoc test. (F) TNF secretion was studied by dot blot assay in CM from murine MAT after being incubated with BrCM for 24 h followed by incubation in serum-free medium for another 24 h. *P<0.05 vs. basal, one-way ANOVA and Tukey's post hoc test. (G) MCP1 expression was analyzed by RT-qPCR in murine explants cultured in the presence or absence of BrCM. *P<0.05 vs. basal, one-way ANOVA and Tukey's post hoc test. Data are presented as the mean ± SEM. BrCM, conditioned medium from breast cell lines; CyA, cyclophilin A; MAT, mammary adipose tissue; MCP1, monocyte chemoattractant protein 1; NCoA3, nuclear receptor coactivator 3; p-p, phosphorylated; RDU, relative densitometry units; RT-qPCR, reverse transcription-quantitative PCR; TNF, tumor necrosis factor.
Figure 4.
Figure 4.
Association between NCoA3 levels and NF-κB activation in MAT from the tumor microenvironment: (A) NCoA3 mRNA expression levels were measured by reverse transcription-quantitative PCR in MAT from patients with non-tumoral or tumoral lesions. Horizontal lines indicate the median of NCoA3 expression and each dot corresponds to one patient. P<0.005, Welch's test. The red dotted line corresponds to the average of NCoA3 levels obtained in MAT from a non-tumoral context. Immunostaining of NCoA3 protein was performed in AT adjacent to mammary glands with non-tumoral lesions or breast cancer. (B) Representative microphotographs (magnification, ×400) are shown, lower panels are amplifications of the black boxes in the upper panels. (C) Graph corresponds to positive NCoA3 staining area. Data are presented as the mean ± SEM. *P<0.05 vs. NCoA3low in tumoral context and non-tumoral context, one-way ANOVA and Tukey's post hoc test. Bar graphs show the distribution of patients (expressed as a percentage) with high or low NCoA3 expression in the AT adjacent to their breast tumors classified by (D) molecular status (TN and luminal: Estrogen receptor-positive and/or progesterone receptor-positive) and (E) breast cancer stage. P<0.05, Mantel-Haenszel's test. p-p65 was detected by immunohistochemistry in MAT adjacent to breast tumors or non-tumoral lesions. (F) Representative microphotographs are shown; lower panels are amplifications of the black boxes in the upper panels. (G) Graph shows positive p-p65 staining area. Data are presented as the mean ± SEM. *P<0.05 vs. non-tumoral context, one-way ANOVA and Tukey's post hoc test. (H) TNF and (I) MCP1 secretion was determined by dot blot assay in the CM from MAT explants obtained from patients with breast cancer. Data are presented as the mean ± SEM. *P<0.05 vs. low NCoA3 expression, unpaired Student's t-test. (J) Analysis of CLS in hematoxylin-stained MAT from patients with breast cancer expressing low or high NCoA3, bars indicate the percentage of fields containing at least one CLS per patient sample. Data are presented as the mean ± SEM. *P<0.05 vs. low NCoA3 expression, unpaired Student's t-test. (K) Representative microphotographs are shown, asterisks indicate CLS. CLS, crown-like structures; H&E, hematoxylin and eosin; MAT, mammary adipose tissue; MCP1, monocyte chemoattractant protein 1; NCoA3, nuclear receptor coactivator 3; p-p, phosphorylated; RDU, relative densitometry units; TN, triple negative; TNF, tumor necrosis factor.
Figure 5.
Figure 5.
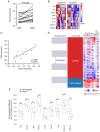
Association between NCoA3 expression and adipokines in MAT surrounding breast cancer. mRNA expression data in adMAT (0.5-1 cm from tumors) and dMAT (>5 cm from tumors) were retrieved from the E-MTAB-8638 dataset. (A) NCoA3 mRNA expression levels in dMAT and adMAT from patients with breast cancer. Each value obtained in each adMAT sample was paired with the corresponding value in dMAT sample from the same patient. P=0.0342 (n=16, paired Student's t-test). (B) Heatmap illustrates the differences in expression of each pro-inflammatory biomarker in adMAT regarding NCoA3 expression levels, each column represents one patient (n=18). (C) Scatter plot shows the correlation between CD68 expression levels and NCoA3 expression levels in adMAT (n=16, Pearson r=0.8385; P<0.001). Bioinformatics analysis was performed using the Xena platform. (D) Human breast cancer primary tumor samples (The Cancer Genome Atlas Breast Cancer) were classified according to molecular features and their cytokine profile was analyzed. Samples undetermined for the selected variable were excluded (394 valid datapoints). Red represents upregulated expression whereas blue corresponds to downregulated expression. (E) Box plot of cytokine expression (IL6, CCL2, TNF, CCL5, IL1A, IL1B, IL8, CXCL10 and CXCL1) in triple-negative and luminal breast tumor samples. *P<0.00005, Welch's test. adMAT, MAT adjacent to human breast tumors; dMAT, distant MAT; MAT, mammary adipose tissue; NCoA3, nuclear receptor coactivator 3.
Figure 6.
Figure 6.
Role of NCoA3 in breast tumor-surrounding adipose tissue. Tumors secrete factors that trigger the upregulation of NCoA3 expression and NF-κB activation in adjacent adipocytes. The modulation of these molecules induce pro-inflammatory cytokines and chemokines that promote cancer-associated inflammation. This original figure was created using BioRender.com. MCP1, monocyte chemoattractant protein 1; NCoA3, nuclear receptor coactivator 3; TNF, tumor necrosis factor.

Similar articles

Cited by

References

    1. Hajer GR, van Haeften TW, Visseren FL. Adipose tissue dysfunction in obesity, diabetes, and vascular diseases. Eur Heart J. 2008;29:2959–2971. doi: 10.1093/eurheartj/ehn387. - DOI - PubMed
    1. Nieman KM, Romero IL, Van Houten B, Lengyel E. Adipose tissue and adipocytes support tumorigenesis and metastasis. Biochim Biophys Acta. 2013;1831:1533–1541. doi: 10.1016/j.bbalip.2013.02.010. - DOI - PMC - PubMed
    1. Bochet L, Meulle A, Imbert S, Salles B, Valet P, Muller C. Cancer-associated adipocytes promotes breast tumor radioresistance. Biochem Biophys Res Commun. 2011;411:102–106. doi: 10.1016/j.bbrc.2011.06.101. - DOI - PubMed
    1. Hanahan D, Weinberg RA. Hallmarks of cancer: The next generation. Cell. 2011;144:646–674. doi: 10.1016/j.cell.2011.02.013. - DOI - PubMed
    1. Berstein LM, Kovalevskij AY, Poroshina TE, Kotov AV, Kovalenko IG, Tsyrlina EV, Leenman EE, Revskoy SY, Semiglazov VF, Pozharisski KM. Signs of proinflammatory/genotoxic switch (adipogenotoxicosis) in mammary fat of breast cancer patients: Role of menopausal status, estrogens and hyperglycemia. Int J Cancer. 2007;121:514–519. doi: 10.1002/ijc.22552. - DOI - PubMed