. 2023 Aug;114(8):3230-3246.
doi: 10.1111/cas.15812. Epub 2023 Apr 20.

Establishment and characterization of a novel cancer stem-like cell of cholangiocarcinoma

Affiliations

Establishment and characterization of a novel cancer stem-like cell of cholangiocarcinoma

Orasa Panawan et al. Cancer Sci. 2023 Aug.

Abstract

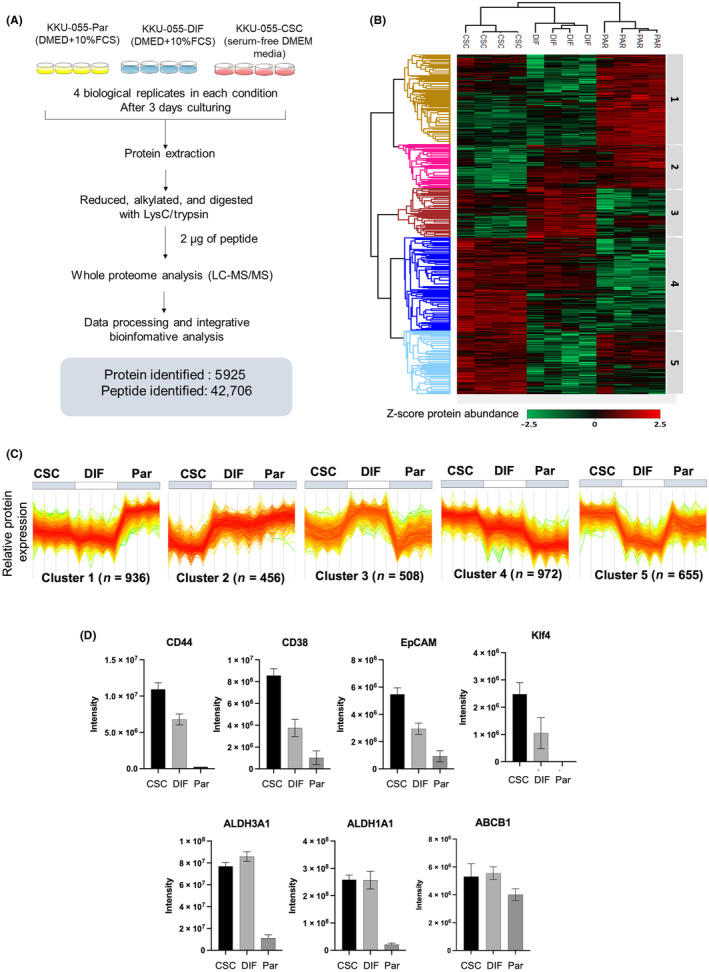
Cholangiocarcinoma (CCA) is an aggressive malignant tumor of bile duct epithelia. Recent evidence suggests the impact of cancer stem cells (CSC) on the therapeutic resistance of CCA; however, the knowledge of CSC in CCA is limited due to the lack of a CSC model. In this study, we successfully established a stable sphere-forming CCA stem-like cell, KKU-055-CSC, from the original CCA cell line, KKU-055. The KKU-055-CSC exhibits CSC characteristics, including: (1) the ability to grow stably and withstand continuous passage for a long period of culture in the stem cell medium, (2) high expression of stem cell markers, (3) low responsiveness to standard chemotherapy drugs, (4) multilineage differentiation, and (5) faster and constant expansive tumor formation in xenograft mouse models. To identify the CCA-CSC-associated pathway, we have undertaken a global proteomics and functional cluster/network analysis. Proteomics identified the 5925 proteins in total, and the significantly upregulated proteins in CSC compared with FCS-induced differentiated CSC and its parental cells were extracted. Network analysis revealed that high mobility group A1 (HMGA1) and Aurora A signaling through the signal transducer and activator of transcription 3 pathways were enriched in KKU-055-CSC. Knockdown of HMGA1 in KKU-055-CSC suppressed the expression of stem cell markers, induced the differentiation followed by cell proliferation, and enhanced sensitivity to chemotherapy drugs including Aurora A inhibitors. In silico analysis indicated that the expression of HMGA1 was correlated with Aurora A expressions and poor survival of CCA patients. In conclusion, we have established a unique CCA stem-like cell model and identified the HMGA1-Aurora A signaling as an important pathway for CSC-CCA.

Keywords: HMGA1; bile duct; cancer stem cell; cholangiocarcinoma; liver.


Conflict of interest statement

Yoshihiro Komohara is currently an Editorial Board Member of Cancer Science. The other authors have no conflict of interest. All authors had full access to all of the data in the study and had final responsibility for the decision to submit for publication.

Figures

FIGURE 1
FIGURE 1
Morphology and stem cell marker expression. (A) Phase contrast of parental KKU‐055 cells (KKU‐055‐Par) and KKU‐055 sphere cells (KKU‐055‐SC; 50th passage). Scale bar, 50 μm. (B) Expression of SOX2, CD44, CD147, and epithelial cell adhesion molecule (EpCAM) was determined by western blot analysis. (C) Immunocytofluorescence was used to assess the expression of SOX2, EpCAM, CD44, and CD44v9. DAPI was used for nuclear staining. (D) Real‐time RT‐PCR was used to quantify the mRNA expression of Sox2, Oct 3/4, C‐myc, OLG‐2, CD44, and EpCAM. β‐Actin was used as an internal control for normalization. *p < 0.05, **p < 0.01.
FIGURE 2
FIGURE 2
Phenotypic characteristics of KKU‐055 sphere cells (KKU‐055‐SC) and parental KKU‐055 cells (KKU‐055‐Par). (A) Proliferation of KKU‐055‐SC was compared with parental KKU‐055 cells using CCK‐8. (B) Dose–response curves represented cell viability 72 h after treatment with cisplatin, 5‐fluorouracil (5‐FU), and gemcitabine. *p < 0.05, **p < 0.01. (C) Morphology of KKU‐055‐SC in (i) stem cell medium. Multi‐lineage differentiation ability was determined by (ii) 10% FCS‐induced differentiation for 72 h, (iii) Oil Red O staining of fat droplets (red) after adipocyte differentiation, and (iv) Alizarin Red S staining of calcium granule (red) after osteocyte differentiation. Scale bar, 50 μm.
FIGURE 3
FIGURE 3
Tumor‐initiating ability of KKU‐055 sphere cells (KKU‐055‐SCs) in a mouse model. (A) Schematic diagram represents the workflow of tumor transplantation in the mouse model. (B, C) Tumors were presented in experimental animals and were harvested on day 31 and day 46. (D) Tumor size was measured daily, and (E) weight was measured after harvesting. (F) Harvested tumors were immunohistochemically stained by a proliferative index, Ki‐67, and a stem marker, epithelial cell adhesion molecule (EpCAM). The signal was developed by diaminobenzidine (brown). Scale bar, 50 μm. *p < 0.05, **p < 0.01. KKU‐055‐Par, parental KKU‐055.
FIGURE 4
FIGURE 4
Karyotype analysis. Chromosome analysis of (A) parental KKU‐055 cells (KKU‐055‐Par) and (B) cholangiocarcinoma stem‐like cells (KKU‐055‐CSC) was carried out by G‐band karyotyping. The chromosome images are representative of 20 examined mitotic cells. There was an equal modal chromosome number of 54 (53–56 chromosomes of KKU‐055‐Par cells and 52–55 chromosomes of KKU‐055‐CSCs). Several chromosome markers (M, mar) were similar in both, such as for parental KKU‐055: 53+XX; +1, +3, +6, +7, +8, +10, +12, −13, −17, +21, +mar and for KKU‐055‐CSC: 53+XX; +1, +3, +4, +7, +8, +10, +12, −13, −17, +21, +mar.
FIGURE 5
FIGURE 5
Proteomics of cholangiocarcinoma stem‐like cells (KKU‐055‐CSC), the 10% FCS‐induced differentiation form (KKU‐055‐DIF), and parental KKU‐055 (KKU‐055‐Par) cells. (A) Schematic diagram representing the proteomics workflow. (B) Cluster analysis of the quantitatively identified proteins. (C) k‐mean clustering (D) The target stem cell markers' expression level, represented by mass intensity, was extracted from cluster 4 of the identified proteins. ABC, ATP binding cassette; ALDH, aldehyde dehydrogenase; EpCAM, epithelial cell adhesion molecule; LC‐MS/MS, liquid chromatography–tandem mass spectrometry.
FIGURE 6
FIGURE 6
Differentially expressed proteins among cholangiocarcinoma stem‐like cells (CSC), the 10% FCS‐induced differentiation form (DIF), and parental (Par) KKU‐055 cells. (A) Volcano plots represent differentially expressed proteins. Red dots represent proteins significantly upregulated in CSC. Blue dots represent proteins significantly upregulated in KKU‐055‐DIF and parental KKU‐055 cells. (B) Venn diagram of proteins upregulated or downregulated in CSC, compared with DIF and Par cells. Numbers represent the number of proteins.
FIGURE 7
FIGURE 7
Network analysis of proteins upregulated in cholangiocarcinoma stem‐like cells (CSC). (A) Network analysis was undertaken in KeyMolnet software using 1123 proteins upregulated in KKU‐055‐CSC were used as the input for analysis. (B) The enriched signaling pathway is based on high mobility group A1 (HMGA1) and Aurora A. The protein interactions were defined as follows: a solid line with the arrow (direct binding or activation), a solid line with the arrow and stop (direct inactivation), a solid line without the arrow (complex formation), a dashed line with the arrow (transcriptional activation), and a dashed line with arrow and stop (transcriptional repression). ICC, immunocytochemistry; MS/MS, tandem mass spectrometry.
FIGURE 8
FIGURE 8
Functional analysis of high mobility group A1 (HMGA1) in cholangiocarcinoma cancer stem cells (CSC). (A) Western blotting and immunocytofluorescence were used to determine the high mobility group A1 (HMGA1) expression (green). The nucleus (blue) was stained by DAPI. Scale bar, 20 μm. (B) KKU‐055‐CSC was treated with 50 pmole of siHMGA1 and compared to siControl. Immunofluorescence measured expressions of HMGA1, SOX2, and CD44. Scale bar, 50 μm. (C) Proliferation assay by CCK‐8 and (D) drug sensitivity against 5‐fluorouracil (5‐FU), cisplatin, and gemcitabine. (E) Western blotting and immunocytofluorescence of Aurora A (green). Scale bar, 20 μm. (F, G) Cell viability was measured by CCK‐8 after combined treatment with siHGMA1 and drugs. *p < 0.05, **p < 0.01. DIF, 10% FCS‐induced differentiation form; EpCAM, epithelial cell adhesion molecule; Par, parental KKU‐055.
FIGURE 9
FIGURE 9
Expression of HMGA1 in human cholangiocarcinoma (CCA) tissues. (A) HMGA1 mRNA expression in CCA tissues (red bar) compared with normal (gray bar) was analyzed using The Cancer Genome Atlas dataset in GEPIA. *p < 0.05. (B) Survival analysis was undertaken using the Kaplan–Meier plot and log‐rank test. TPM, transcripts per million.

References

    1. Sripa B, Pairojkul C. Cholangiocarcinoma: lessons from Thailand. Curr Opin Gastroenterol. 2008;24:349‐356. - PMC - PubMed
    1. Lee KJ, Yi SW, Cha J, et al. A pilot study of concurrent chemoradiotherapy with gemcitabine and cisplatin in patients with locally advanced biliary tract cancer. Cancer Chemother Pharmacol. 2016;78:841‐846. - PubMed
    1. Sripa B, Seubwai W, Vaeteewoottacharn K, et al. Functional and genetic characterization of three cell lines derived from a single tumor of an Opisthorchis viverrini‐associated cholangiocarcinoma patient. Hum Cell. 2020;33:695‐708. - PubMed
    1. Kawamoto M, Umebayashi M, Tanaka H, et al. Combined gemcitabine and metronidazole is a promising therapeutic strategy for cancer stem‐like cholangiocarcinoma. Anticancer Res. 2018;38:2739‐2748. - PubMed
    1. Luvira V, Eurboonyanun C, Bhudhisawasdi V, et al. Patterns of recurrence after resection of mass‐forming type intrahepatic Cholangiocarcinomas. Asian Pac J Cancer Prev. 2016;17:4735‐4739. - PMC - PubMed