. 2023 Jun;108(6):891-911.
doi: 10.1113/EP091134. Epub 2023 Apr 7.

Skeletal muscle adaptation to indirect electrical stimulation: divergence between microvascular and metabolic adaptations

Affiliations

Skeletal muscle adaptation to indirect electrical stimulation: divergence between microvascular and metabolic adaptations

Roger W P Kissane et al. Exp Physiol. 2023 Jun.

Abstract

New findings: What is the central question of this study? Can we manipulate muscle recruitment to differentially enhance skeletal muscle fatigue resistance? What is the main finding and its importance? Through manipulation of muscle activation patterns, it is possible to promote distinct microvascular growth. Enhancement of fatigue resistance is closely associated with the distribution of the capillaries within the muscle, not necessarily with quantity. Additionally, at the acute stages of remodelling in response to indirect electrical stimulation, the improvement in fatigue resistance appears to be primarily driven by vascular remodelling, with metabolic adaptation of secondary importance.

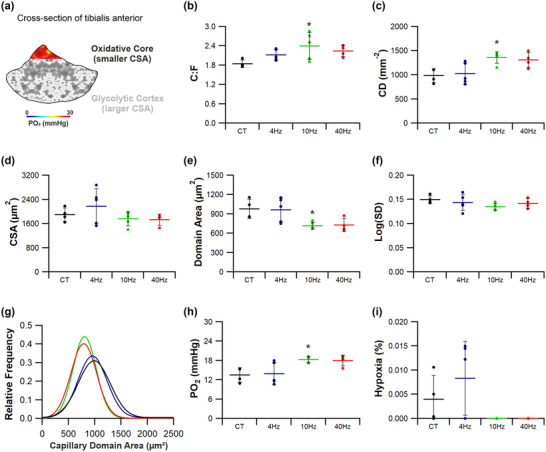
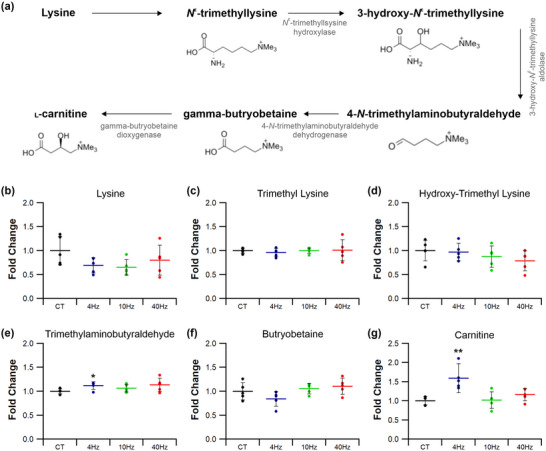
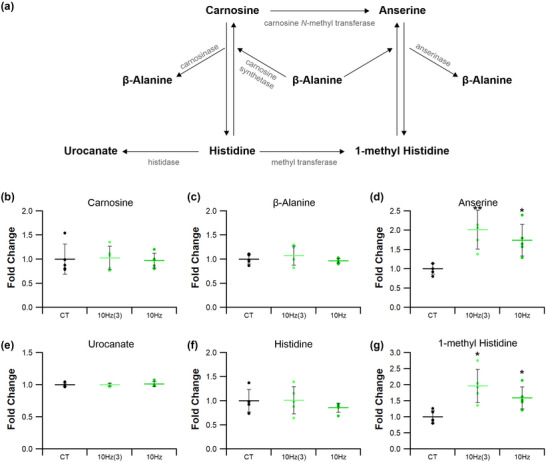
Abstract: Exercise involves a complex interaction of factors influencing muscle performance, where variations in recruitment pattern (e.g., endurance vs. resistance training) may differentially modulate the local tissue environment (i.e., oxygenation, blood flow, fuel utilization). These exercise stimuli are potent drivers of vascular and metabolic change. However, their relative contribution to adaptive remodelling of skeletal muscle and subsequent performance is unclear. Using implantable devices, indirect electrical stimulation (ES) of locomotor muscles of rat at different pacing frequencies (4, 10 and 40 Hz) was used to differentially recruit hindlimb blood flow and modulate fuel utilization. After 7 days, ES promoted significant remodelling of microvascular composition, increasing capillary density in the cortex of the tibialis anterior by 73%, 110% and 55% for the 4 Hz, 10 and 40 Hz groups, respectively. Additionally, there was remodelling of the whole muscle metabolome, including significantly elevated amino acid turnover, with muscle kynurenic acid levels doubled by pacing at 10 Hz (P < 0.05). Interestingly, the fatigue index of skeletal muscle was only significantly elevated in 10 Hz (58% increase) and 40 Hz (73% increase) ES groups, apparently linked to improved capillary distribution. These data demonstrate that manipulation of muscle recruitment pattern may be used to differentially expand the capillary network prior to altering the metabolome, emphasising the importance of local capillary supply in promoting exercise tolerance.

Keywords: angiogenesis; exercise; metabolomics; muscle stimulation.


Conflict of interest statement

The authors declare no conflict of interests.

Figures

FIGURE 1
FIGURE 1
Experimental design and methods.
FIGURE 2
FIGURE 2
Blow flow and force kinetics of the extensor digitorum longus to indirect electrical stimulation. Indirect electrical stimulation was delivered at 4 Hz (a), 10 Hz (b), and 40 Hz (c) for 3 min (grey shaded region) to the extensor digitorum longus of male Wistar rats (n = 4). Functional hyperaemia is evident through changes in relative conductance (coloured lines) within the shaded stimulation period. Progressive increase in conductance reaches a peak around 3 min with 4 Hz, is reached earlier with increased activity at 10 Hz, but is delayed until after stimulation at 40 Hz due to attenuation of arterial stenosis as muscle fatigue develops. Conductance returns towards baseline values in the successive white region post‐stimulation, with a likely contribution from reactive hyperaemia delaying this at 40 Hz.
FIGURE 3
FIGURE 3
Microvascular distribution throughout the tibialis anterior. Example histological images from the oxidative core and glycolytic cortex labelled with Griffonia simplicifolia lectin‐1. Corresponding capillary domain area derived from the histological images highlight the difference in supply area between the core and cortex. Finally, the consequence of capillary domain area on estimates of tissue partial pressure of oxygen (PO2).
FIGURE 4
FIGURE 4
Whole tibialis anterior response to indirect electrical stimulation. (a) The tibialis anterior is a heterogeneous muscle comprising a deep oxidative core and a superficial glycolytic cortex. Immunohistochemical staining of Type I fibres (magenta), Type IIa (yellow), Type IIb/x (unstained) and laminin (white). (b,c) ES significantly enhanced capillary‐to‐fibre ratio (b) with 10 and 40 Hz significantly increasing capillary density (c). (d) There was no significant effect of ES on fibre cross‐sectional‐area. (e,f) ES significantly reduced the capillary domain area (e), with 4 and 40 Hz significantly reducing capillary heterogeneity (f). (g,h) Consequently, modelled tissue PO2 (g) was significantly improved across all three stimulation frequencies, as was the modelled extent of relative tissue hypoxia (h). Data derived from 5 regions of interest across the whole TA. Means ± SD, *P < 0.05 vs. control tissue (CT). (b–h) CT (n = 4), 4 Hz (n = 5), 10 Hz (n = 5) and 40 Hz (n = 4).
FIGURE 5
FIGURE 5
Angiogenic response in the tibialis anterior core to indirect electrical stimulation. (a) The posterior/medial compartment of TA is highly oxidative in phenotype. (b,c) Only 10 Hz ES significantly elevated capillary‐to‐fibre ratio (b) and capillary density (c). (d) Muscle fibre cross‐sectional‐area was unchanged across all stimulation groups. (e–g) Capillary domain area (e) appeared to respond greatest to the higher frequency stimulation, while there was no change in capillary heterogeneity (f) despite a leftward shift in capillary domain distribution (g) for the 10 and 40 Hz ES groups. (h,i) Finally, only 10 Hz stimulation significantly elevated modelled tissue PO2 (h), while there were no significant changes to the estimates of tissue hypoxia (i). Means ± SD, *P < 0.05. Control tissue (CT) (n = 4), 4 Hz (n = 5), 10 Hz (n = 5) and 40 Hz (n = 4).
FIGURE 6
FIGURE 6
Angiogenic response in the tibialis anterior cortex to indirect electrical stimulation. (a) The anterior/lateral compartment of the tibialis anterior is highly glycolytic in phenotype. (b–d) All three stimulation frequencies significantly enhanced microvascular composition in the TA cortex, with changes in capillary‐to‐fibre ratio (b) and capillary density (c) unrelated to changes in fibre cross‐sectional‐area (d). (e,f) Capillary domain area (e) was significantly decreased across all three ES paradigms, with capillary heterogeneity (f) only significantly reduced in the 4 Hz group. (g) This enhancement in microvascular supply led to a leftward shift in capillary domain distribution across all three groups. (h,i) Subsequently modelled tissue PO2 (h) was significantly enhanced across all three groups, with a significant decrease in modelled tissue hypoxia (i). Means ± SD, *P < 0.05. Control tissue (CT) (n = 4), 4 Hz (n = 5), 10 Hz (n = 5) and 40 Hz (n = 4).
FIGURE 7
FIGURE 7
Differential response of the tibialis anterior. (a) Data presented as tibialis core relative to the cortex to highlight the overall shift in phenotype of the muscle. (b,c) 4 Hz stimulation significantly altered the relative capillary‐to‐fibre ratio (b) and capillary density (c) of the TA, with the cortex becoming more similar in morphology to that of the core. (d) All three stimulation regimes had no significant effect on muscle fibre cross‐sectional‐area. (e)The significant shift in capillary density seen with 4 and 10 Hz is echoed by the significant increase in normalized capillary domain area. (f) There was, however, no significant change in normalized capillary heterogeneity. (g) The significant decrease in normalized modelled tissue PO2 suggests a more pronounced improvement in modelled cortex PO2 confirmed in Figure 2. (h,i) There was a significant enhancement in extensor digitorum longus fatigue resistance (h) following 10 and 40 Hz ES, which is independent of changes in hindlimb blood flow (i). Means ± SD, *P < 0.05. (a–g) Control tissue (CT) (n = 4), 4 Hz (n = 5), 10 Hz (n = 5) and 40 Hz (n = 4); (h,i) CT (n = 5), 4 Hz (n = 5), 10 Hz (n = 6), and 40 Hz (n = 5).
FIGURE 8
FIGURE 8
Multivariate analysis for all ion features detected by mass spectrometry. (a–h) Principal component analysis (a–d) and partial least squares‐discriminant analysis (e–h) for ion features detected by different methods; ion exchange (a, e), C18‐reverse phase (b,f), derivatized‐C18 (c,g) and hydrophobic interaction liquid chromatography (HILIC) (d,h). Data represent direct comparison if experimental data with modelled data (Q 2 and R 2) and permutation analysis to quantify the integrity of the data. Elliptical areas represent 95% confidence intervals. (i–k) Metabolite enrichment analysis (i) and pathway impact analysis (j) and for all identified compounds, with heatmap showing relative intensity of all significantly different identified compounds (k). Dashed pink line presents cut‐off for P = 0.05.
FIGURE 9
FIGURE 9
Metabolomics heatmap. Heatmap to show the effect of pacing strategies on statistically significant metabolites following single factor ANOVA (FDR threshold <20%; statistical significance P < 0.05). n = 5 samples/group.
FIGURE 10
FIGURE 10
Effects of electrical pacing on metabolites present in the synthesis of carnitine in tibialis anterior muscle. (a) Identified compounds present in the metabolic pathway associated with carnitine synthesis. (b–f) ES, independent of stimulation frequency, did not significantly alter lysine (b), trimethyllysine (c), hydroxy‐trimethyllysine (d), trimethylaminobutyraldehyde (e) or butryobetaine (f) levels. (g) However, 4 Hz stimulation did significantly enhance muscle carnitine. Statistical significance represented as: *P < 0.05, **P < 0.01 vs. control tissue (CT) (n = 5 per group).
FIGURE 11
FIGURE 11
Temporal response of 10 Hz pacing on metabolites present in the synthesis of carnitine in tibialis anterior muscle. (a) Identified compounds present in the metabolic pathway associated with carnitine synthesis. (b) Lysine was reduced after just 3 days of ES but no longer significant after 7 days of ES. (c–g) Neither 3 nor 7 days of 10 Hz stimulation influenced trimethyllysine (c), hydroxy‐trimethyllysine (d), trimethylaminobutyraldehyde (e), butryobetaine (f) or carnitine (g) levels. Statistical significance represented as: *P < 0.05 vs. control tissue (CT) (n = 5 per group).
FIGURE 12
FIGURE 12
Effects of electrical pacing on metabolites present in the metabolism of histidine and 1‐methyl histidine in tibialis anterior muscle. (a) Identified compounds present in the metabolic pathway associated with the metabolism of histidine. (b–d) There were no significant changes in carnosine (b) in response to ES; however, there was an enhancement in β‐alanine (c) and anserine (d). (e–g) Urocanate (e) and histidine (f) levels were unaffected by 7 days of ES, while 1‐methyl histidine (g) was significantly elevated in response to ES. Statistical significance represented as: *P < 0.05, **P < 0.01, ***P < 0.001 vs. control tissue (CT) (n = 5 per group).
FIGURE 13
FIGURE 13
Temporal response of 10 Hz pacing on histidine and 1‐methyl histidine metabolites in tibialis anterior muscle. (a) Identified compounds present in the metabolic pathway associated with histidine. (b–d) 10 Hz stimulation for 3 or 7 days had no significant effect on carnosine (b) or β‐alanine (c) levels. (d) Anserine was significantly elevated after just 3 days of ES and was still significantly elevated after 7 days. (e–g) Urocanate (e) and histidine (f) remained unchanged after 10 Hz at both time points, while 1‐methyl histidine (g) was significantly elevated after just 3 days of stimulation, maintaining significance after 7 days. Statistical significance represented as: *P < 0.05 vs. control tissue (CT) (n = 5 per group).
FIGURE 14
FIGURE 14
Effects of electrical pacing on metabolites present in the metabolism of kynurenine and kynurenic acid in tibialis anterior muscle. (a) Identified compounds present in the metabolic pathway associated with the metabolism of kynurenine. (b–e) Malate (b), kynurenine (c) and 2‐oxoglutarate (d) were unaffected by 7 days of ES, while oxaloacetate (e) was significantly decreased in response to 4, 10 and 40 Hz stimulation. (f–h) 10 Hz ES significantly elevated kynurenic acid (f) and glutamate (g) levels, with aspartate (h) remaining unchanged across all ES groups. Statistical significance represented as: *P < 0.05, **P < 0.01 vs. control tissue (CT) (n = 5 per group).
FIGURE 15
FIGURE 15
Temporal response of 10 Hz pacing on kynurenine and kynurenic acid metabolites in tibialis anterior muscle. (a) Identified compounds present in the metabolic pathway associated with kynurenine. (b) Malate levels were significantly elevated after just 3 days of ES, which was reduced after 7 days. (c,d) Kynurenine (c) and 2‐oxoglutarate (d) remained unchanged by 10 Hz stimulation across both time points. (e) Oxaloacetate decreased with just 3 days stimulation, becoming significantly reduced at 7 days. (f) 10 Hz ES significantly enhanced kynurenic acid levels after just 3 days and maintaining significance at 7 days. (g) Glutamate was unchanged after just 3 days becoming significantly elevated after 7. (h) Finally, aspartate was significantly reduced after 3 days of ES, recovering to control levels after 7 days. Statistical significance represented as: *P < 0.05, **P < 0.01 vs. control tissue (CT) (n = 5 per group).

Similar articles

Cited by

References

    1. Agudelo, L. Z. , Ferreira, D. M. , Dadvar, S. , Cervenka, I. , Ketscher, L. , Izadi, M. , Zhengye, L. , Furrer, R. , Handschin, C. , & Venckunas, T. (2019). Skeletal muscle PGC‐1α1 reroutes kynurenine metabolism to increase energy efficiency and fatigue‐resistance. Nature Communications, 10(1), 1–12. - PMC - PubMed
    1. Allison, D. J. , Nederveen, J. P. , Snijders, T. , Bell, K. E. , Kumbhare, D. , Phillips, S. M. , Parise, G. , & Heisz, J. J. (2019). Exercise training impacts skeletal muscle gene expression related to the kynurenine pathway. American Journal of Physiology. Cell Physiology, 316(3), C444–C448. - PMC - PubMed
    1. Al‐Shammari, A. A. , Gaffney, E. A. , & Egginton, S. (2014). Modelling capillary oxygen supply capacity in mixed muscles: Capillary domains revisited. Journal of Theoretical Biology, 356, 47–61. - PubMed
    1. Al‐Shammari, A. A. , Kissane, R. W. P. , Holbek, S. , Mackey, A. L. , Andersen, T. R. , Gaffney, E. A. , Kjaer, M. , & Egginton, S. (2019). Integrated method for quantitative morphometry and oxygen transport modeling in striated muscle. Journal of Applied Physiology, 126(3), 544–557. - PubMed
    1. Annex, B. H. , Torgan, C. E. , Lin, P. , Taylor, D. A. , Thompson, M. A. , Peters, K. G. , & Kraus, W. E. (1998). Induction and maintenance of increased VEGF protein by chronic motor nerve stimulation in skeletal muscle. American Journal of Physiology. Heart and Circulatory Physiology, 274(3), H860–H867. - PubMed

Publication types