. 2023 Apr 25;42(4):112335.
doi: 10.1016/j.celrep.2023.112335. Epub 2023 Apr 6.

Neurons require glucose uptake and glycolysis in vivo

Affiliations

Neurons require glucose uptake and glycolysis in vivo

Huihui Li et al. Cell Rep. .

Abstract

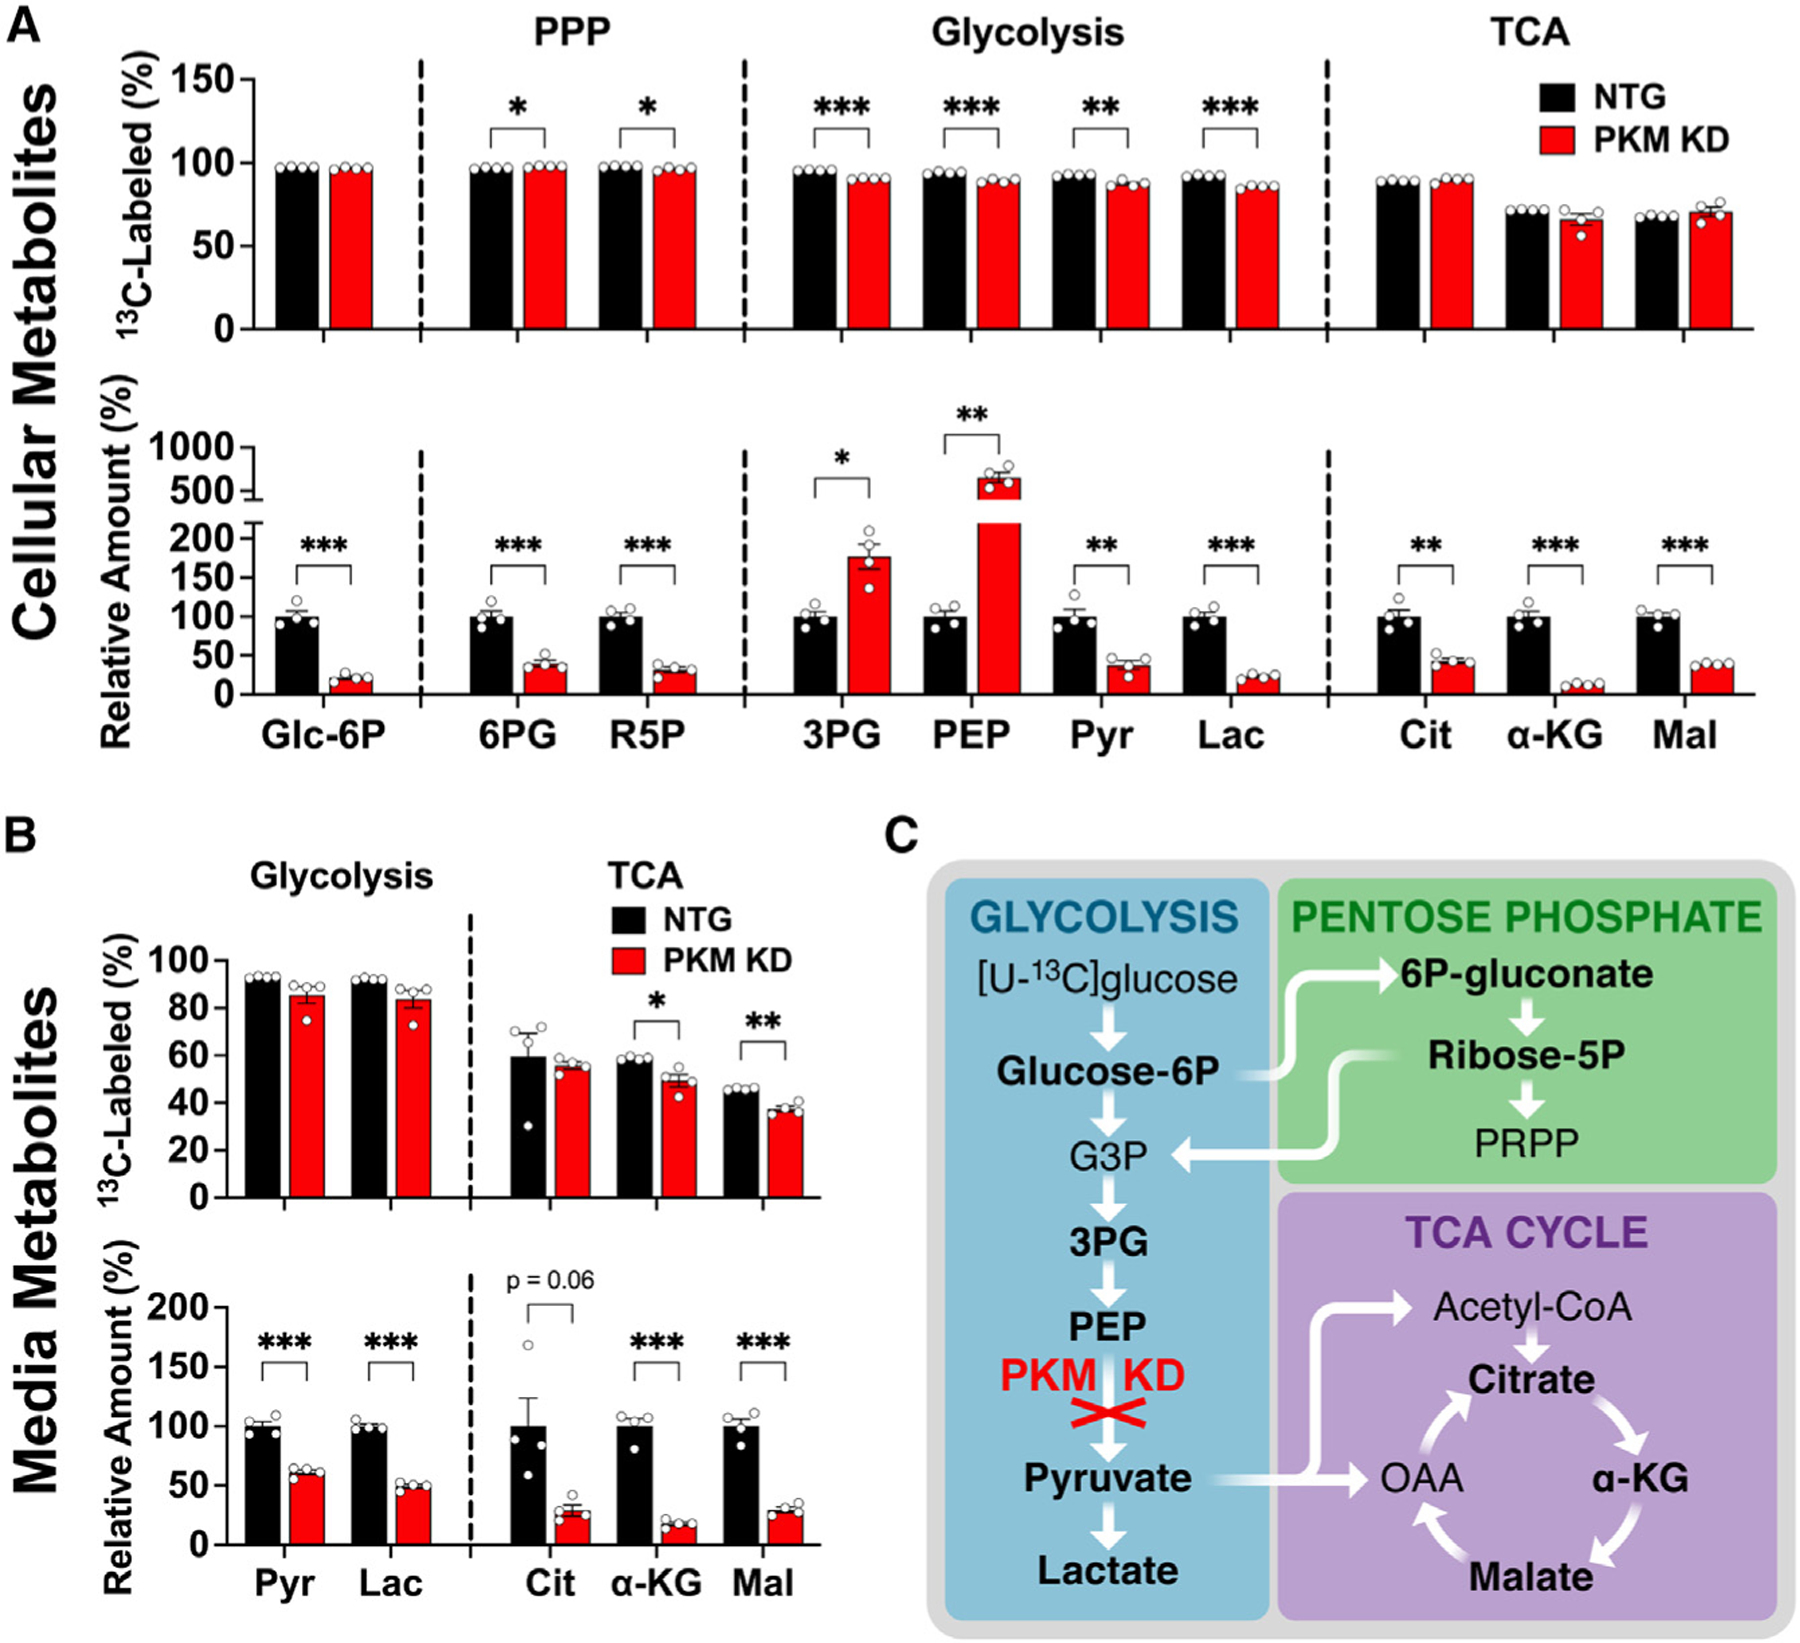
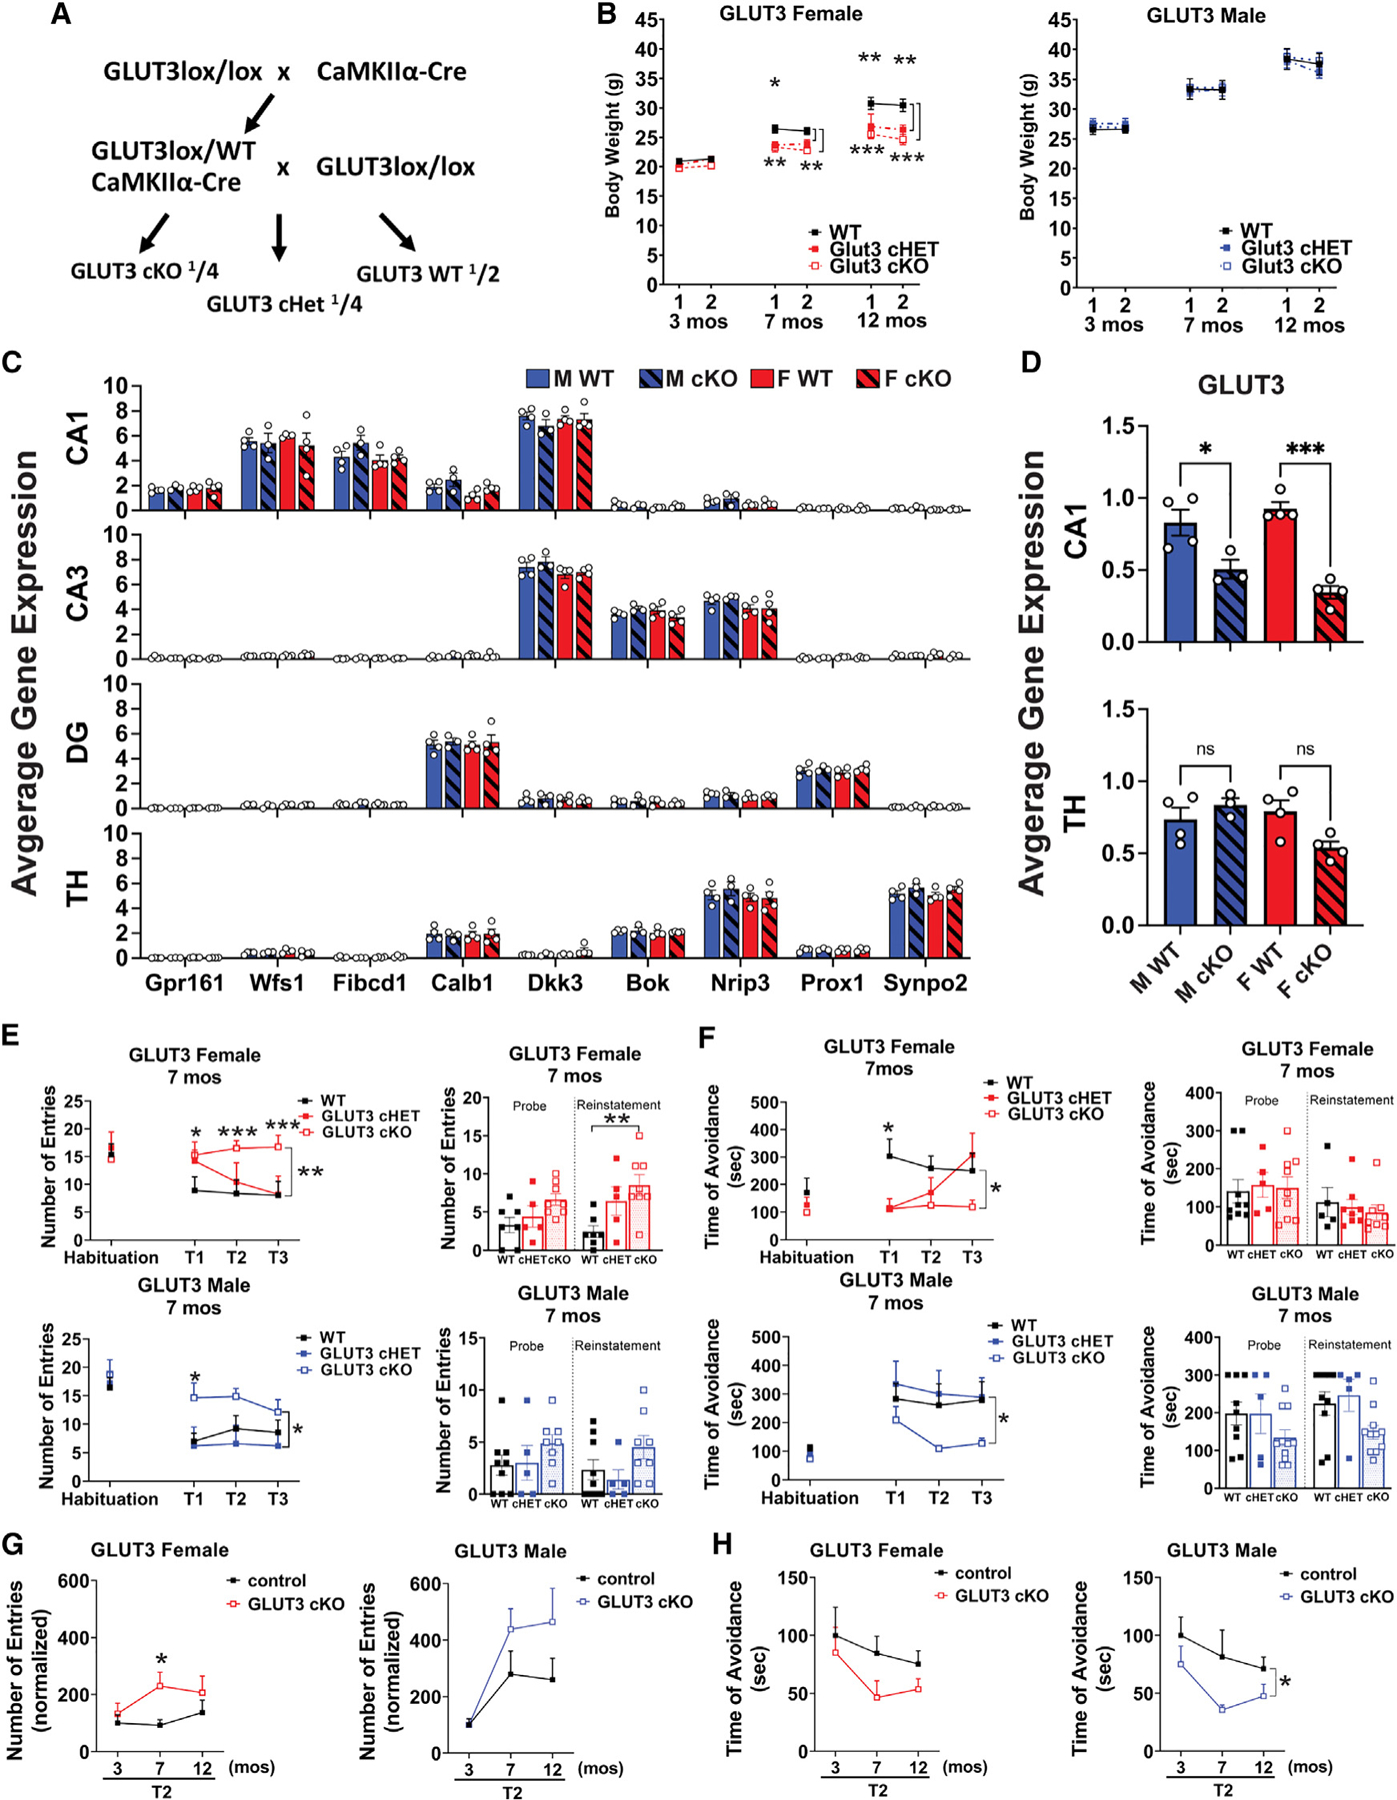
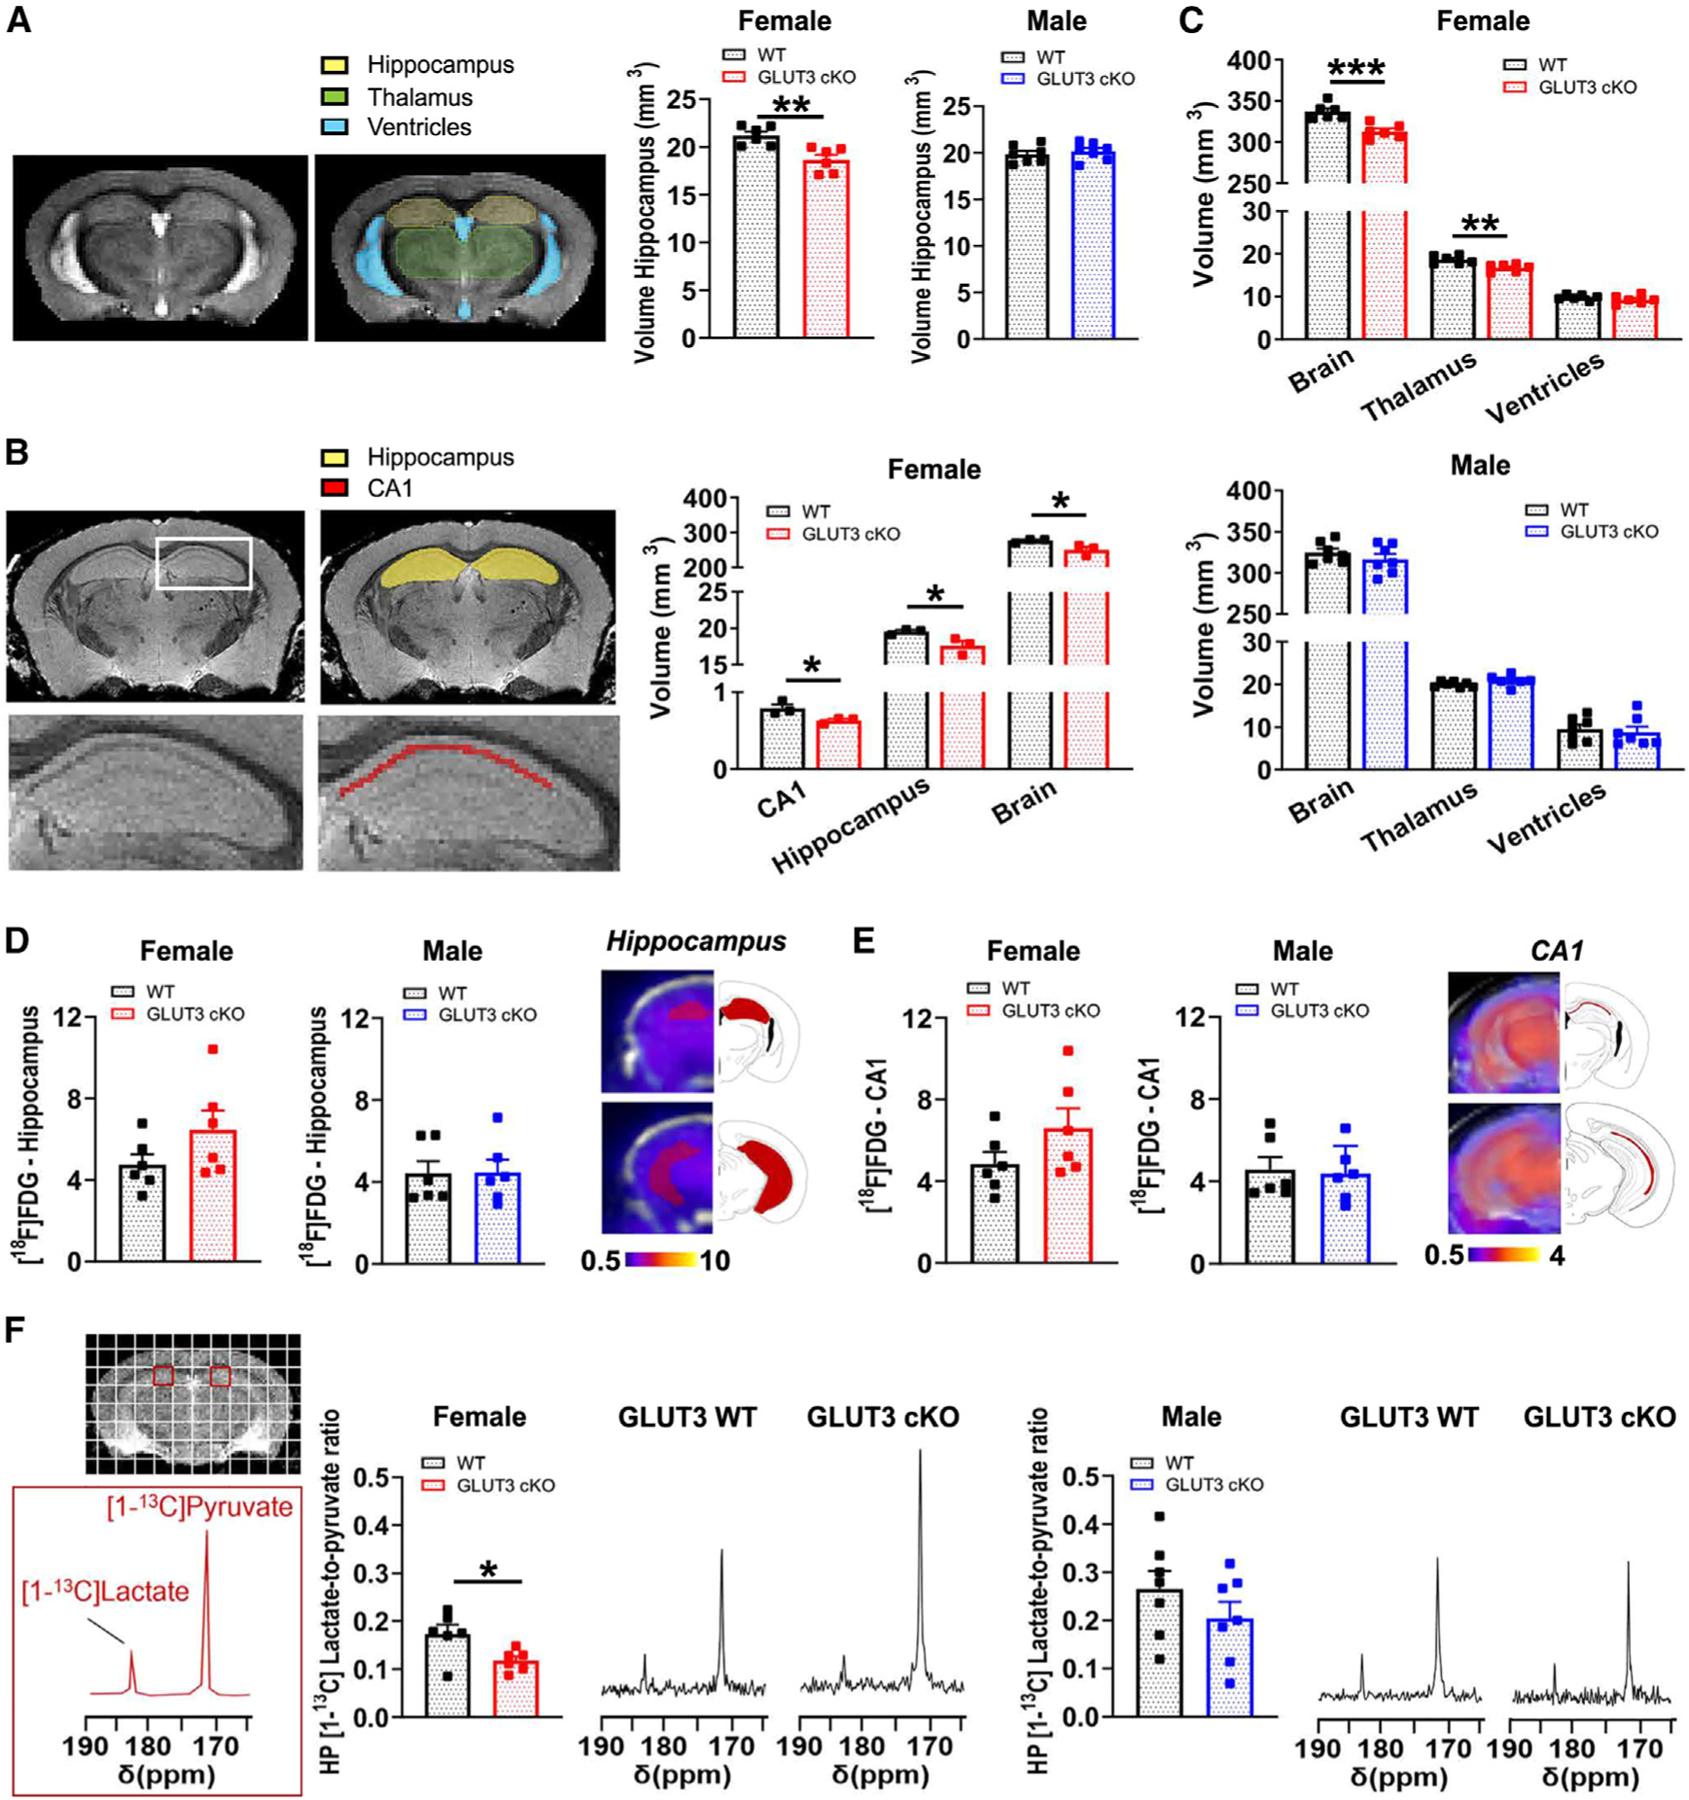
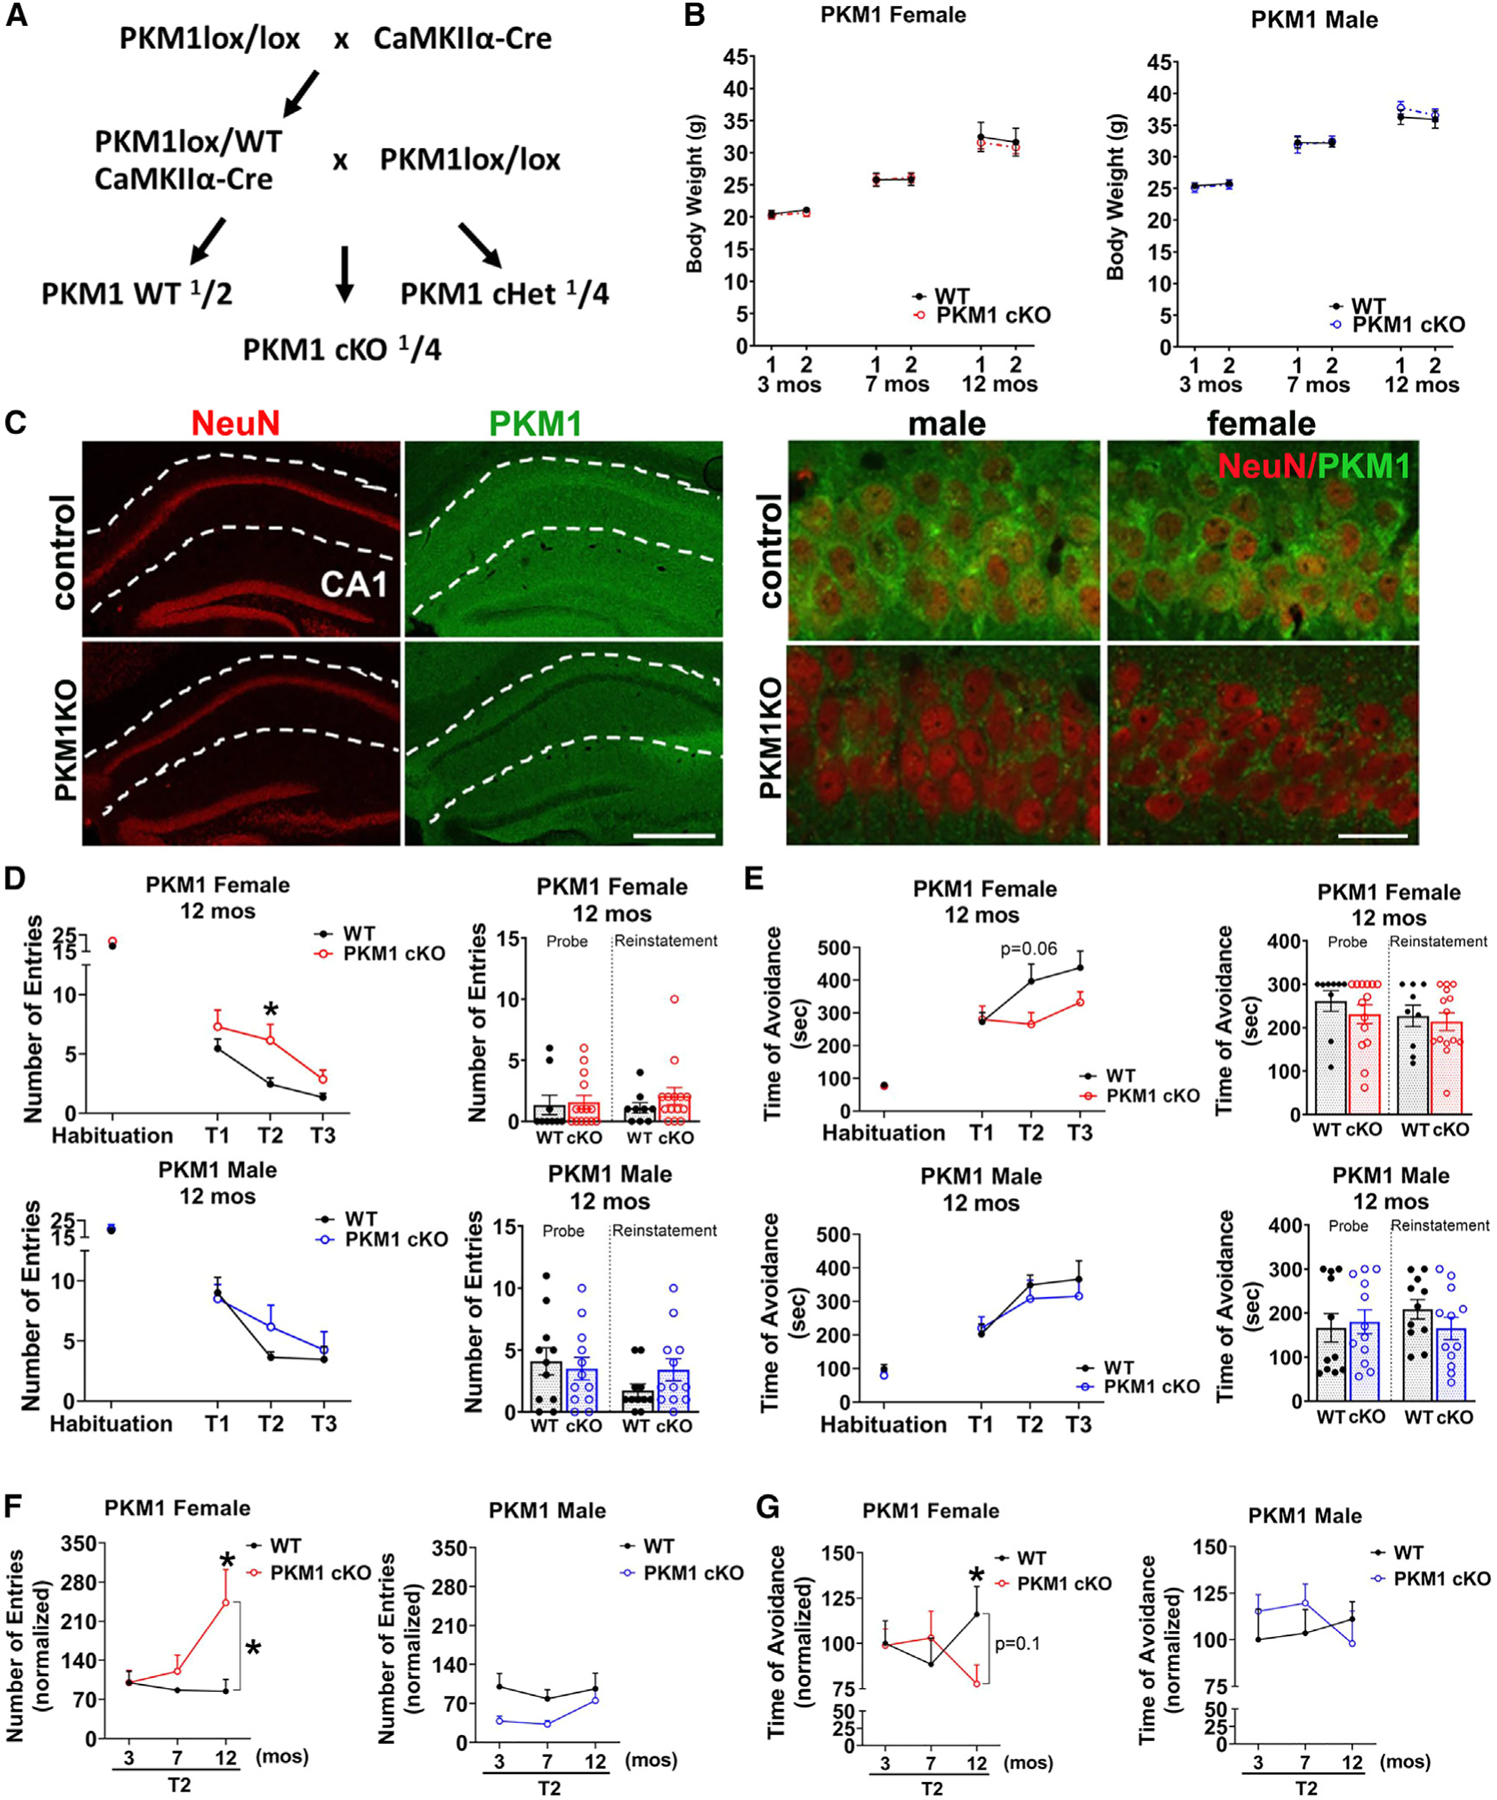
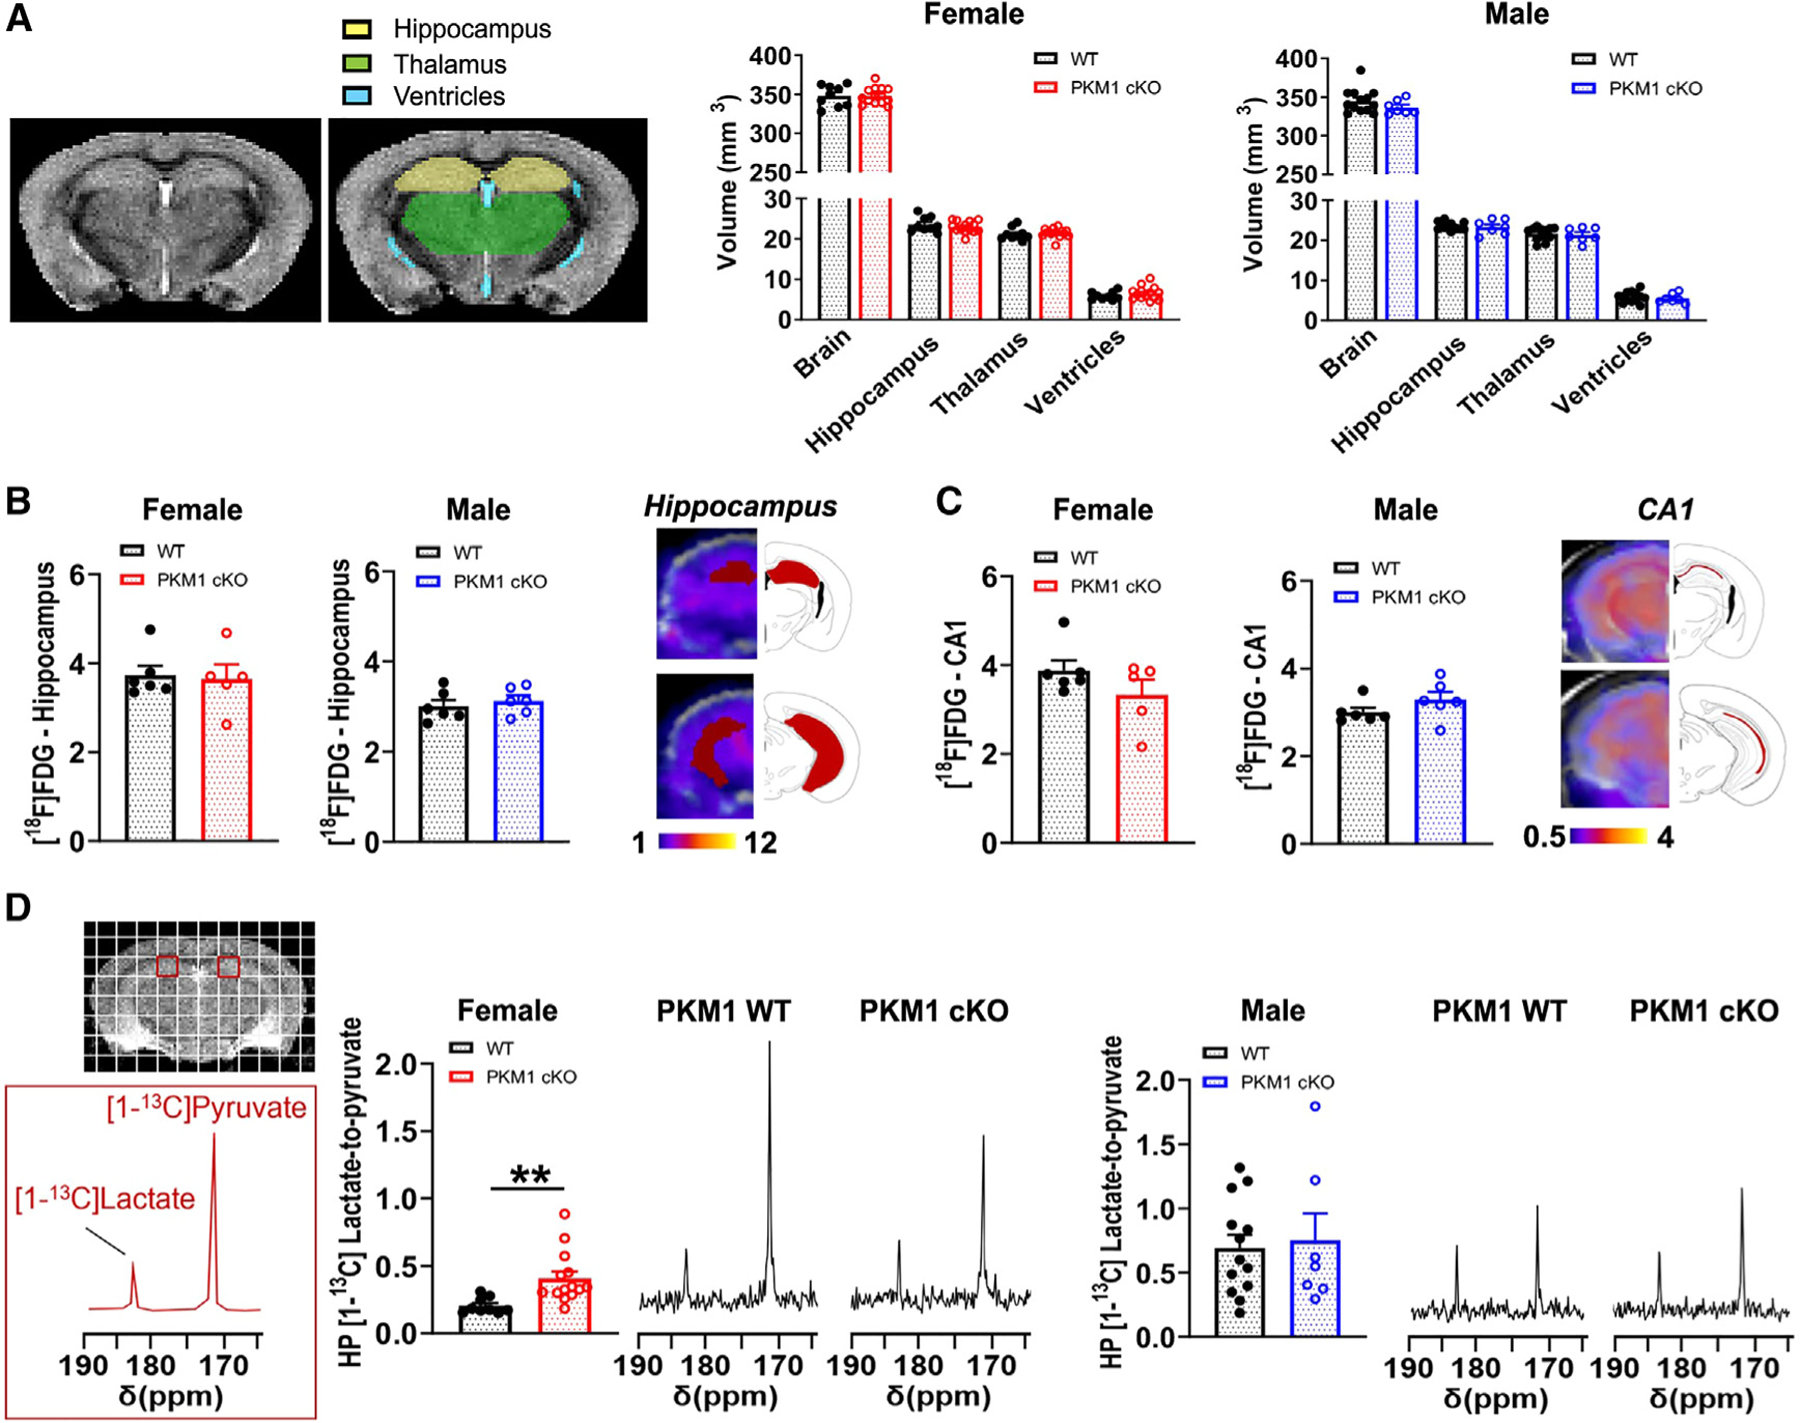
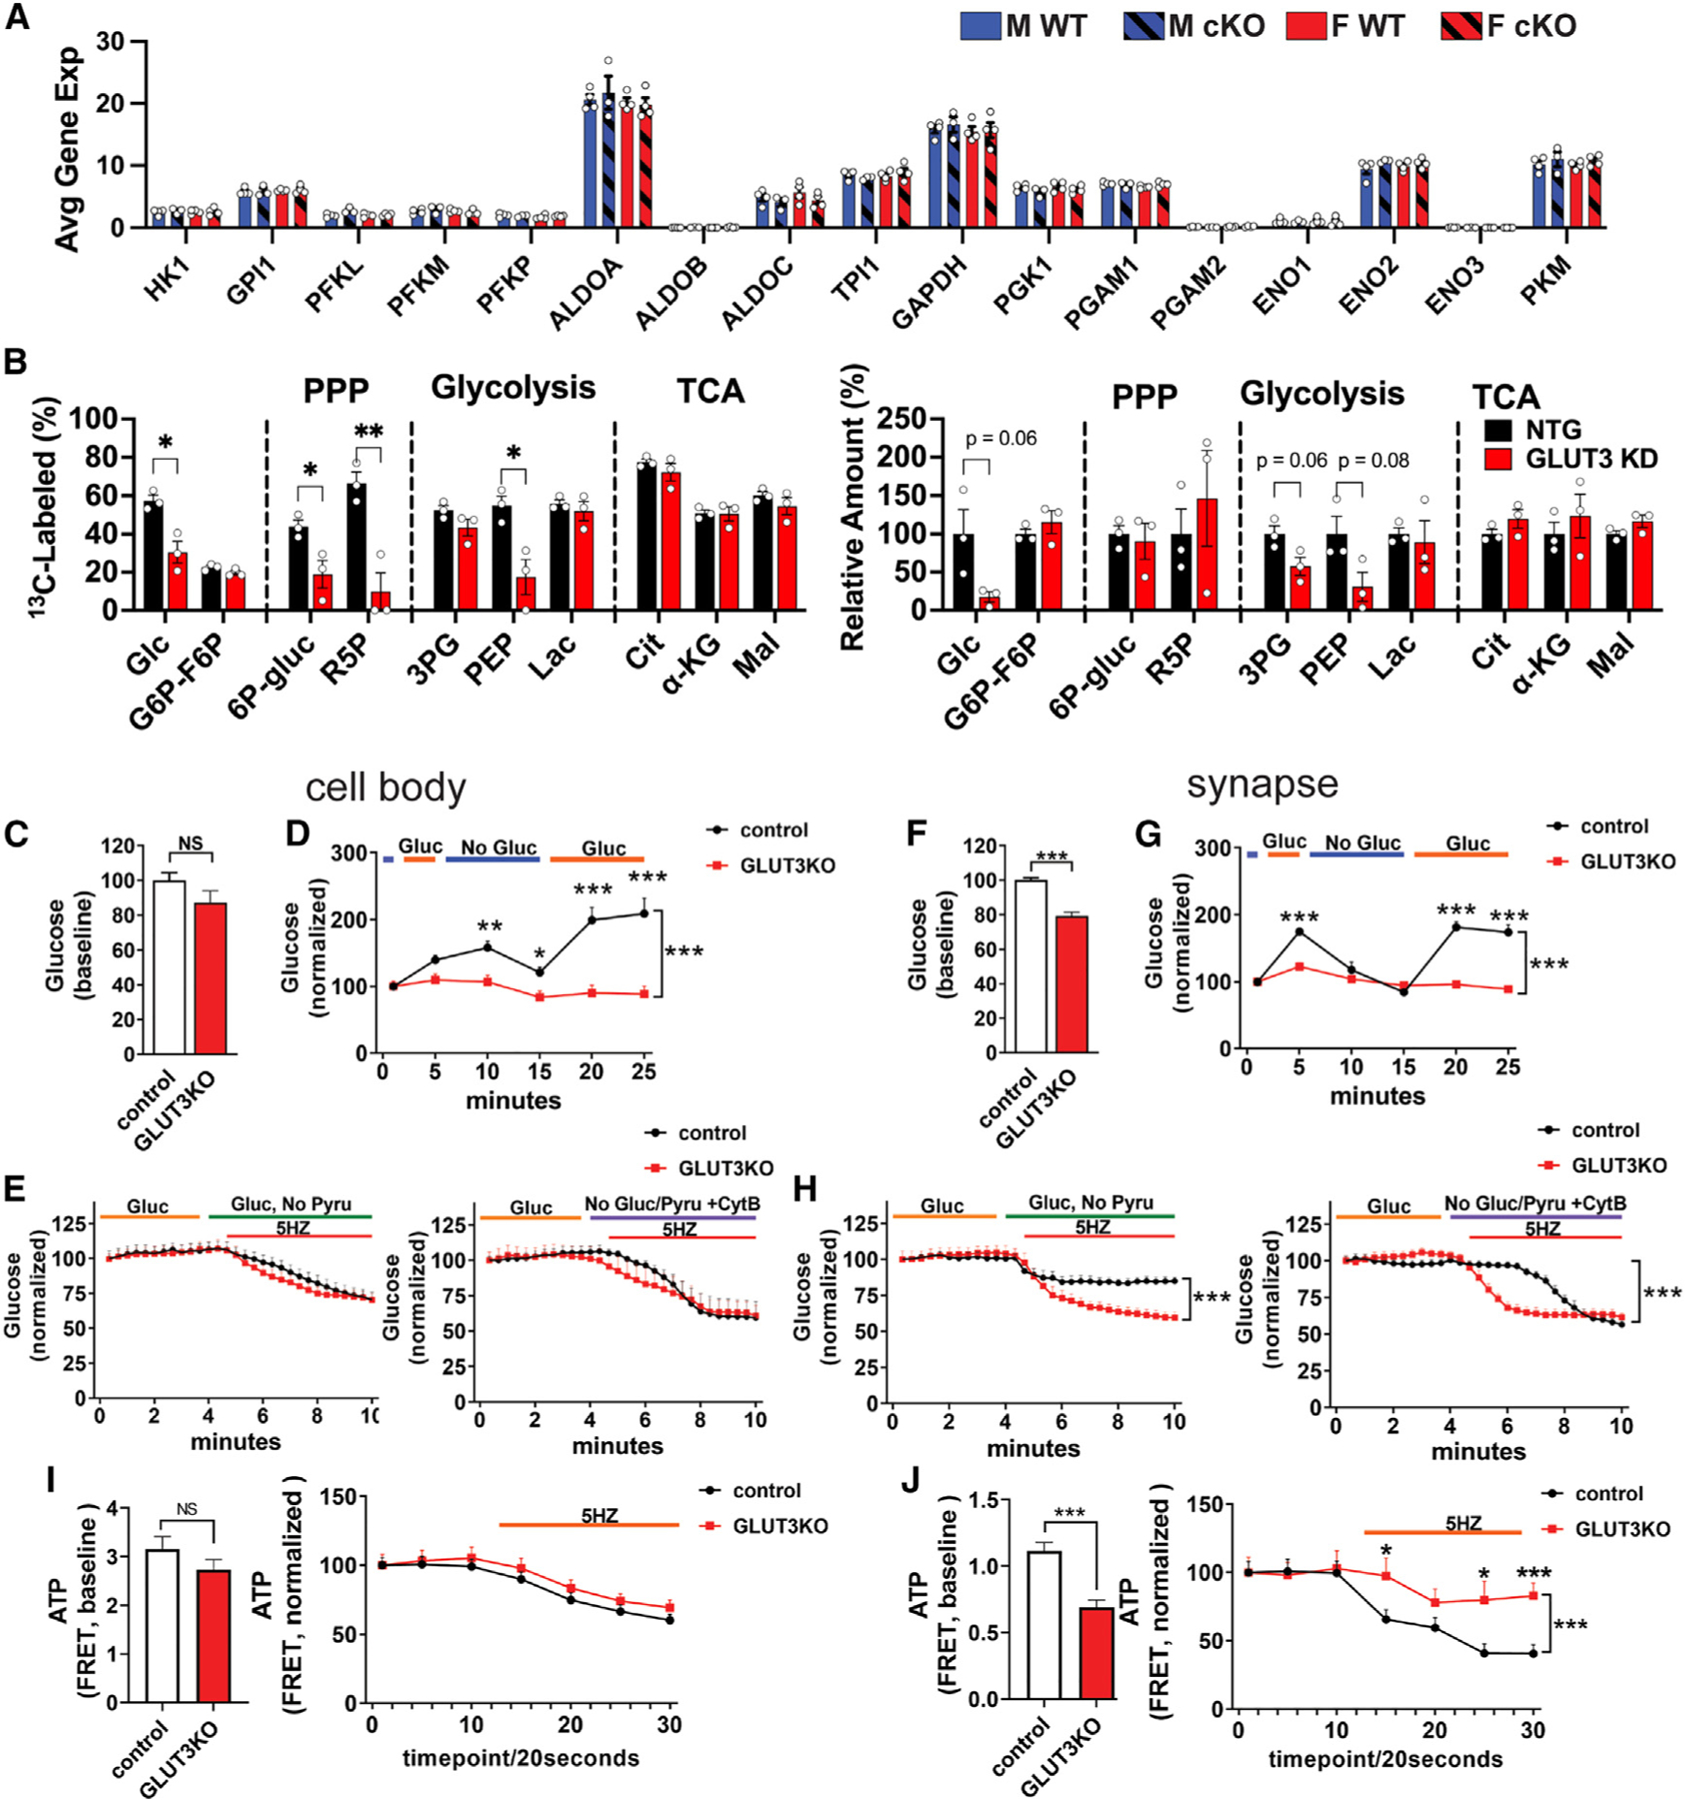
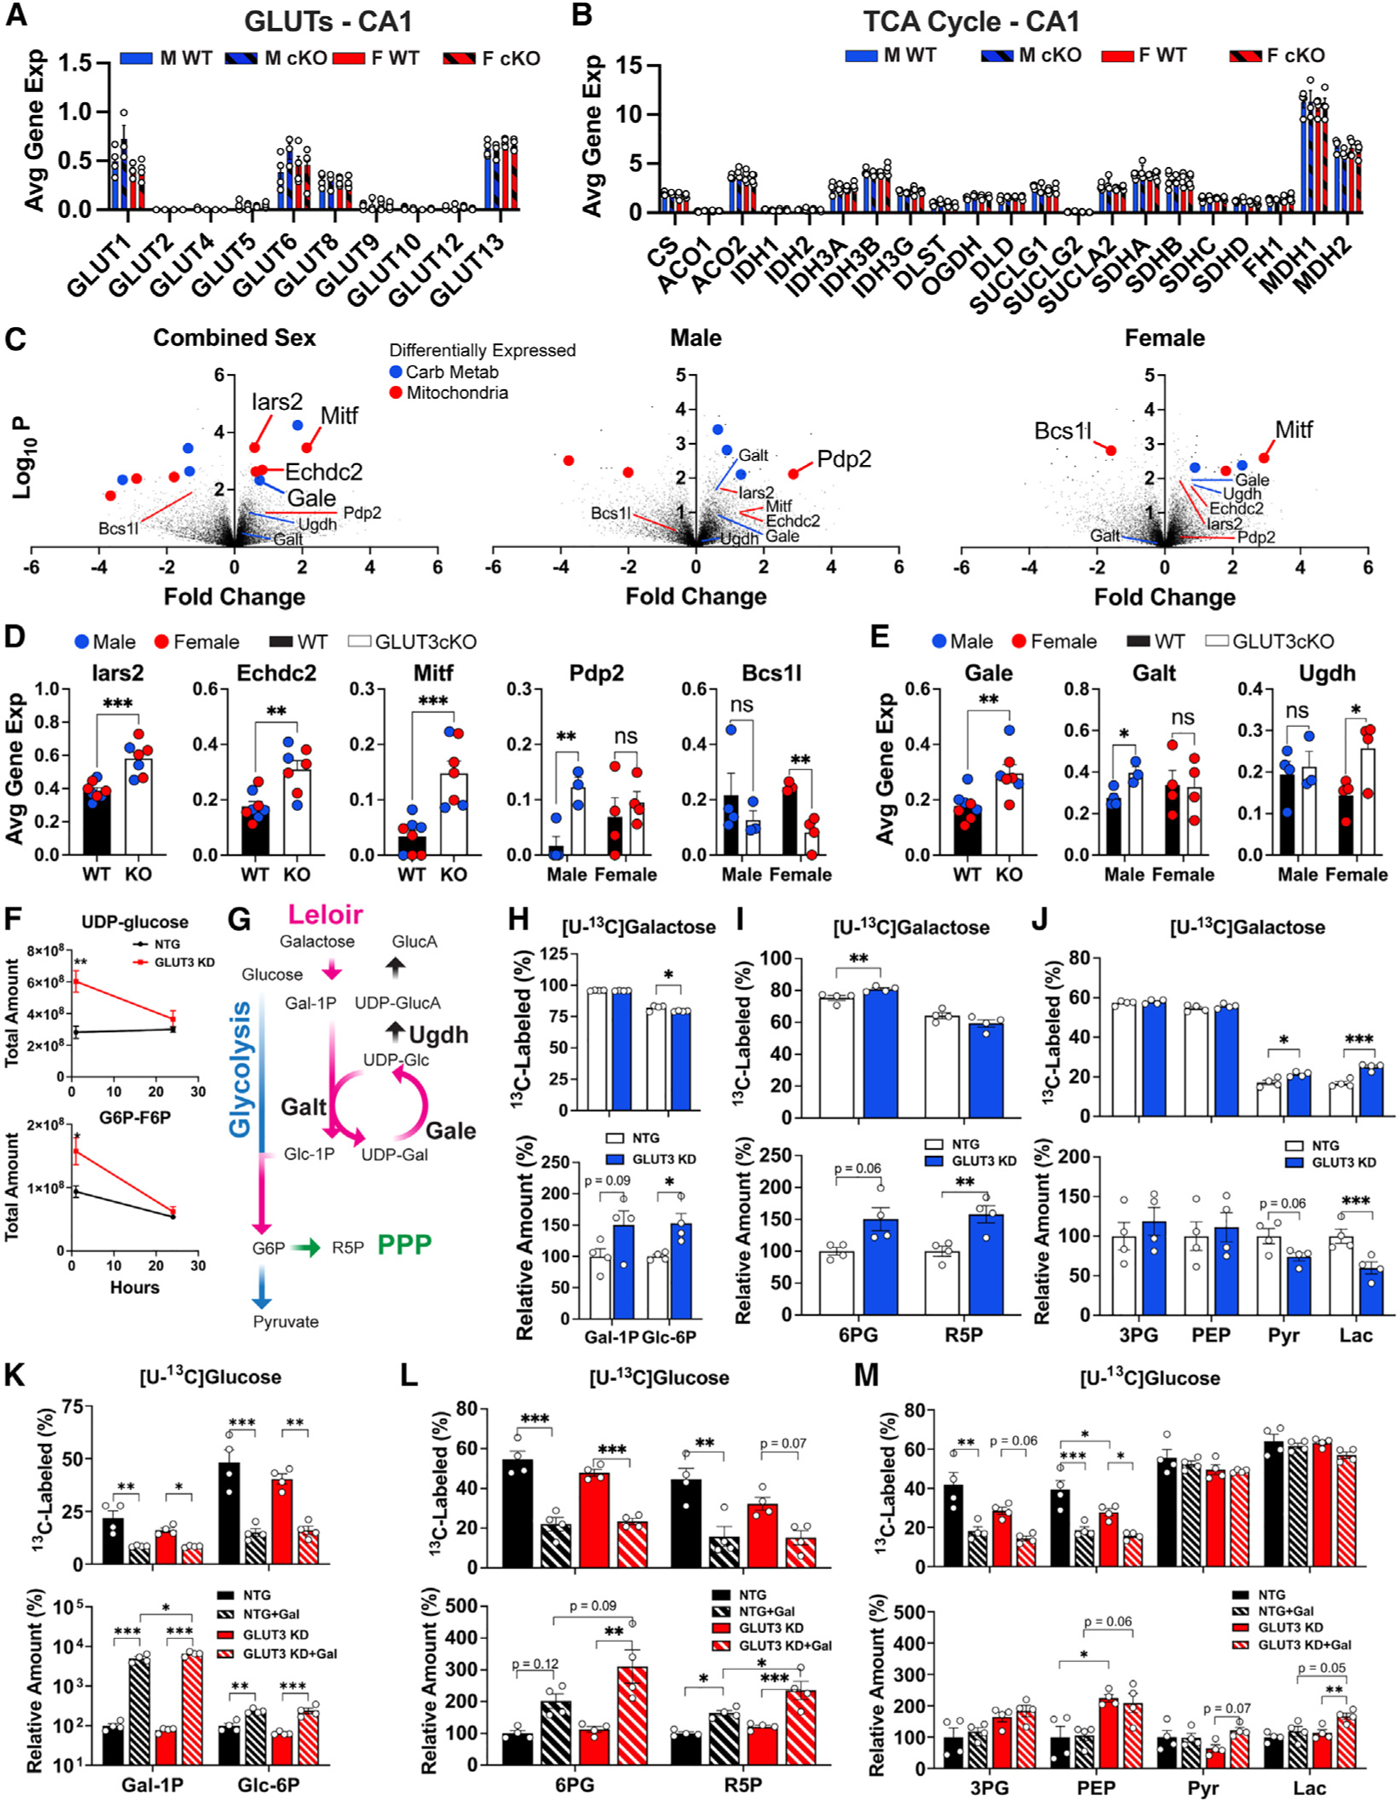
Neurons require large amounts of energy, but whether they can perform glycolysis or require glycolysis to maintain energy remains unclear. Using metabolomics, we show that human neurons do metabolize glucose through glycolysis and can rely on glycolysis to supply tricarboxylic acid (TCA) cycle metabolites. To investigate the requirement for glycolysis, we generated mice with postnatal deletion of either the dominant neuronal glucose transporter (GLUT3cKO) or the neuronal-enriched pyruvate kinase isoform (PKM1cKO) in CA1 and other hippocampal neurons. GLUT3cKO and PKM1cKO mice show age-dependent learning and memory deficits. Hyperpolarized magnetic resonance spectroscopic (MRS) imaging shows that female PKM1cKO mice have increased pyruvate-to-lactate conversion, whereas female GLUT3cKO mice have decreased conversion, body weight, and brain volume. GLUT3KO neurons also have decreased cytosolic glucose and ATP at nerve terminals, with spatial genomics and metabolomics revealing compensatory changes in mitochondrial bioenergetics and galactose metabolism. Therefore, neurons metabolize glucose through glycolysis in vivo and require glycolysis for normal function.

Keywords: CP: Neuroscience; bioenergetics; brain energy; galactose metabolism; glucose transporter; glycolysis; hyperpolarized magnetic resonance spectroscopic imaging; metabolomics; neuronal glucose metabolism; pyruvate kinase.


Conflict of interest statement

Declaration of interests M.G.V.H. discloses that he is a scientific advisor for Agios Pharmaceuticals, iTeos Therapeutics, Sage Therapeutics, Faeth Therapeutics, DRIOA Ventures, and Auron Therapeutics. Y.H. discloses that he is a co-founder and scientific advisory board member of GABAeron.

Figures

Figure 1.
Figure 1.. Human neurons metabolize glucose through glycolysis
(A and B) (A) Cellular and (B) media-derived metabolites from neurons expressing either an NTG guide (control) or a CRISPRi sgRNA targeting pyruvate kinase (PKM KD). Groups were compared for fractional [U-13C]glucose labeling (top) and total relative metabolite levels (bottom). See Figure S1D for corresponding isotopologue data. Data are means ± SEM. n = 4 samples/group. (C) Schematic of PKM KD impact on [U-13C] glucose metabolism. *p < 0.05, **p < 0.01, and ***p < 0.001 by Welch’s t tests.
Figure 2.
Figure 2.. Neurons have an age-dependent requirement for neuronal glucose uptake in vivo
(A) Breeding scheme for GLUT3cKO mice. (B) Weight measurements at age 3, 7, and 12 months. Data are means ± SEM; n = 9 GLUT3 WT, 5 Het, and 8 KO females, and n = 8–9 WT, 5 Het, and 8 KO males at each time point. (C) Graphs show regional signatures unique to neurons in CA1 (20–36 capture areas/mouse), CA3 (11–30 capture areas/mouse), dentate gyrus (DG; 13–34 capture areas/mouse), and thalamus (TH; 65–170 capture areas/mouse). n = 3–4 mice/group. (D) GLUT3 expression in CA1 and thalamic neurons. n = 3–4 mice/group. (E and F) GLUT3cKO mice develop age-dependent spatial learning and memory deficits as shown by active place avoidance. At 7 months, GLUT3cKO female and male mice have increased entrances into the aversive zone (E) and decreased maximal time of avoidance of this zone (F). (G and H) Longitudinal analysis shows change in second time point (T2) of active place avoidance, with each mouse normalized to the mean control value at 3 months. Although GLUT3cKO mice are equivalent to controls at 3 months, 7- and 12-month-old GLUT3cKO mice of both sexes enter the aversive zone more frequently than controls (G; see Figure S2 for full data from 3 and 12 months) and avoid it for less time (H). n = 9 WT, 5 Het, 8 KO females, and n=8–9 WT, 5 Het and 8 KO males at each time point, compiled from three cohorts. ns, not significant. *p % 0.05; **p < 0.01; ***p < 0.001 by Welch ANOVA with Dunnett’s T3 multiple comparisons test (B, E, F), two-way ANOVA with Tukey’s multiple comparison test (C), one-way ANOVA with Sidak’s multiple comparison test (D), and Welch’s t test (G and H). Brackets in graphs (E–H) show significance of linear mixed modeling for genotype (E and F) or the interaction of genotype and age (H).
Figure 3.
Figure 3.. Female GLUT3cKO mice have smaller CA1 and total brain volumes, and decreased HP [1-13C]lactate-to-pyruvate ratios
(A) Representative in vivo T2-weighted images of 10- to 14-month-old mice used for volumetric analyses. The hippocampal volume was significantly smaller in female GLUT3cKO mice. Data are means ± SEM; n = 6–7 mice/group. (B) Total brain and thalamus volumes calculated from in vivo T2-weighted images of 10- to 14-month-old mice were smaller in female GLUT3cKO mice, while ventricle volume was unchanged. n = 6–7 mice/group. (C) Representative ex vivo T2-weighted images of 19-month-old mice used for volumetric analyses. CA1, hippocampal, and entire brain volumes were smaller in female GLUT3cKO mice. n = 3 mice/group. (D and E) [18F]FDG-PET signal from the hippocampus (D) and specifically from the CA1 area (E) was similar between 12- and 14-month-old females and males. n = 6 mice/group. (F) Representative 13C spectra of 8- to 14-month-old mice showing HP [1-13C]pyruvate and HP [1-13C]lactate levels from a region containing CA1 (red square) for female and male mice. HP [1-13C]lactate-to-pyruvate ratios were significantly lower in female GLUT3cKO mice. n = 6–7 mice/group. *p % 0.05,**p % 0.01,***p % 0.001 by unpaired t tests.
Figure 4.
Figure 4.. Female mice have an age-dependent neuronal requirement for glycolysis
(A) Breeding scheme to generate mice with conditional postnatal deletion of PKM1 in CA1 and other forebrain neurons. (B) PKM1cKO mice have similar weights to controls. Repeated weight measurements at 3, 7, and 12 months of age. Data are means ± SEM; n = 10–11 PKM1 WT and 14 KO females, and 11 or 12 WT and 13 KO males at each time point. (C) PKM1 immunofluorescence shows loss of PKM in CA1 neurons in PKM1cKO mice. Sections from 12-month-old mice are stained with NeuN (red) and PKM1 (green). Scale bar, 400 mm (left), 40 mm (right). (D–G) Female PKM1cKO mice develop age-dependent spatial learning and memory deficits as shown by active place avoidance. (D and E) Female PKM1cKO mice have increased entrances into the aversive zone (D), and a trend of decreased maximal time of avoidance of this zone (E) at 12 months of age (p = 0.06). No deficits were observed in males. (F and G) Longitudinal analysis shows change in second time point (T2) of active place avoidance testing, with each mouse normalized to the mean control value at 3 months. PKM1cKO females are equivalent to controls at 3 and 7 months of age, but 12-month-old PKM1cKO mice enter the aversive zone more frequently than controls (F), and avoid it for less time (G), whereas no deficits were observed in males (see Figure S4 for full data from 3 to 7 months). n = 10–11 WT, 14 KO females, and 11 or 12 WT and 13 KO males, each compiled from three cohorts. *p % 0.05 by Welch ANOVA with Dunnett’s T3 multiple comparisons test (D and E) and Welch’s t tests (F and G). Brackets in graphs (F and G) show significance of linear mixed modeling for the interaction of genotype and age (F and G).
Figure 5.
Figure 5.. Female PKM1cKO mice have increased metabolic conversion of HP pyruvate to lactate
(A) Representative in vivo T2-weighted images of 11- to 15-month-old mice used for volumetric analyses showed no differences between female or male PKM1cKO and PKM1WT mice for the entire brain, hippocampus, thalamus, or ventricles. Data are means ± SEM. n = 9 PKM1WT, 14 KO females, and n = 7 PKM1WT, 13 KO males. (B and C) There were no differences in [18F]FDG-PET signal between 11- and 14-month-old mice PKM1WT and PKM1cKO mice in the hippocampus (B) or CA1 (C). n = 5–6 mice/group. (D) Representative 13C spectra of 11- to 15-month-old mice showing HP [1-13C]pyruvate and HP [1-13C]lactate levels from a region containing CA1 (red square). HP [1-13C]lactate-to-pyruvate ratios were markedly higher in female PKM1cKO versus PKM1WT mice, but were similar in males. n=9 PKM1WT, 14 KO females and seven PKM1WT, 13 KO males. **p%0.01 by unpaired t tests.
Figure 6.
Figure 6.. Neurons require glucose uptake and glycolysis to maintain ATP at the synapse
(A) Expression of glycolytic genes in GLUT3cKO CA1 neurons. Data are means ± SEM. n = 3–4 mice/group, compiled from 20 to 36 capture areas/mouse in CA1. (B) Effect of GLUT3 KD in iPSC-derived neurons incubated for 24 h with 1.5 mM [U-13C]glucose on percentage of glucose-derived metabolites and total metabolites. The corresponding isotopologue data are shown in Figure S7C. Identical NTG controls (1.5 mM [U-13C]glucose) are shown in Figures S7B and S7C. n = 3 samples/group. (C–H) GLUT3 KO disrupts glucose homeostasis in individual neurons. GLUT3lox/lox neurons were co-transfected with a fluorescent glucose sensor (iGlucoSnFR-mRuby) and either Cre (to delete GLUT3, GLUT3KO) or empty vector (control), as well as BFP-synaptophysin to identify synaptic boutons. (C and D) GLUT3KO neurons had similar basal glucose levels to controls at the cell body (C), but their glucose levels were less responsive to changes in the extracellular glucose (D). (E) Glucose levels decreased similarly in GLUT3KO and control neurons with electrical stimulation (5 Hz, 5.5 min) to increase neural activity (left), and the speed and extent of decrease was somewhat greater when glucose uptake was blocked with cytochalasin B (right) n = 8–10 coverslips/group (two or three cells/coverslip) from three independent experiments. (D and E) Control and GLUT3cKO glucose values are normalized to the starting point. (F and G) The synapses of GLUT3KO neurons had lower basal glucose levels (F), and their glucose levels were less responsive to changes in the extracellular glucose than controls (G). (H) Glucose levels in GLUT3KO synapses decreased to a greater extent in GLUT3cKO versus control synapses, in response to electrical stimulation (left). Blocking all glucose uptake with cytochalasin B caused glucose levels in controls to drop to GLUT3KO levels (right). n = 8–10 coverslip/group, three to five synapses/coverslip from three independent experiments. (I) GLUT3KO neurons have similar basal ATP levels at cell bodies (left), and in response to electrical stimulation (5 Hz, 5.5 min) to increase the ATP demand (right). n = 11–13 coverslips/group, two or three cells/coverslip from five independent experiments. (J) GLUT3KO synaptic boutons have decreased ATP levels (left), and their ATP levels decrease less in response to stimulation (5 Hz, 5.5 min). n = 6–7 coverslips/group, three to five synapses/coverslip from three independent experiments. ns, not significant; *p < 0.05; **p < 0.01; ***p < 0.001, by unpaired t tests (C, F, I, J) or two-way ANOVA with Tukey’s multiple comparison (A and B). Brackets in graphs show significance of linear mixed modeling for the interaction of genotype and time (D, E, G, H, I right, J right) with Sidak’s multiple comparison.
Figure 7.
Figure 7.. Sex-dependent and independent neuronal responses to decreased glucose uptake
(A) Impact of GLUT3cKO on expression of other GLUTs in CA1 neurons. Data are means ± SEM, n = 3–4 mice/group, each compiled from 20 to 36 capture areas in CA1 per mouse. (B) Expression of TCA genes in CA1 neurons. n = 3–4 mice/group. (C) Volcano plots of differentially expressed genes between GLUT3cKO and WT mice. n = 7–8 (combined sexes), three or four (males only) and four (females only) mice/group. Blue and red points indicate genes related to carbohydrate metabolism and mitochondria, respectively. (D) Gene expression of top hits Iars2, Echdc2, Mitf, Pdp2, and Bcs1l for CA1 neurons. n = 3–4 mice/group. Data points are shown for male (blue) and female (red) mice. (E) Expression of galactose metabolism hits Gale, Galt, and Ugdh for CA1 neurons. n = 3–4 mice/group. Data points for male (blue) and female (red) mice. (F) Impact of GLUT3 KD on targeted and untargeted metabolite levels of UDP-glucose and G6P-F6P following incubation with [U-13C]glucose for 1 and 24 h n = 3 samples/group/time point. (G) Schema of potential compensatory pathway for decreased glucose uptake, by which galactose is metabolized into glucose-6-phosphate. (H–J) Relative amounts and [U-13C]galactose fractional labeling of Leloir, PPP, and glycolytic metabolites in GLUT3 KD and NTG neurons after 24 h of culture. n = 4 samples/group. (K–M) Relative total amounts and [U-13C]glucose fractional labeling of Leloir, PPP, and glycolytic pathway metabolites in GLUT3 KD neurons relative to NTG neurons when treated with either 1.5 mM [U-13C]glucose or 1.5:1.5 mM [U-13C]glucose:galactose for 24 h. n = 4 samples/group. *p < 0.05, **p < 0.01, ***p < 0.001 by unpaired t test and two-way ANOVA with either Tukey’s multiple comparisons test (D, E, H–M) or Sidak’s multiple comparisons test (F).

Similar articles

Cited by

References

    1. Bélanger M, Allaman I, and Magistretti PJ (2011). Brain energy metabolism: focus on astrocyte-neuron metabolic cooperation. Cell Metab 14, 724–738. 10.1016/j.cmet.2011.08.016. - DOI - PubMed
    1. Patel AB, Lai JCK, Chowdhury GMI, Hyder F, Rothman DL, Shulman RG, and Behar KL (2014). Direct evidence for activity-dependent glucose phosphorylation in neurons with implications for the astrocyte-to-neuron lactate shuttle. Proc. Natl. Acad. Sci. USA 111, 5385–5390. 10.1073/pnas.1403576111. - DOI - PMC - PubMed
    1. Lundgaard I, Li B, Xie L, Kang H, Sanggaard S, Haswell JDR, Sun W, Goldman S, Blekot S, Nielsen M, et al. (2015). Direct neuronal glucose uptake heralds activity-dependent increases in cerebral metabolism. Nat. Commun 6, 6807. 10.1038/ncomms7807. - DOI - PMC - PubMed
    1. Ivanov AI, Malkov AE, Waseem T, Mukhtarov M, Buldakova S, Gubkina O, Zilberter M, and Zilberter Y (2014). Glycolysis and oxidative phosphorylation in neurons and astrocytes during network activity in hippocampal slices. J. Cereb. Blood Flow Metab 34, 397–407. 10.1038/jcbfm.2013.222. - DOI - PMC - PubMed
    1. Maher F (1995). Immunolocalization of GLUT1 and GLUT3 glucose transporters in primary cultured neurons and glia. J. Neurosci. Res 42, 459–469. 10.1002/jnr.490420404. - DOI - PubMed

Publication types