. 2023 Apr 7;19(4):e1010942.
doi: 10.1371/journal.ppat.1010942. eCollection 2023 Apr.

A compensatory RNase E variation increases Iron Piracy and Virulence in multidrug-resistant Pseudomonas aeruginosa during Macrophage infection

Affiliations

A compensatory RNase E variation increases Iron Piracy and Virulence in multidrug-resistant Pseudomonas aeruginosa during Macrophage infection

Mylene Vaillancourt et al. PLoS Pathog. .

Abstract

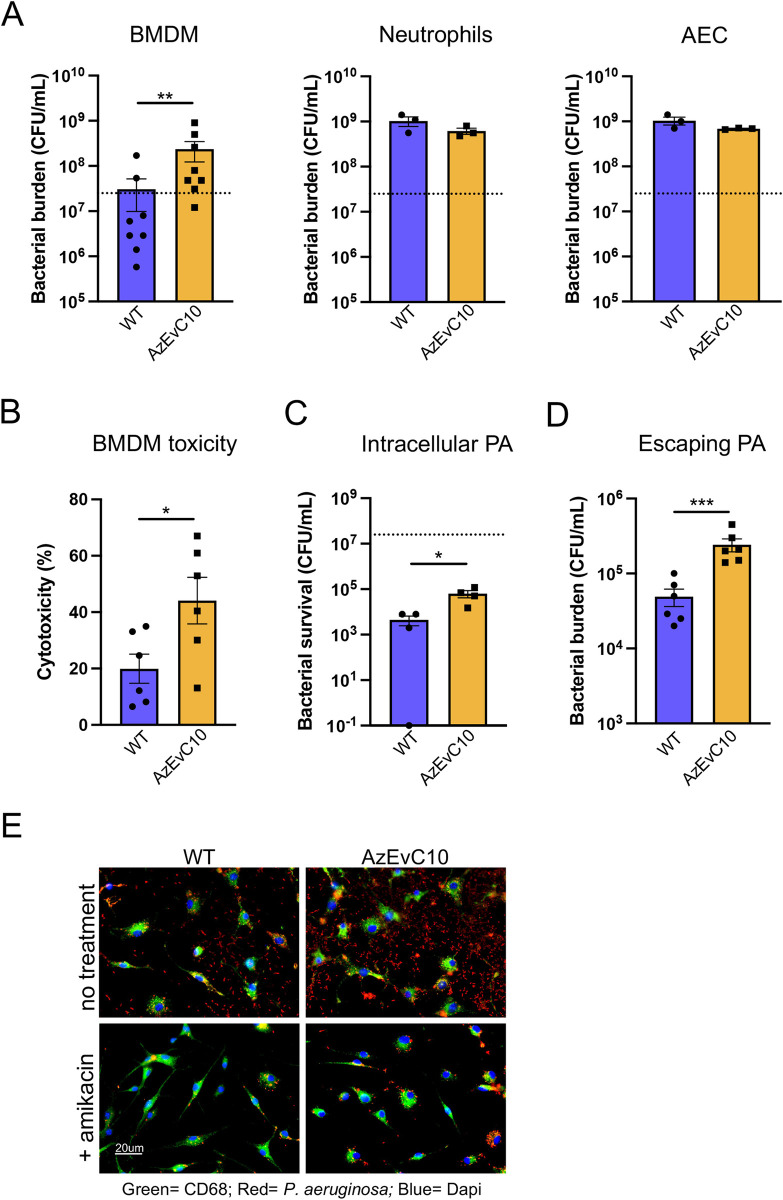
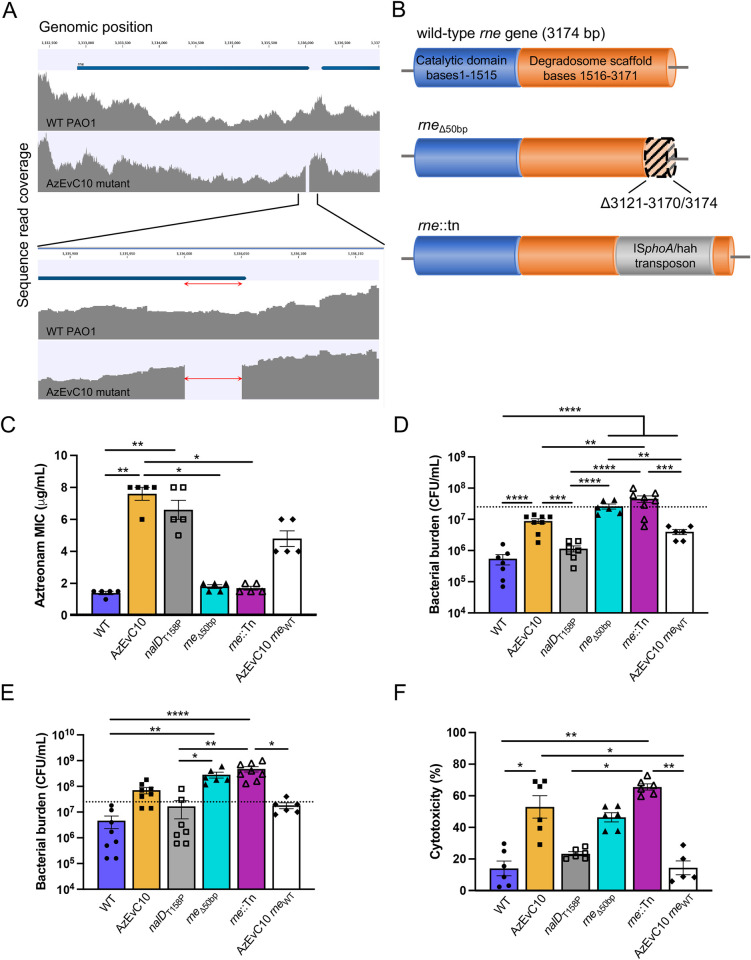
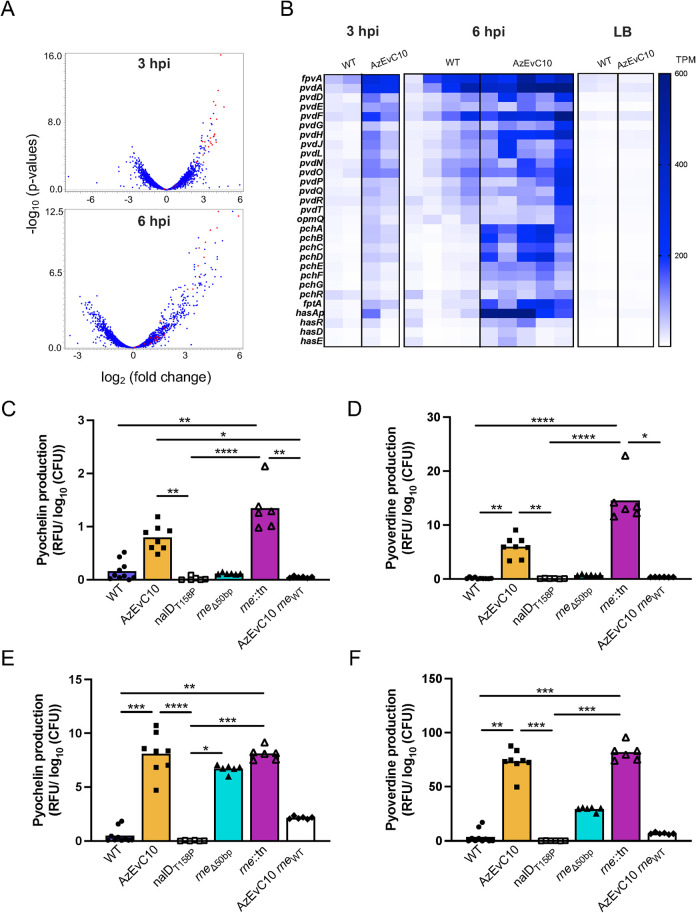
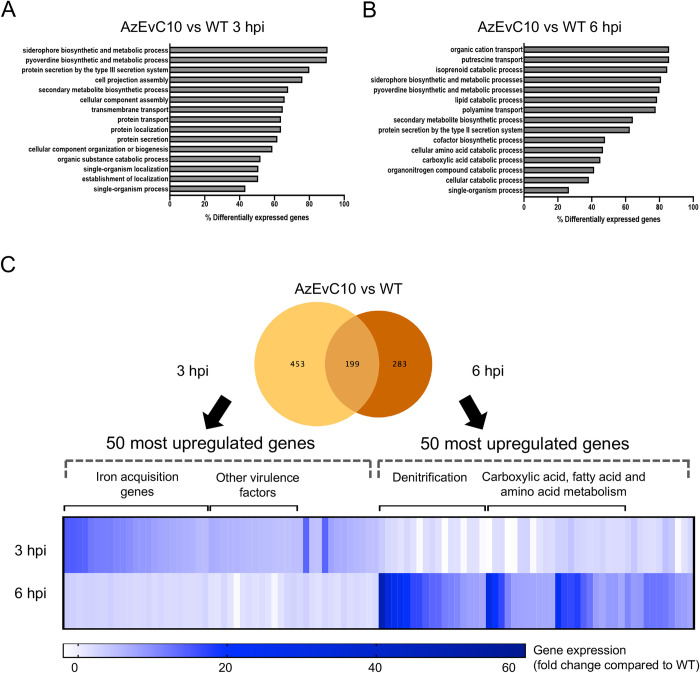
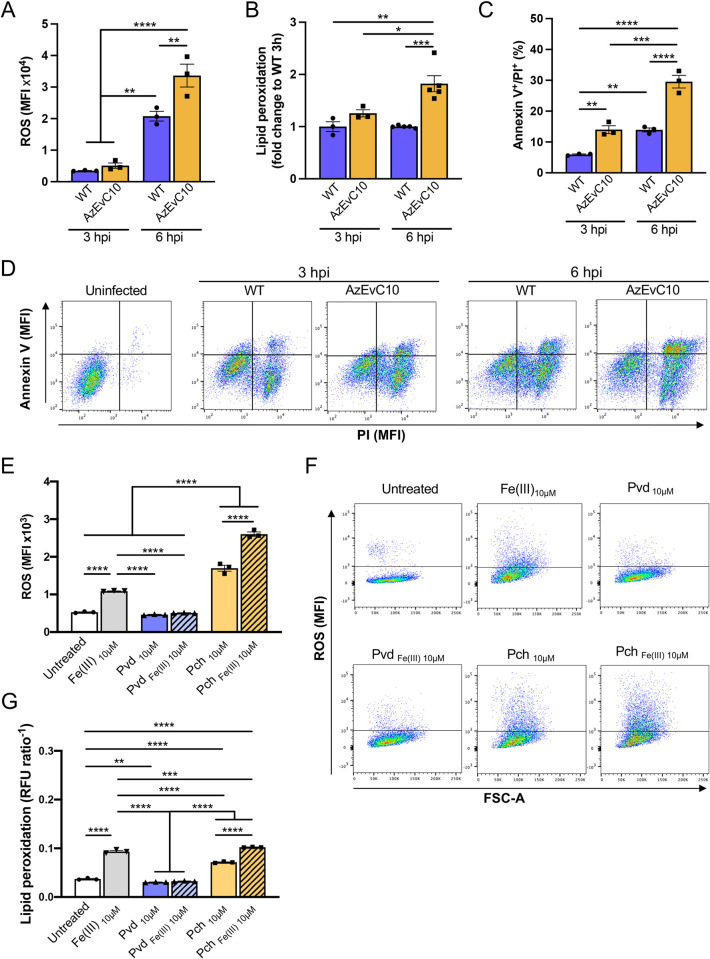
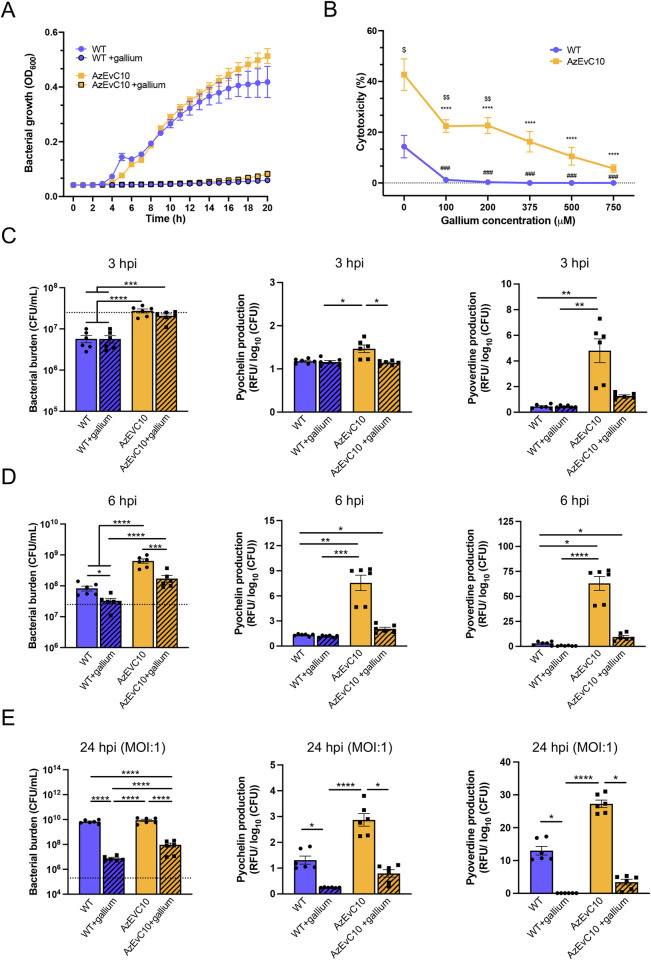
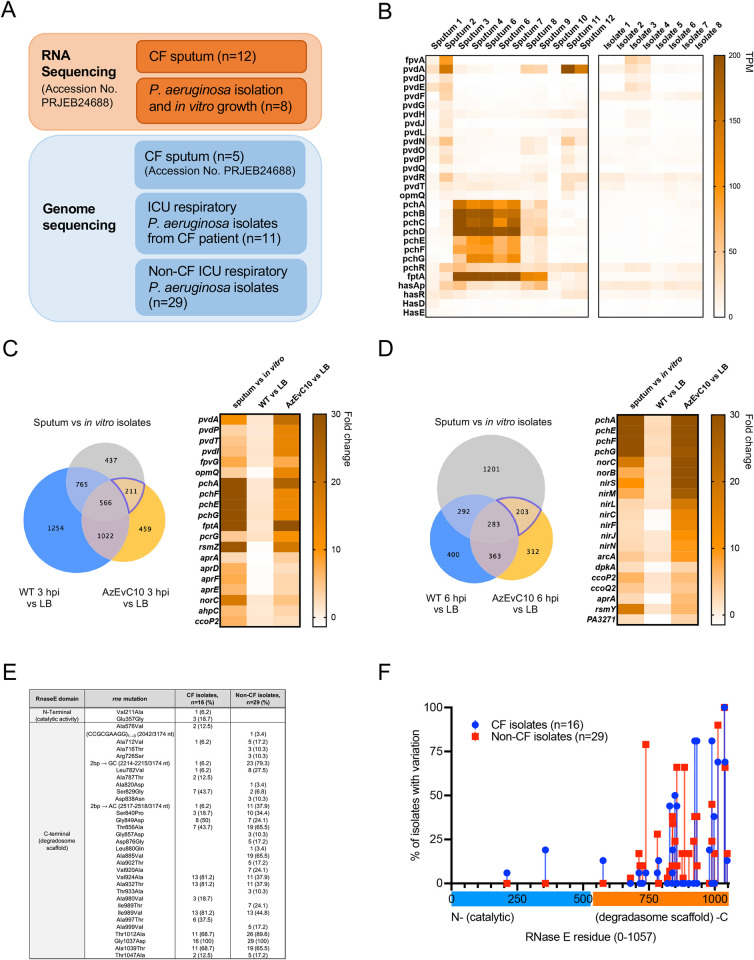
During chronic cystic fibrosis (CF) infections, evolved Pseudomonas aeruginosa antibiotic resistance is linked to increased pulmonary exacerbations, decreased lung function, and hospitalizations. However, the virulence mechanisms underlying worse outcomes caused by antibiotic resistant infections are poorly understood. Here, we investigated evolved aztreonam resistant P. aeruginosa virulence mechanisms. Using a macrophage infection model combined with genomic and transcriptomic analyses, we show that a compensatory mutation in the rne gene, encoding RNase E, increased pyoverdine and pyochelin siderophore gene expression, causing macrophage ferroptosis and lysis. We show that iron-bound pyochelin was sufficient to cause macrophage ferroptosis and lysis, however, apo-pyochelin, iron-bound pyoverdine, or apo-pyoverdine were insufficient to kill macrophages. Macrophage killing could be eliminated by treatment with the iron mimetic gallium. RNase E variants were abundant in clinical isolates, and CF sputum gene expression data show that clinical isolates phenocopied RNase E variant functions during macrophage infection. Together these data show how P. aeruginosa RNase E variants can cause host damage via increased siderophore production and host cell ferroptosis but may also be targets for gallium precision therapy.


Conflict of interest statement

The authors have declared that no competing interests exist.

Figures

Fig 1
Fig 1. An aztreonam-evolved P. aeruginosa mutant replicates more during macrophage infection.
A. BMDM, BM-derived neutrophil, or AEC cells were infected with WT PAO1 or the AzEvC10 mutant for 6 h. Dotted lines represent the initial infection inoculum, 2.5 x 10⁷ CFU/mL. Bacterial burden at 6 hpi was determined by viable CFU plate counts. Analysis was matched for experimental repeat. B. BMDM cytotoxicity assessed by LDH assay at 6 hpi by WT or AzEVC10. Analysis was matched for experimental repeat. C. Intracellular survival of bacteria in BMDM at 6 hpi, following amikacin treatment at 1 hpi for a total of 5 h to kill extracellular bacteria. Viable intracellular bacteria were determined by CFU plate counts. D. Escaping bacteria at 6 hpi: Amikacin was added in medium at 1 hpi and left for 1 h. Then cells were incubated in fresh medium (no amikacin) for another 4 h. Escaping bacteria were determined by CFU plate counts. E. Images of BMDM infections at 6 hpi by immunofluorescence showing macrophages in green, P. aeruginosa in red, and DAPI in blue. n = 3–6 independent replicates for each experiment. *p<0.05, **p<0.01, ***p<0.001, ****p<0.0001. See S5 Table for statistical tests used and exact p-values.
Fig 2
Fig 2. AzEvC10 mutant hypervirulence is caused by an RNase E mutation.
A. Genome diagram showing coverage of DNA sequencing reads aligning to the rne gene. The deletion of bases 3121-3170/3174 nt of the rne gene in the AzEvC10 mutant are enlarged in the bottom panel. Genome coverage plots generated from sequencing read alignments to the PAO1 reference genome are indicated in grey. B. Schematic representation of the rne gene and corresponding RNase E protein domain description. WT PAO1, nalDT158P, and AzEvC10 rneWT mutants carry a wild-type rne gene. AzEvC10 and rneΔ50bp mutants have a deletion of the bases 3121-3170/3174 nt in the rne gene. The rne::Tn mutant carries an ISphoA/hah transposon inserted at the position 2945 nt of the gene. C. Aztreonam MIC was assessed by Etest for the indicated bacteria. D-E. BMDM cells were infected with WT PAO1 or different nalD and rne mutants at MOI:100 for 3 h (D) and 6 h (E). Bacterial burden was determined by viable CFU plate counts. Dotted lines represent the initial infection inoculum, 2.5 x 10⁷ CFU/mL. F. BMDM cytotoxicity was assessed by LDH assay at 6 hpi with indicated bacteria. n = 5–8 independent replicates for each experiment *p<0.05, **p<0.01, ***p<0.001, ****p<0.0001. See S5 Table for statistical tests used and exact p-values.
Fig 3
Fig 3. Iron acquisition genes are upregulated in the AzEvC10 mutant during macrophage infection.
A-B. Genes involved in iron acquisition were upregulated in the AzEvC10 mutant compared to WT PAO1 during BMDM infection at 3 hpi (n = 2) and 6 hpi (n = 4–5), but not when grown in LB broth (n = 2). A. Volcano plot highlighting differentially expressed iron acquisition genes in red during BMDM infection. B. Heat map indicates expression of indicated genes in individual biological replicates expressed in normalized number of reads (TPM) during WT and AzEvC10 BMDM infections at indicated time points. C-F. Pyochelin and pyoverdine production by given strains measured by fluorescence (Ex350/Em430 for pyochelin and Ex400/Em460 for pyoverdine) at 3 hpi (C-D) and 6 hpi (E-F) and normalized to log10(CFU). n = 5–8 independent replicates for each experiment. *p<0.05, **p<0.01, ***p<0.001, ****p<0.0001. See S5 Table for statistical tests used and exact p-values.
Fig 4
Fig 4. The AzEvC10 mutant upregulates virulence factor expression before metabolic gene expression during macrophage infection.
A-B. Gene Ontology Enrichment Analyses reveal distinct enriched biological processes in the AzEvC10 mutant at 3 hpi (A) and 6 hpi (B). Percentage indicates relative number of genes in each pathway that were differentially regulated. C. Venn Diagram of AzEvC10 mutant DEGs compared to WT PAO1 at 3 hpi and 6 hpi of BMDM. The 50 most upregulated genes at each timepoint were selected and the expression is presented in mean fold-change compared to WT PAO1 (n = 2–5 independent replicates for each experiment).
Fig 5
Fig 5. The AzEvC10 mutant induces iron dysregulation, oxidative stress, and ferroptosis in macrophages.
BMDM cells were infected with WT PAO1 or AzEvC10 mutant at MOI:100 for 3 h and 6 h. A. Quantification of ROS in infected BMDM by flow cytometry. Quantification is presented in mean fluorescence intensity (MFI). Analysis was matched for experimental repeat. B. Quantification of lipid peroxidation in BMDM by flow cytometry presented as the reciprocal of the ratio of red (Ex561/Em582)/green (Ex488/Em525) fluorescence intensities normalized to WT PAO1 3 h. C-D. BMDM cell death was measured by flow cytometry and characterized by BMDM cells double positive for annexin V and PI. E-G. Uninfected BMDM were treated with 10 μM of either ferric iron (Fe(III)), pyoverdine (Pvd), ferric-pyoverdine (PvdFe(III)), pyochelin (Pch), or ferric-pyochelin (PchFe(III)) for 6h. Quantification of ROS presented in mean fluorescence intensity (MFI). (E-F). Quantification of lipid peroxidation in BMDM by flow cytometry presented as the reciprocal of the ratio of red (Ex561/Em582)/green (Ex488/Em525) fluorescence intensities (G). n = 3–6 independent replicates for each experiment. *p<0.05, **p<0.01, ***p<0.001, ****p<0.0001. See S5 Table for statistical tests used and exact p-values.
Fig 6
Fig 6. Gallium efficiently inhibits AzEvC10 siderophore production and proliferation during macrophage infection.
A. WT PAO1 and AzEvC10 mutant growth curves in LB broth in the presence or absence of 150 μM gallium. B. BMDM were infected with either WT PAO1 or the AzEvC10 mutant (MOI:100) and treated with different concentrations of gallium for 6 h. BMDM cytotoxicity assessed by LDH assay: #represents the comparisons between WT with gallium to the WT no gallium baseline; *represents the comparisons between AzEvC10 with gallium to AzEvC10 no gallium baseline; $represents the comparisons between AzEvC10 and WT at the same gallium concentration. C-D. BMDM were infected with either WT PAO1 or the AzEvC10 mutant (MOI:100) and treated with 750 μM gallium for 3 h (C) and 6 h (D). Bacterial burden was determined by viable CFU plate counts. Dotted lines represent the initial infection inoculum, 2.5 x 10⁷ CFU/mL. Pyochelin and pyoverdine production was measured by fluorescence (Ex350/Em430 for pyochelin and Ex400/Em460 for pyoverdine) normalized to log10(CFU). E. BMDM were infected with either WT PAO1 or AzEvC10 mutant (MOI:1) and treated with 750 μM gallium for 24 h. Bacterial burden was determined by viable CFU plate counts. Dotted lines represent the initial infection inoculum, 2.5 x 10⁵ CFU/mL. Pyochelin and pyoverdine production was measured by fluorescence (Ex350/Em430 for pyochelin and Ex400/Em460 for pyoverdine) normalized to log10(CFU). n = 6 independent replicates for each experiment. *p<0.05, **p<0.01, ***p<0.001, ****p<0.0001. See S5 Table for statistical tests used and exact p-values.
Fig 7
Fig 7. Virulence and metabolic adaptation are common features of P. aeruginosa pulmonary infections.
A. Schematic representation of the experimental design for RNA and whole genome sequencing of P. aeruginosa clinical isolates. B. Individual expression of iron acquisition genes in CF sputum (n = 12) and in vitro grown clinical isolates (n = 8) expressed in normalized number of reads (TPM) C-D. Expression of selected iron and metabolic genes commonly upregulated by clinical isolates in sputum and by the AzEvC10 mutant during BMDM infection at 3 hpi (C) and 6 hpi (D) (n = 2–5). E. List of non-synonymous mutations detected in the rne gene in P. aeruginosa clinical isolates. F. Representation of the genomic location of rne mutations in clinical isolates. Fisher’s exact test was used to compare the prevalence of mutations in amino-terminal vs carboxy-terminal halves (p<0.0001) (S5 Table).

Similar articles

Cited by

References

    1. Crone S, Vives-Flórez M, Kvich L, Saunders AM, Malone M, Nicolaisen MH, et al.. The environmental occurrence of Pseudomonas aeruginosa. APMIS. 2020;128: 220–231. doi: 10.1111/apm.13010 - DOI - PubMed
    1. Parkins MD, Somayaji R, Waters VJ. Epidemiology, Biology, and Impact of Clonal Pseudomonas aeruginosa Infections in Cystic Fibrosis. Clinical Microbiology Reviews. 2018;31. doi: 10.1128/CMR.00019-18 - DOI - PMC - PubMed
    1. Wheatley R, Diaz Caballero J, Kapel N, de Winter FHR, Jangir P, Quinn A, et al.. Rapid evolution and host immunity drive the rise and fall of carbapenem resistance during an acute Pseudomonas aeruginosa infection. Nat Commun. 2021;12: 2460. doi: 10.1038/s41467-021-22814-9 - DOI - PMC - PubMed
    1. Neupane AS, Willson M, Chojnacki AK, Vargas E Silva Castanheira F, Morehouse C, Carestia A, et al.. Patrolling Alveolar Macrophages Conceal Bacteria from the Immune System to Maintain Homeostasis. Cell. 2020;183: 110–125.e11. doi: 10.1016/j.cell.2020.08.020 - DOI - PubMed
    1. Manicone AM, Birkland TP, Lin M, Betsuyaku T, van Rooijen N, Lohi J, et al.. Epilysin (MMP-28) Restrains Early Macrophage Recruitment in Pseudomonas aeruginosa Pneumonia. J Immunol. 2009;182: 3866–3876. doi: 10.4049/jimmunol.0713949 - DOI - PMC - PubMed

Publication types