. 2023 Apr 14;8(82):eade8162.
doi: 10.1126/sciimmunol.ade8162. Epub 2023 Apr 7.

Human T follicular helper clones seed the germinal center-resident regulatory pool

Affiliations

Human T follicular helper clones seed the germinal center-resident regulatory pool

Carole Le Coz et al. Sci Immunol. .

Abstract

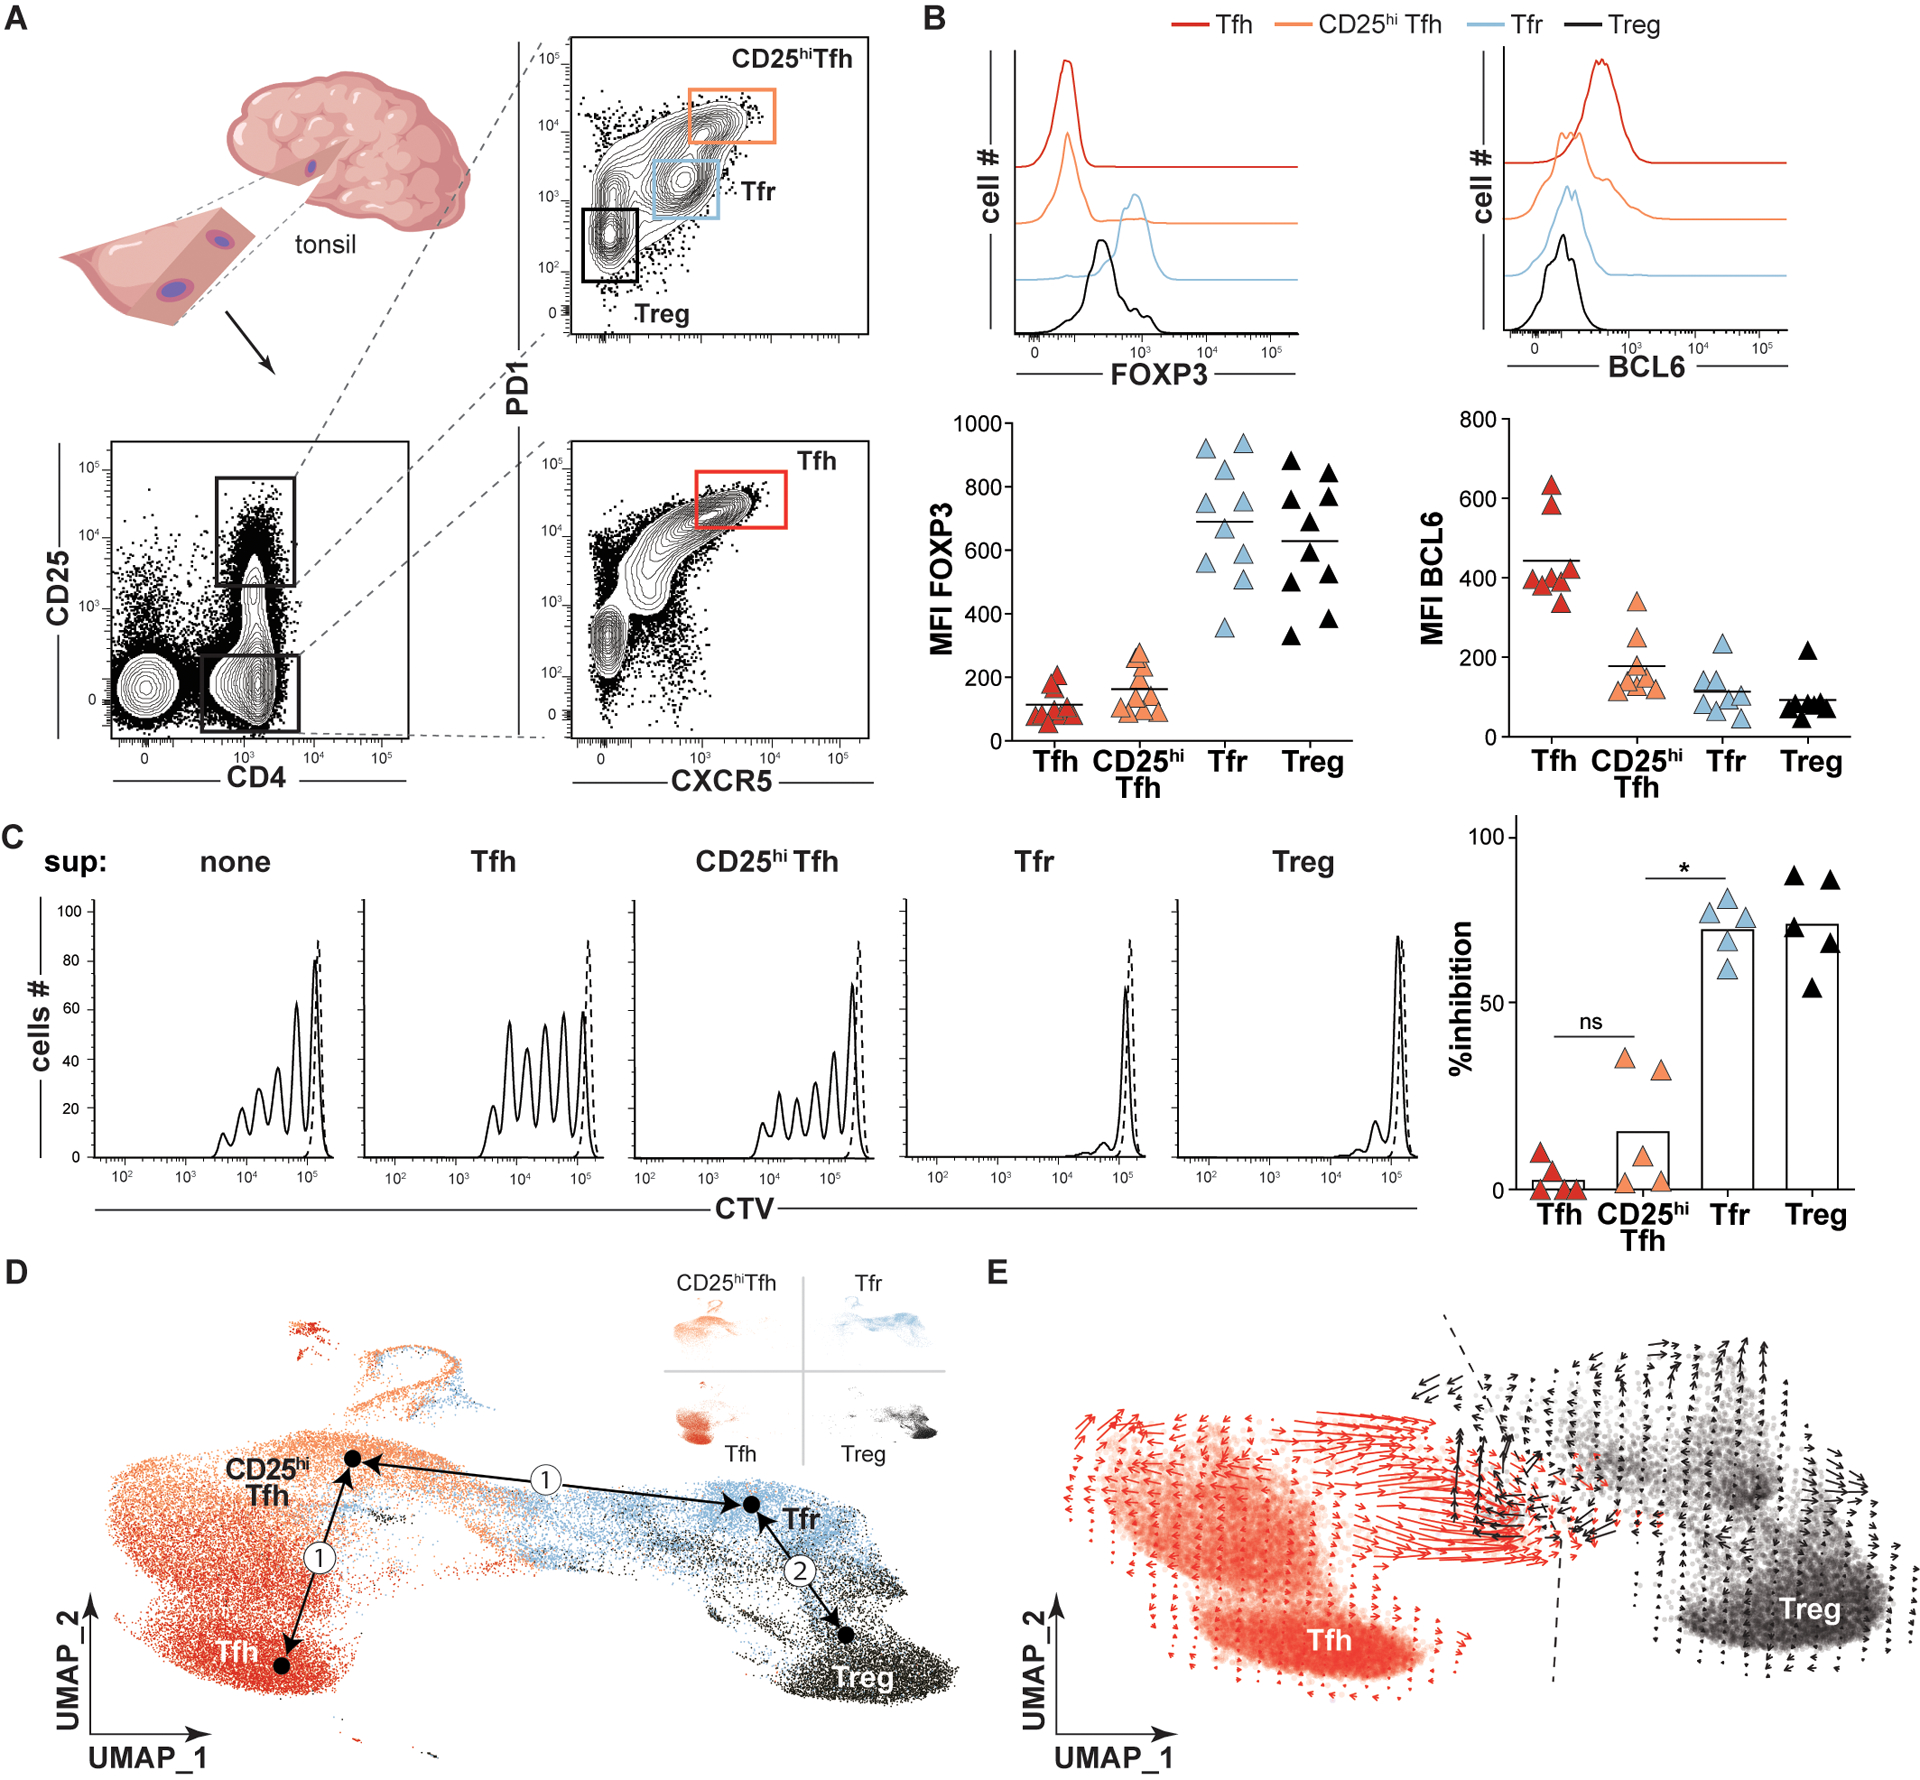
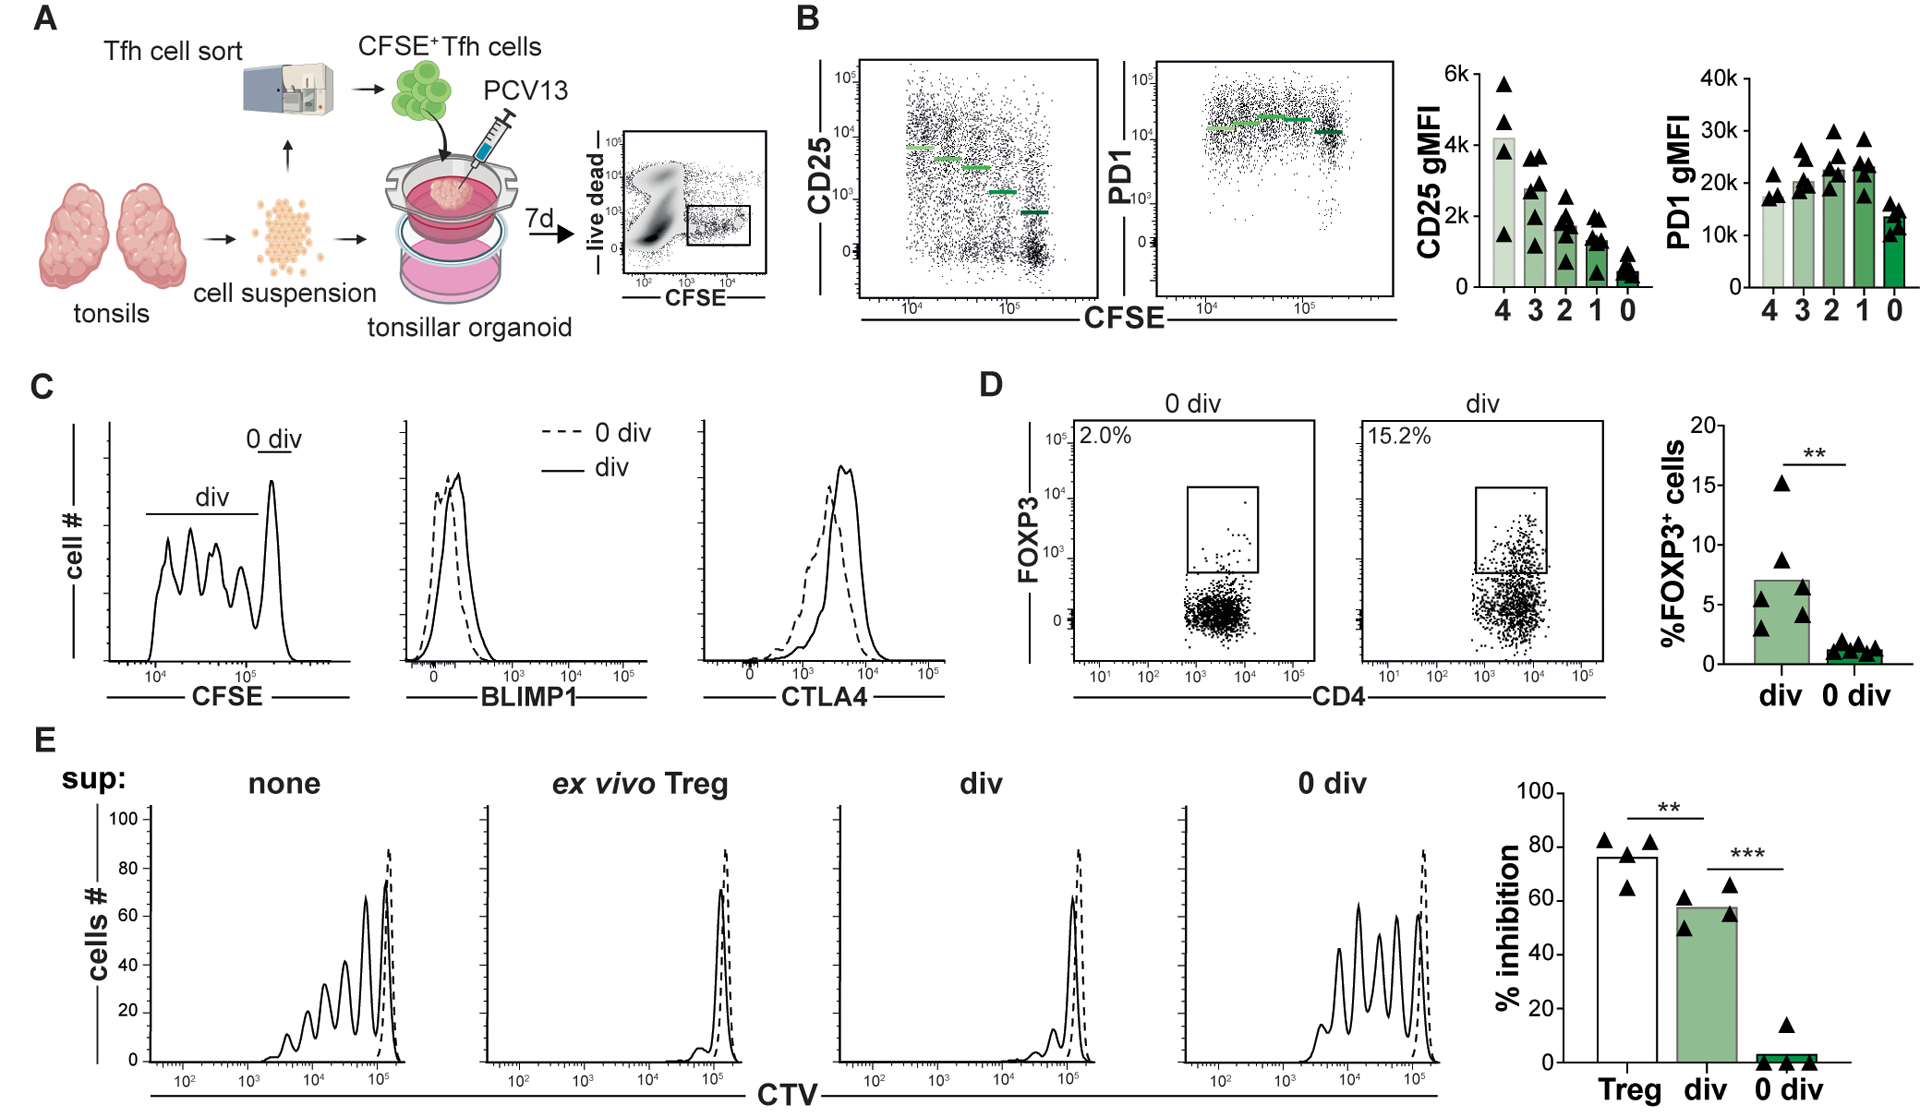
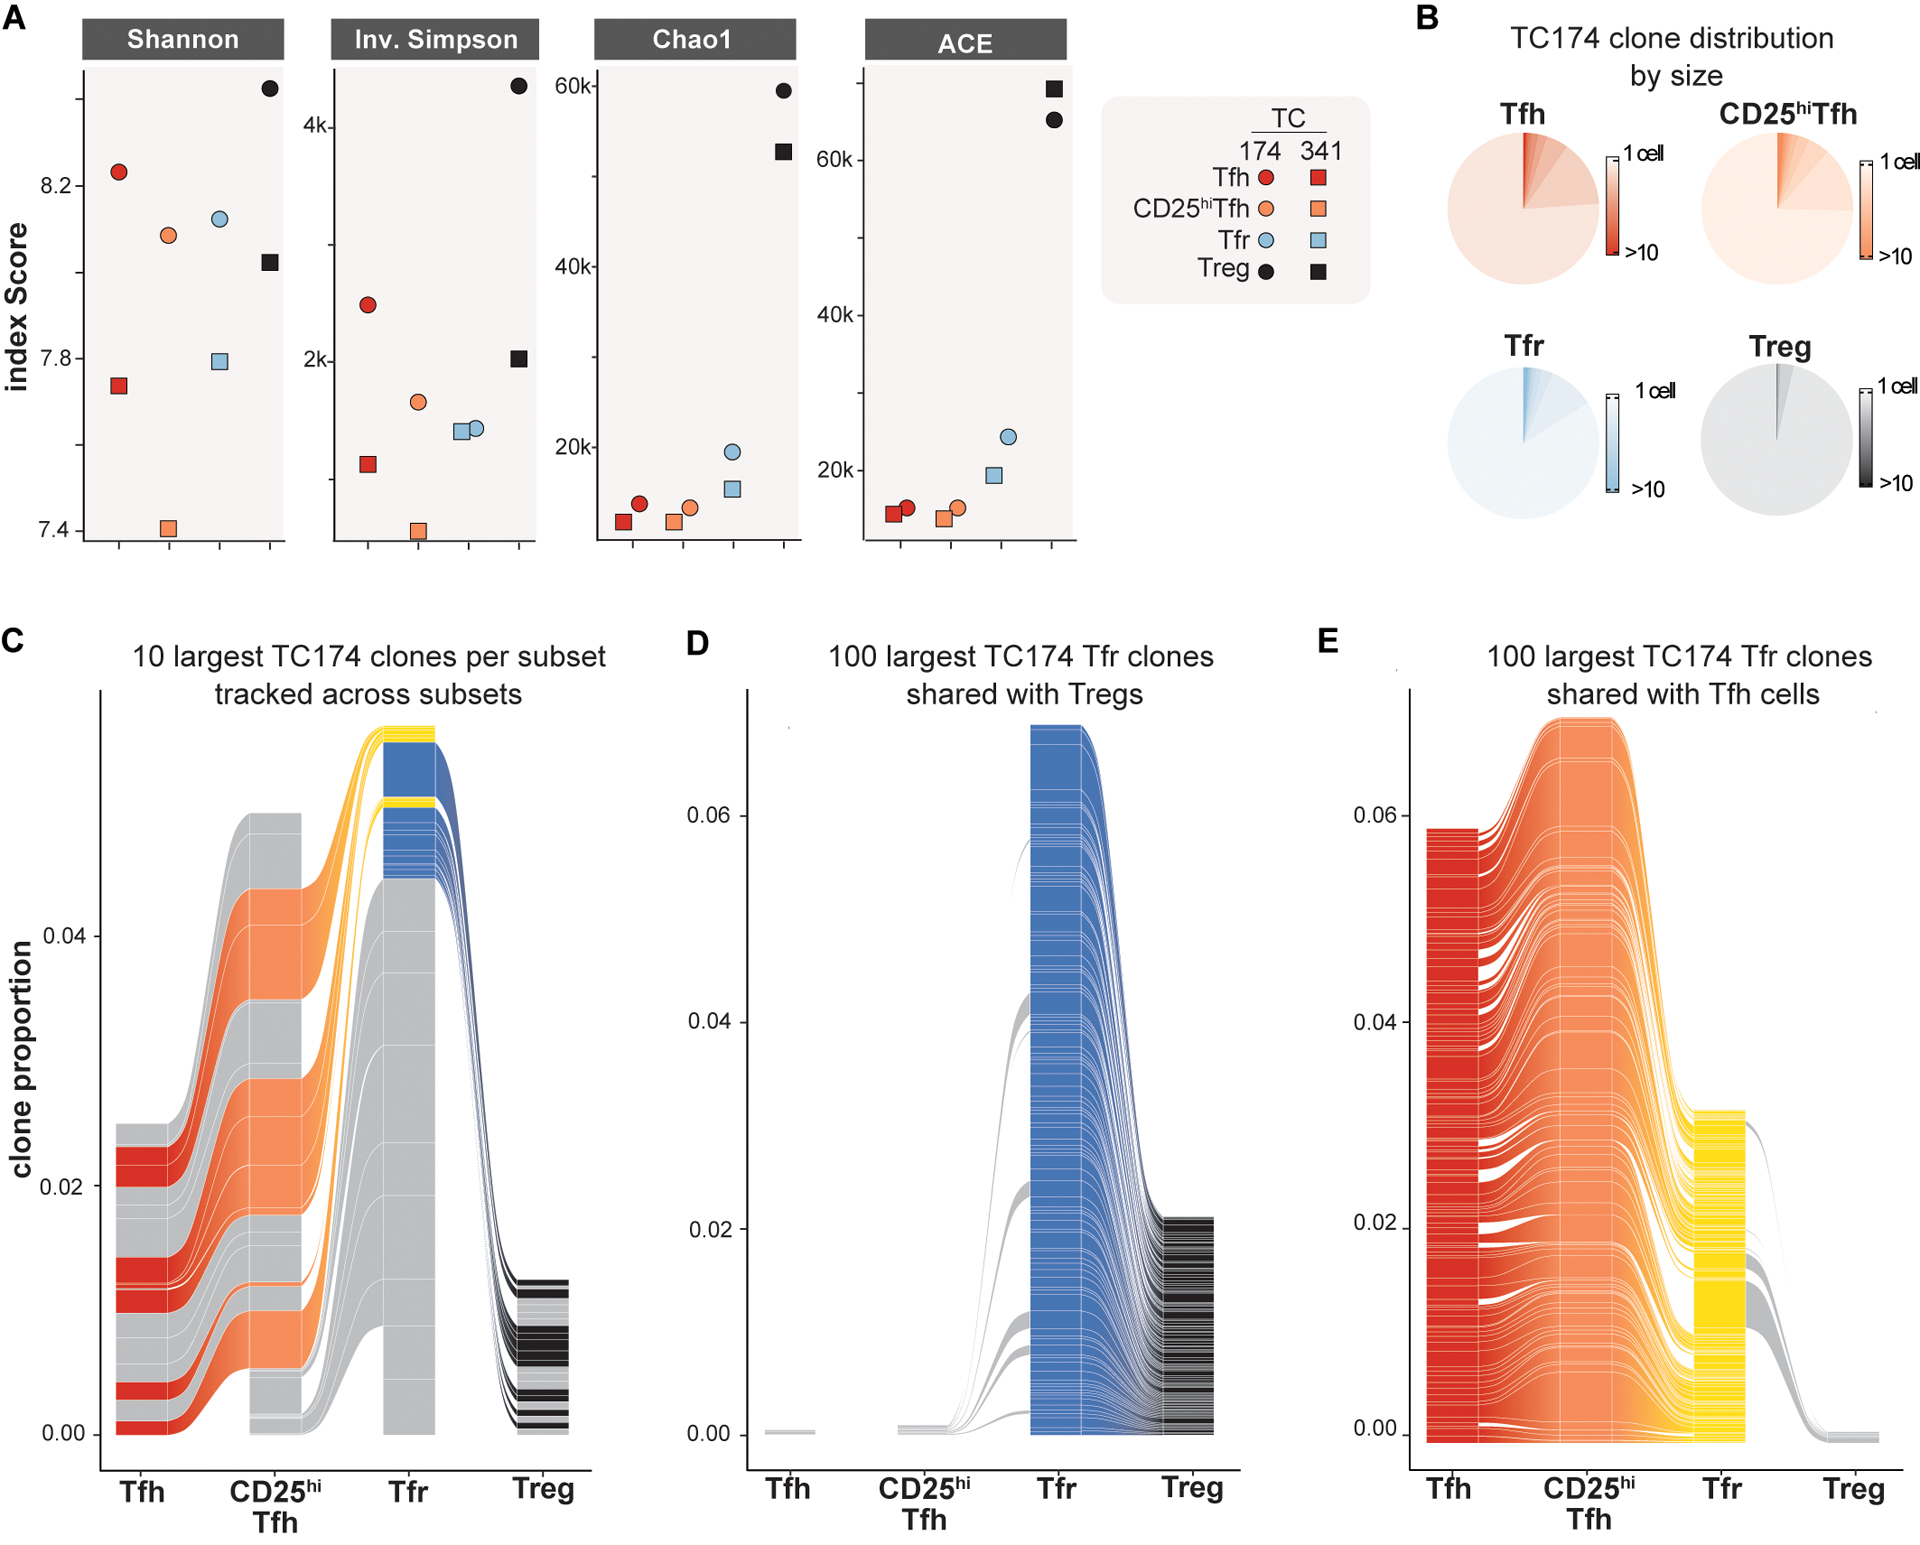
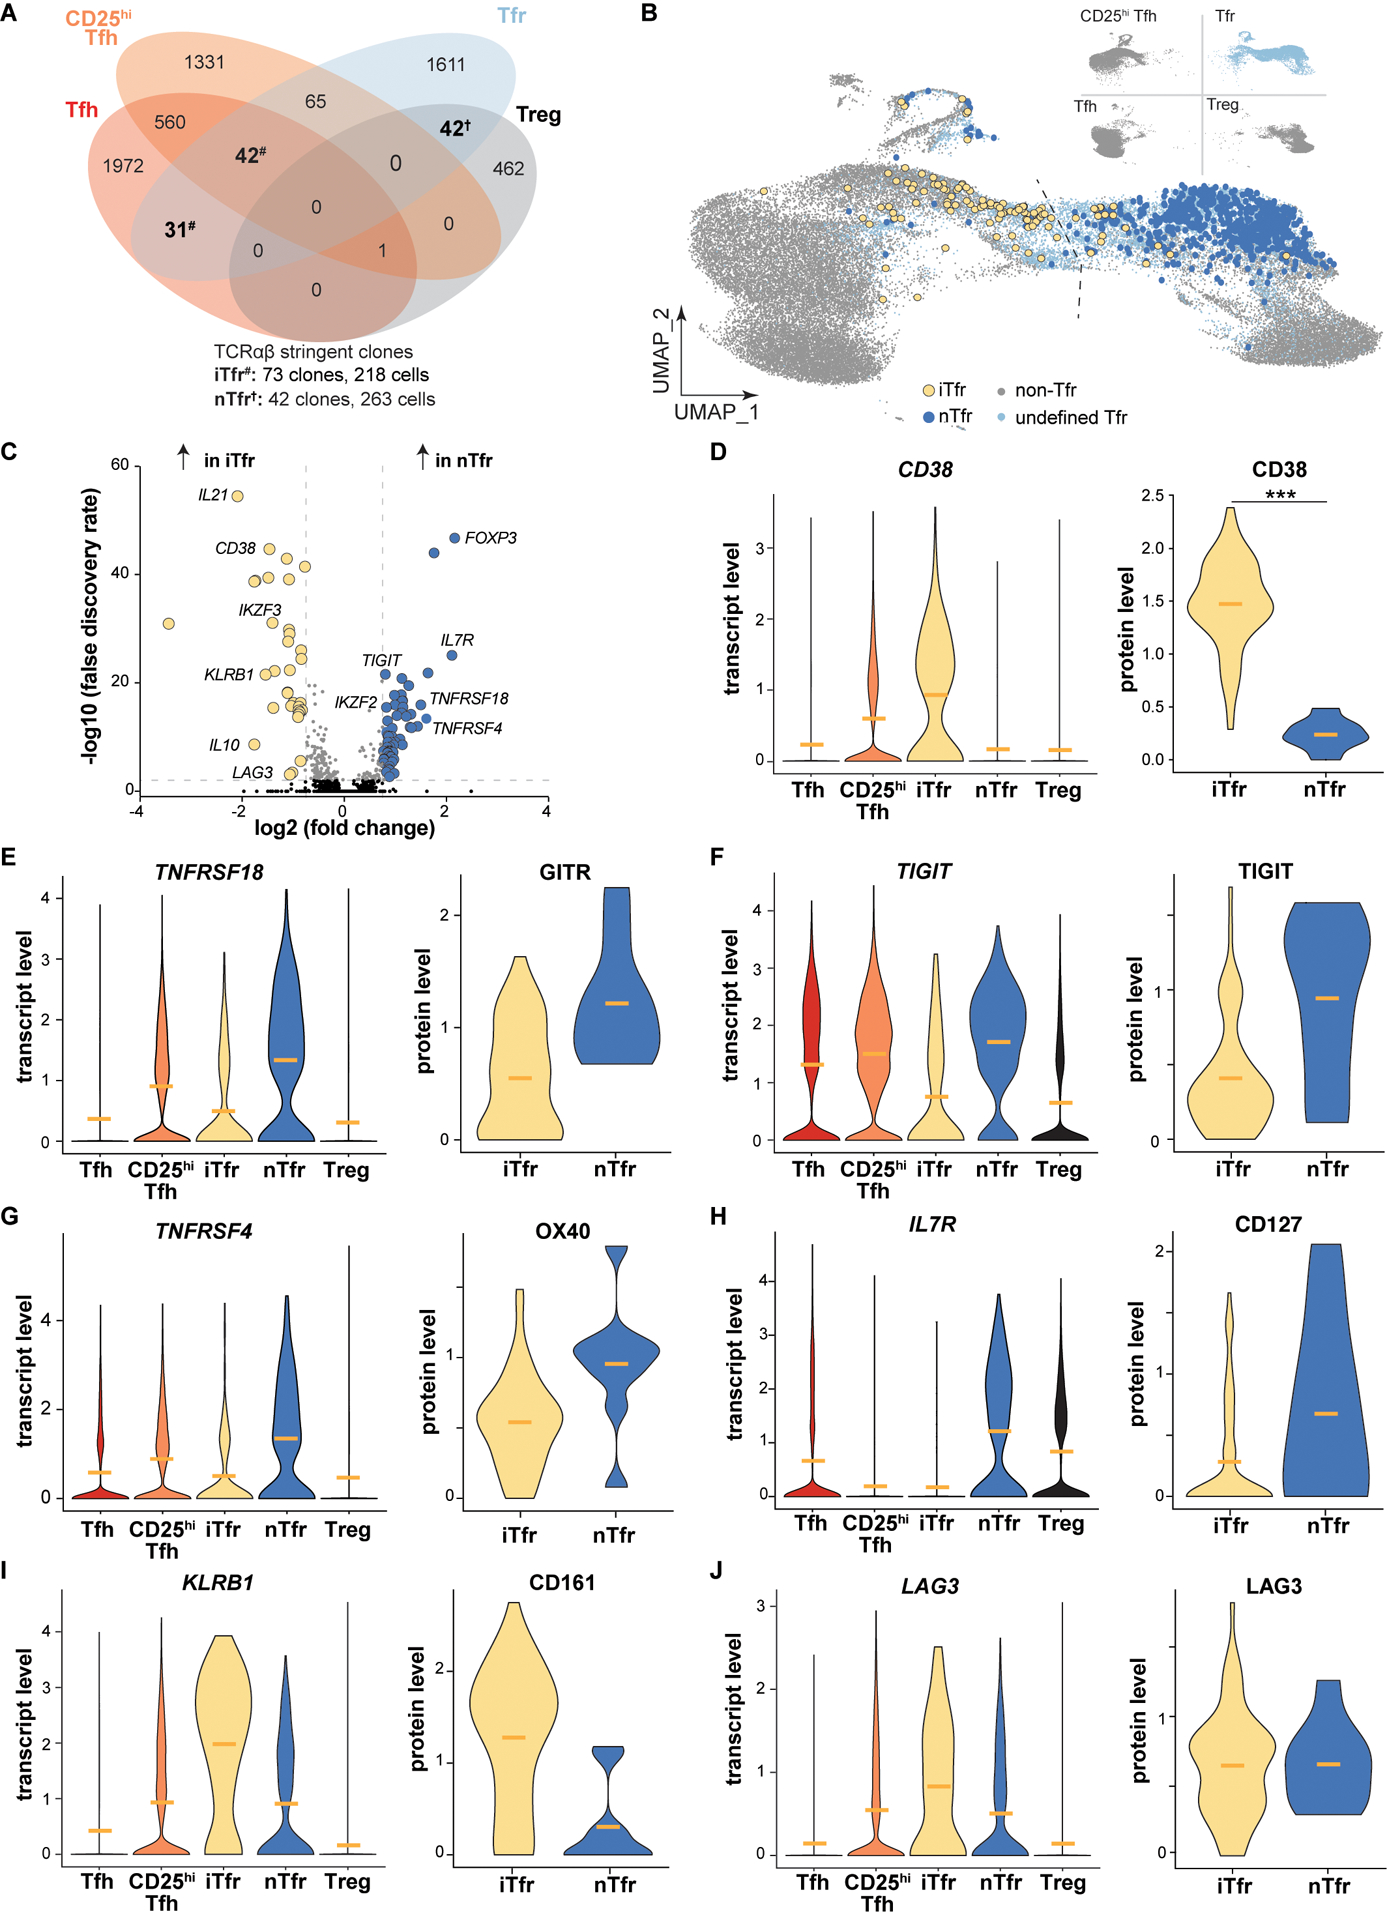
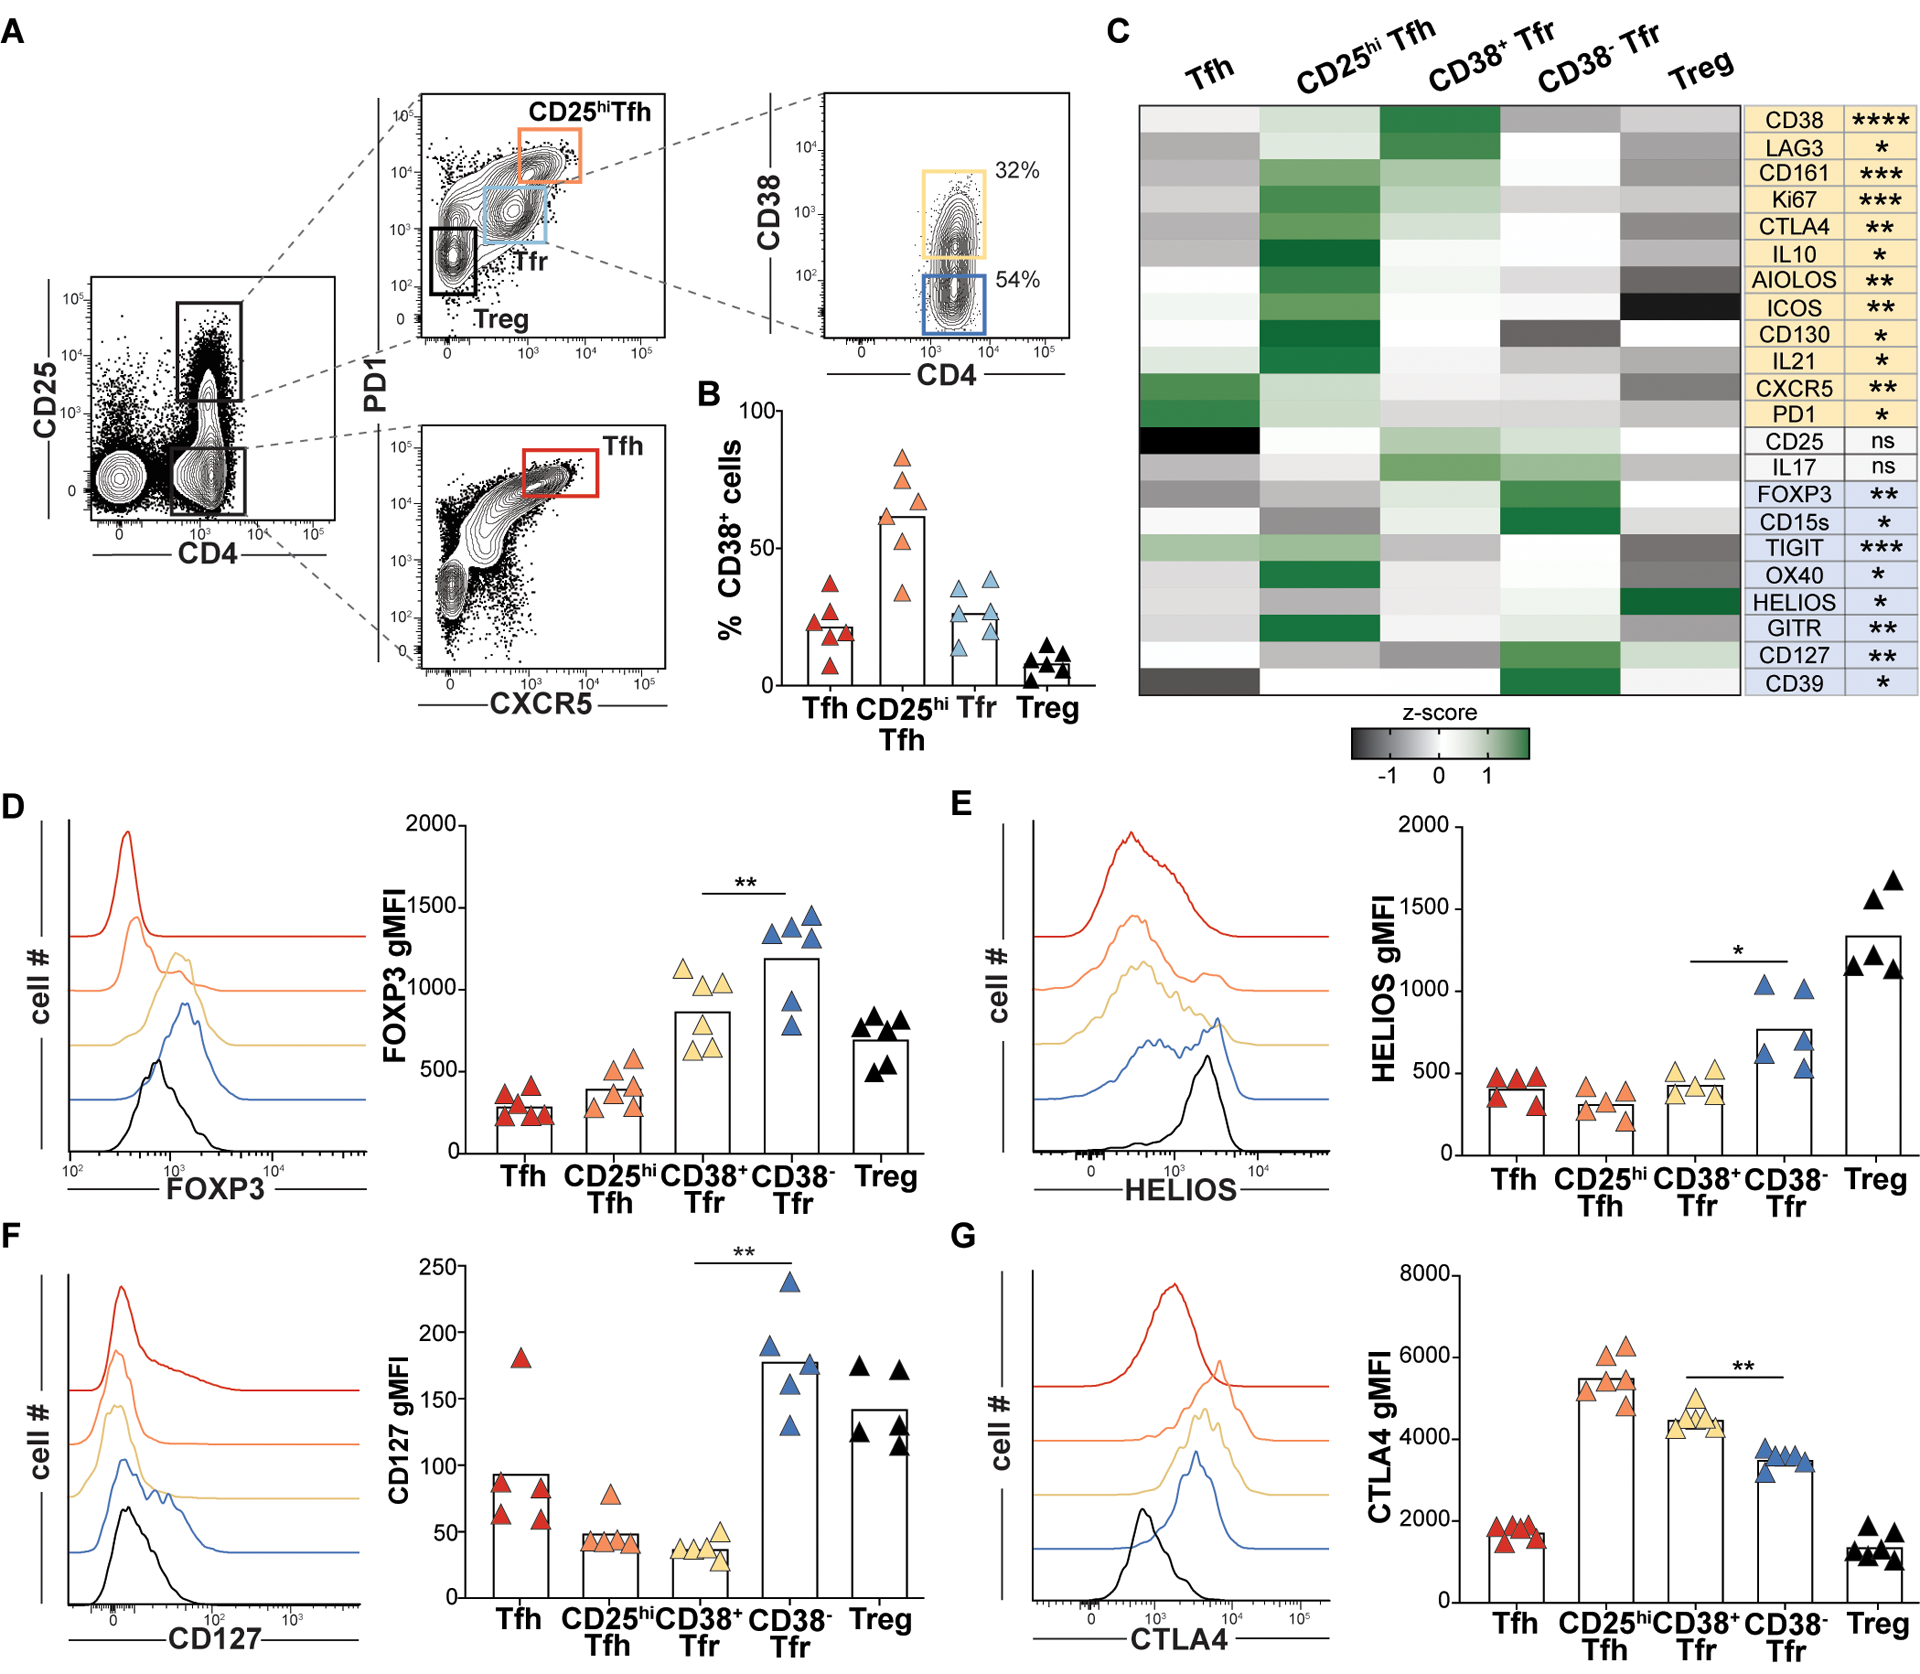
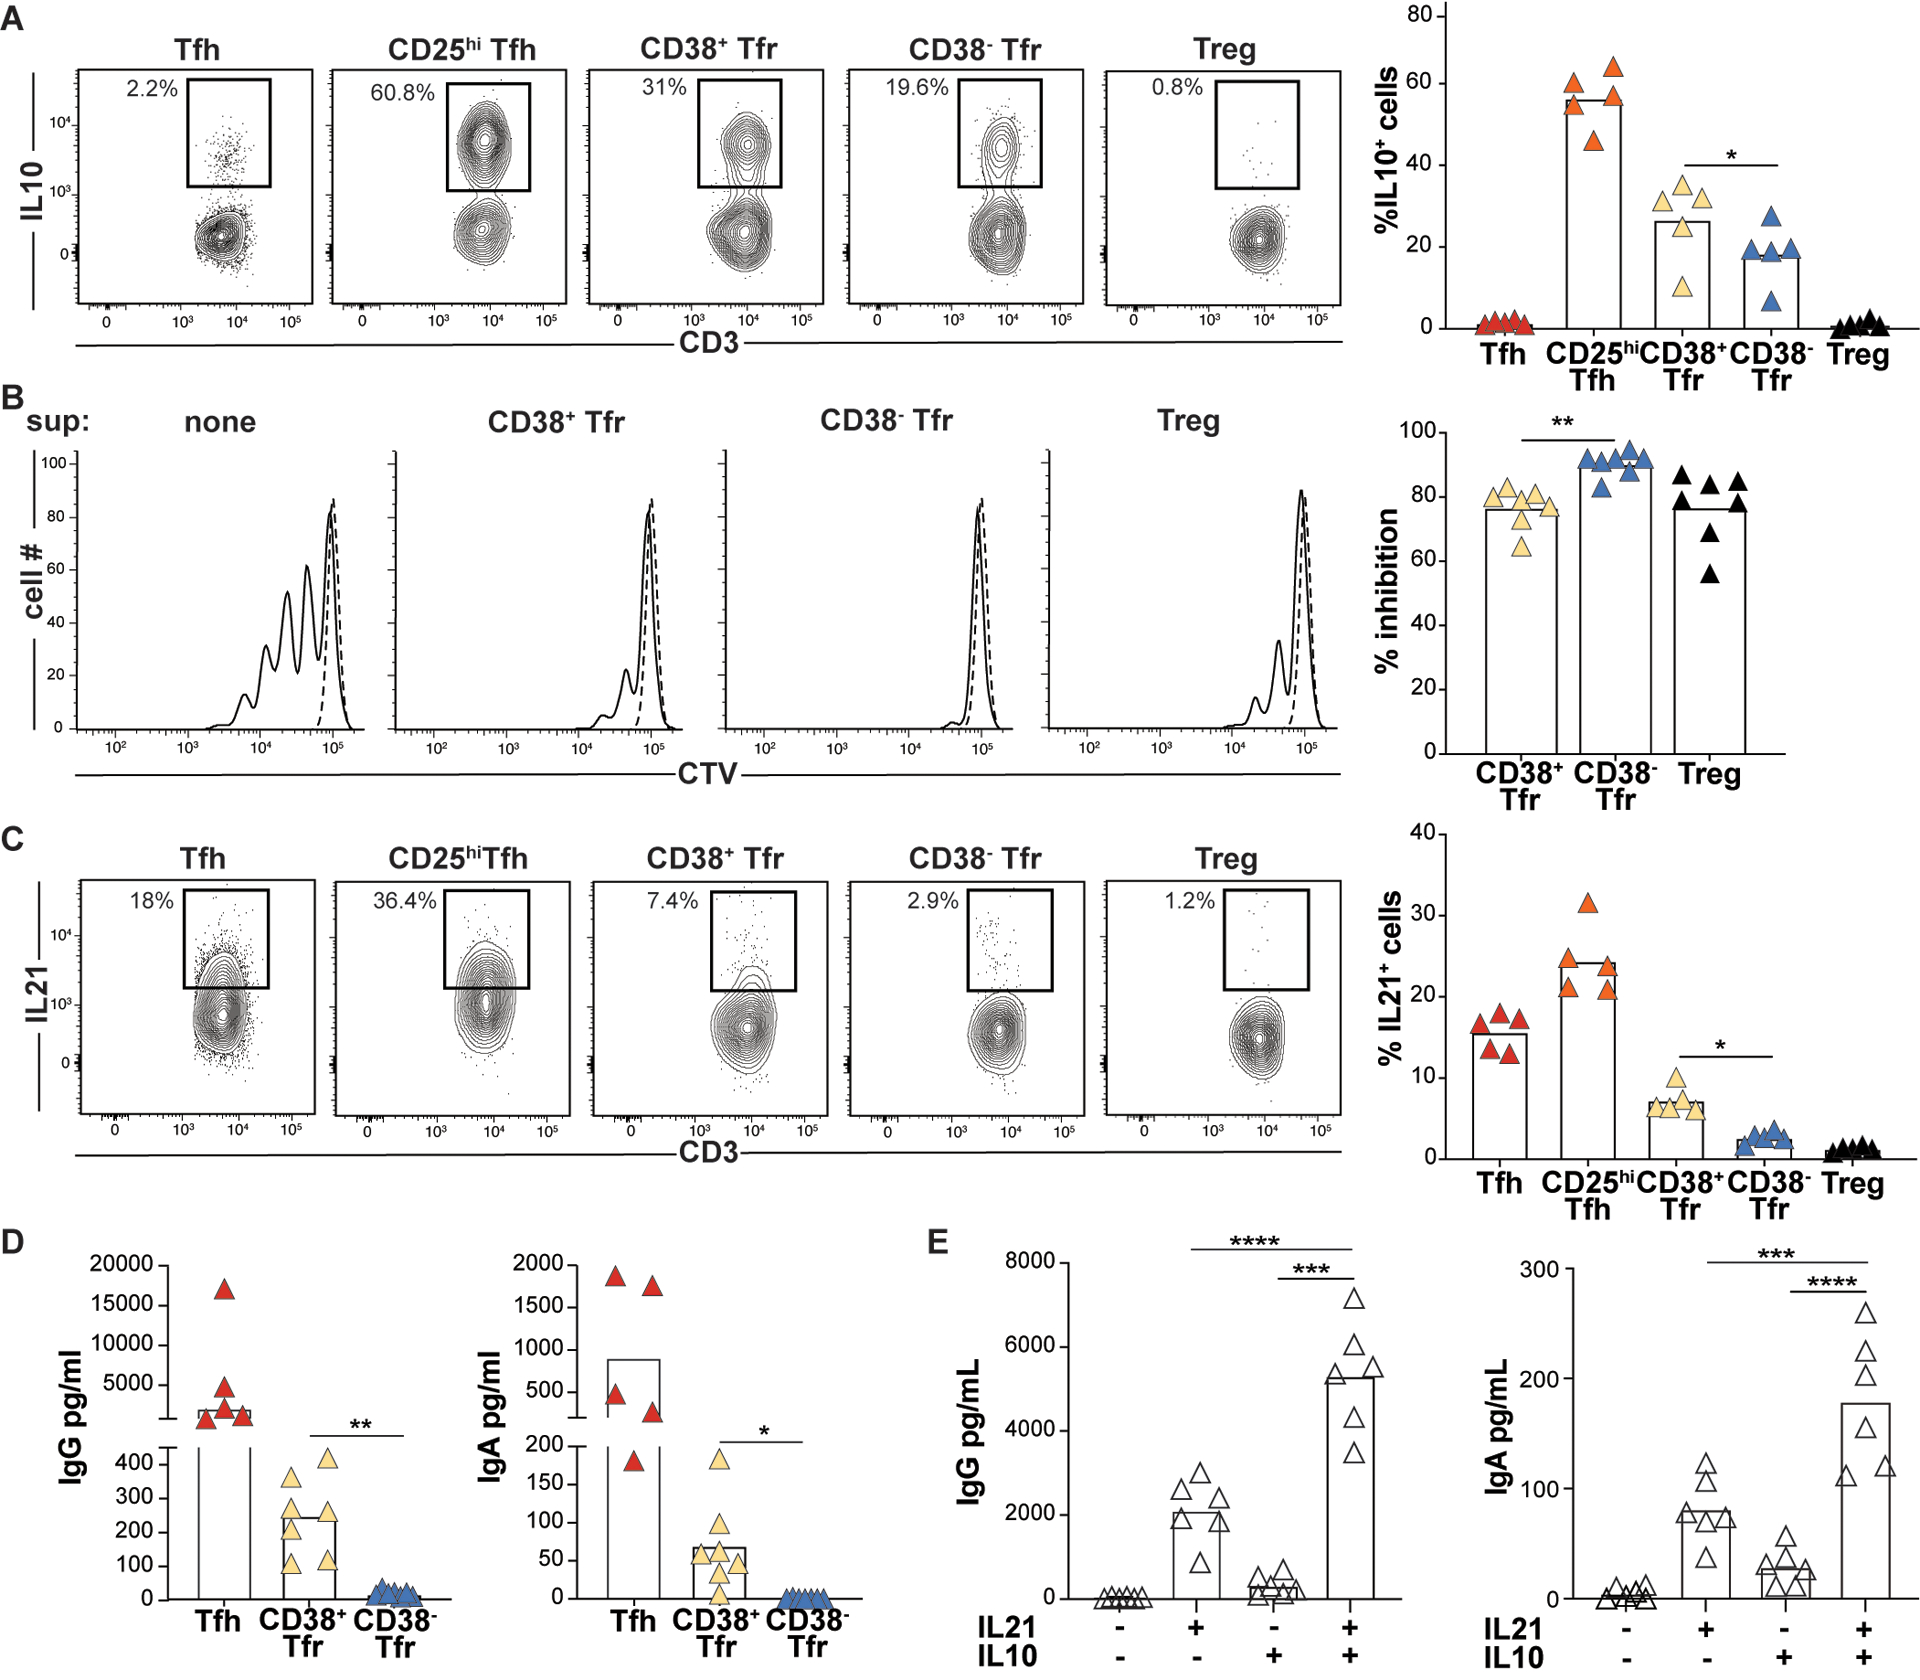
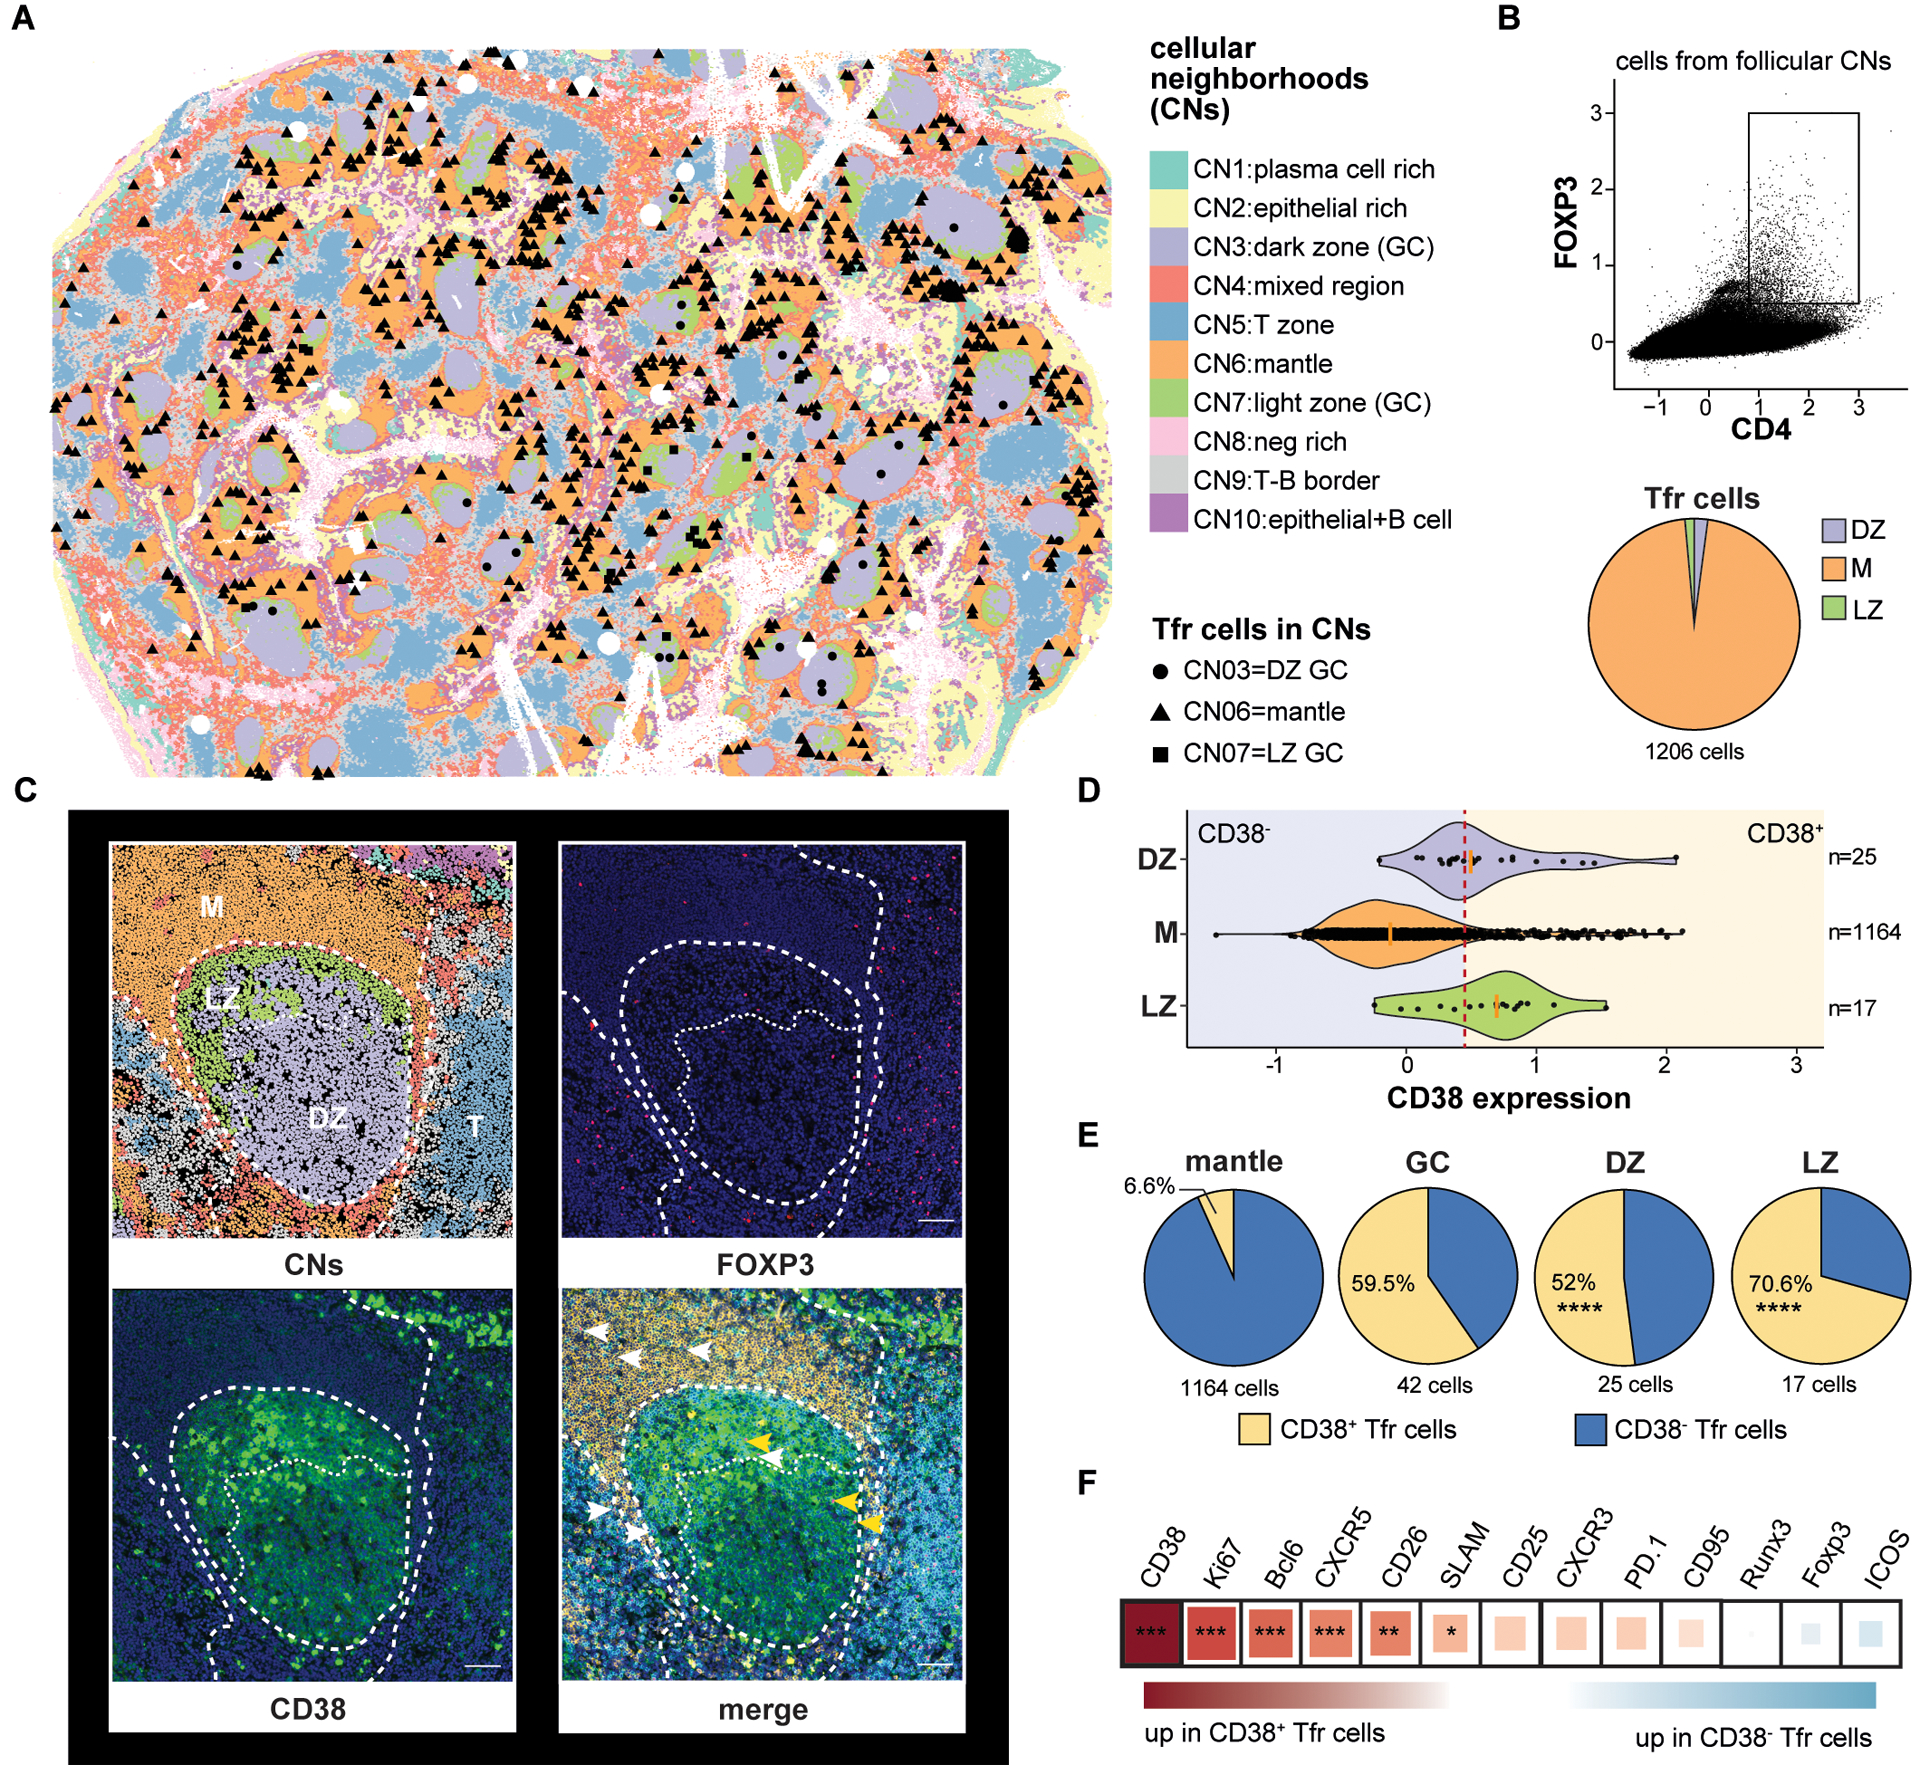
The mechanisms by which FOXP3+ T follicular regulatory (Tfr) cells simultaneously steer antibody formation toward microbe or vaccine recognition and away from self-reactivity remain incompletely understood. To explore underappreciated heterogeneity in human Tfr cell development, function, and localization, we used paired TCRVA/TCRVB sequencing to distinguish tonsillar Tfr cells that are clonally related to natural regulatory T cells (nTfr) from those likely induced from T follicular helper (Tfh) cells (iTfr). The proteins iTfr and nTfr cells differentially expressed were used to pinpoint their in situ locations via multiplex microscopy and establish their divergent functional roles. In silico analyses and in vitro tonsil organoid tracking models corroborated the existence of separate Treg-to-nTfr and Tfh-to-iTfr developmental trajectories. Our results identify human iTfr cells as a distinct CD38+, germinal center-resident, Tfh-descended subset that gains suppressive function while retaining the capacity to help B cells, whereas CD38- nTfr cells are elite suppressors primarily localized in follicular mantles. Interventions differentially targeting specific Tfr cell subsets may provide therapeutic opportunities to boost immunity or more precisely treat autoimmune diseases.


Conflict of interest statement

Competing Interests:

EJW is a member of the Parker Institute for Cancer Immunotherapy which supported this study. EJW is an advisor for Danger Bio, Marengo, Janssen, Pluto Immunotherapeutics Related Sciences, Rubius Therapeutics, Synthekine, and Surface Oncology. EJW is a founder of and holds stock in Surface Oncology, Danger Bio, and Arsenal Biosciences.

Figures

Figure 1.
Figure 1.. In silico models predict Tfh and Treg cells each contribute to the Tfr pool.
(A) A strategy to sort Tfh (CD4+CD25CXCR5hiPD1hi, red), CD25hiTfh (CD4+CD25hiCXCR5hiPD1hi, orange), Tfr (CD4+CD25hiCXCR5+PD1int, light blue), and Treg (CD4+CD25hiCXCR5PD1, black) cell subsets from a small tonsil wedge is depicted. (B) Histograms and plots display FOXP3 and BCL6 mean fluorescence intensities (MFIs) on indicated T- cell subsets from a representative and all tonsil donors (n=8–10). (C, left) Representative histograms of CTV-labeled T-cell responders stimulated (solid line) or not (dashed line) in coculture with indicated heterologous tonsillar T-cell “suppressor” (sup) subsets are displayed. Bar graph (right) represents mean percent inhibition relative to unstimulated Tresp cells (n=5). (D) Dimensionally reduced single cell RNA-sequencing of TC174 T cell subsets are displayed as a UMAP. Pseudotime cell ordered projections (black arrows) identify two Tfr developmental arcs, () to CD25hiTfh and Tfh cells, () to Tregs. (E) RNA velocity vectors of only Tfh and Treg cells from TC174 are displayed. An arbitrary dashed centerline denotes convergence. *, P<0.05 by one-way ANOVA.
Figure 2.
Figure 2.. Tonsillar organoids model Tfh to Tfr cell development.
(A) A strategy to track Tfh to Tfr cell development within tonsillar organoids that are activated with pneumococcal conjugated vaccine 13 serotypes (PCV13) is depicted. (B) Day 7 CD25, PD1, (C) BLIMP1, CTLA4 and (D) FOXP3 expression by divided (div) and non-divided (0 div) Tfh cells are displayed. Green bards and horizontal lines indicate mean values (n=6) (E, left) Representative histograms show CTV-labeled T-cell responders (Tresp, CD45ROCD25CD4+ T cells) stimulated (solid line) or not (dashed line) in co-culture with either ex vivo Treg cells, or Tfh cells from day 7 organoids that were CD25+CFSEdim or CD25CFSEbright. Bar graph (right) represents mean percent inhibition relative to unstimulated (n=5). **, P<0.01; ***, P<0.001 by Mann-Whitney U tests (D) and one-way ANOVA (E).
Figure 3.
Figure 3.. The tonsillar Tfr pool overlaps with clonally diverse Tregs and clonally expanded Tfh/CD25hiTfh cells.
(A) TCRA/TCRB repertoire diversities of Tfh, CD25hiTfh, Tfr and Treg subsets from TC174 and TC341 are measured by indicated indices. (B) Pie charts indicate subset-specific clone size distributions (cells per clone) for TC174. (C) The ten largest clones per TC174 subset are tracked across other subsets. (D) The 100 largest clones shared between TC174 Tfr and Tfh cells and (E) between TC174 Tfr and Tregs are tracked across other subsets. Tfr clones shared with Tfh or Treg subset cells are shaded yellow and royal blue, respectively. Tfh, CD25hiTfh and Treg clones not shared with the Tfr subset and Tfr clones not shared with Tfh or Treg subsets are shaded gray. More than 10 clones (C) or 100 clones (D and E) per subset are displayed to account for ranking ties and clone sharing across subsets.
Figure 4.
Figure 4.. Transcriptomes of stringently defined iTfr and nTfr cells diverge, with cell type origin predicted by CD38/CD38 expression.
(A) Venn diagram displays overlapping TC174 stringent clones, defined as a clone with ≥2 cells. #, iTfr stringent clones; †, nTfr stringent clones. (B) Positions of stringent TC174 iTfr and nTr cells are displayed overlying a UMAP plot. (C) A volcano plot shows genes differentially expressed between stringently defined iTfr and nTfr cells pooled from TC174 and TC341. (D-J) Violin plots display differential expression of pooled transcripts and corresponding cell surface protein expression on TC341 subsets. Horizontal bars indicate mean values. ***, P<0.001 by Wilcoxon rank sum test with Bonferroni correction for protein expression comparisons.
Figure 5.
Figure 5.. Variable CD38 expression predicts distinct and larger Tfr cell immunophenotypes.
(A) Tfr expression of CD38 from a representative tonsil donor and (B) Indicated T cell CD38 expression frequencies for 6 pediatric tonsil donors. (C) A heat map displays geometric mean fluorescence intensity (gMFI) z-scores associated by T cell subsets from 6 donors. Proteins differentially upregulated in CD38+Tfr (yellow) and CD38Tfr cells (blue) are shaded. (D-G) Histograms display gMFIs of indicated proteins by T cell subsets from a representative tonsil donor and bar graphs show gMFIs for 5–6 tonsil donors. *, P<0.05; **, P<0.01; ***, P<0.001; ****, P<0.0001 by one-way ANOVA.
Figure 6.
Figure 6.. CD38+Tfr cells provide germinal center B cell help, while CD38Tfr cells are elite suppressors.
(A) Frequencies of PMA/ionomycin-activated T-subsets expressing IL10 are shown for a representative donor (left) and all available donors (n=5, right). (B) Day 4 Tresp cell proliferation with and without indicated T cell “suppressor” (sup) subsets from a representative donor (left) and all available donors (n=7, right) (C) Frequencies of PMA/ionomycin-activated T-subsets expressing IL21 are shown for a representative donor (left) and all available donors (n=5, right). *, P<0.05; by One-Way ANOVA. Day 7 IgG and IgA supernatant concentrations from GC B cells (D) co-cultured with either Tfh cells, CD38+ or CD38Tfr cells stimulated with anti-CD3/CD28 beads (n=5) or (E) cultured alone with megaCD40L, recombinant IL21 and/or recombinant IL10 treatment (n=7). *, P<0.05; **, P<0.01; ***, P<0.001 by one-way ANOVA.
Figure 7.
Figure 7.. Multiplex imaging identifies CD38+Tfr cells principally within tonsil germinal centers.
(A) A CODEX-stained human tonsil section is portioned into cell neighborhoods (CNs) and the locations of CD4+FOXP3+ cells in the dark zone (CN3), mantle (CN6), and light zone (CN7) are marked. (B) A CD4+FOXP3+ gate and the proportion of gated cells in each follicular CN is shown. (C) A representative tonsil GC with CNs, FOXP3 (pink) staining, CD38 (green) staining, and CD4 (cyan), IgD (orange), CD38, and FOXP3 overlaid. CD38+ (yellow arrow heads) and CD38 Tfr cells (white arrows heads) positions are indicated (D) Violin plots indicate CD38 expression distribution on CD4+FOXP3+ cells from different CNs. A red dashed line indicates the expression threshold above which Tfr cells were considered CD38+. (E) Proportions of CD38 expressing subsets in indicated follicular CNs. (F) Differential protein expression by CD38+ and CD38Tfr subsets. Square size and color indicate fold change difference and direction, respectively, by Spearman correlation R coefficient. *, P<0.05 **, P<0.01 ***, P<0.001, ****, P<0.0001 by unpaired Wilcoxon tests or Chi-squared test. Scale bar 200-pixel=64.5μm. DZ, dark zone; LZ, light zone; M, mantle; T, T cell zone.

Comment in

References

    1. Victora GD, Nussenzweig MC, Germinal centers. Annu. Rev. Immunol 30, 429–457 (2012). - PubMed
    1. Zhang Y, Meyer-Hermann M, George LA, Figge MT, Khan M, Goodall M, Young SP, Reynolds A, Falciani F, Waisman A, Notley CA, Ehrenstein MR, Kosco-Vilbois M, Toellner K-M, Germinal center B cells govern their own fate via antibody feedback. J. Exp. Med 210, 457–464 (2013). - PMC - PubMed
    1. Stebegg M, Kumar SD, Silva-Cayetano A, Fonseca VR, Linterman MA, Graca L, Regulation of the Germinal Center Response. Front. Immunol 9, 2469 (2018). - PMC - PubMed
    1. Fu W, Liu X, Lin X, Feng H, Sun L, Li S, Chen H, Tang H, Lu L, Jin W, Dong C, Deficiency in T follicular regulatory cells promotes autoimmunity. J. Exp. Med 215, 815–825 (2018). - PMC - PubMed
    1. Gonzalez-Figueroa P, Roco JA, Papa I, Núñez Villacís L, Stanley M, Linterman MA, Dent A, Canete PF, Vinuesa CG, Follicular regulatory T cells produce neuritin to regulate B cells. Cell 184, 1775–1789.e19 (2021). - PubMed

Publication types

LinkOut - more resources