

Inhibitory and excitatory alcohol-seeking cues distinct roles in behavior, neurochemistry, and mesolimbic pathway in alcohol preferring (P) rats
- PMID: 37028106
- PMCID: PMC10212692
- DOI: 10.1016/j.drugalcdep.2023.109858
Inhibitory and excitatory alcohol-seeking cues distinct roles in behavior, neurochemistry, and mesolimbic pathway in alcohol preferring (P) rats
Abstract
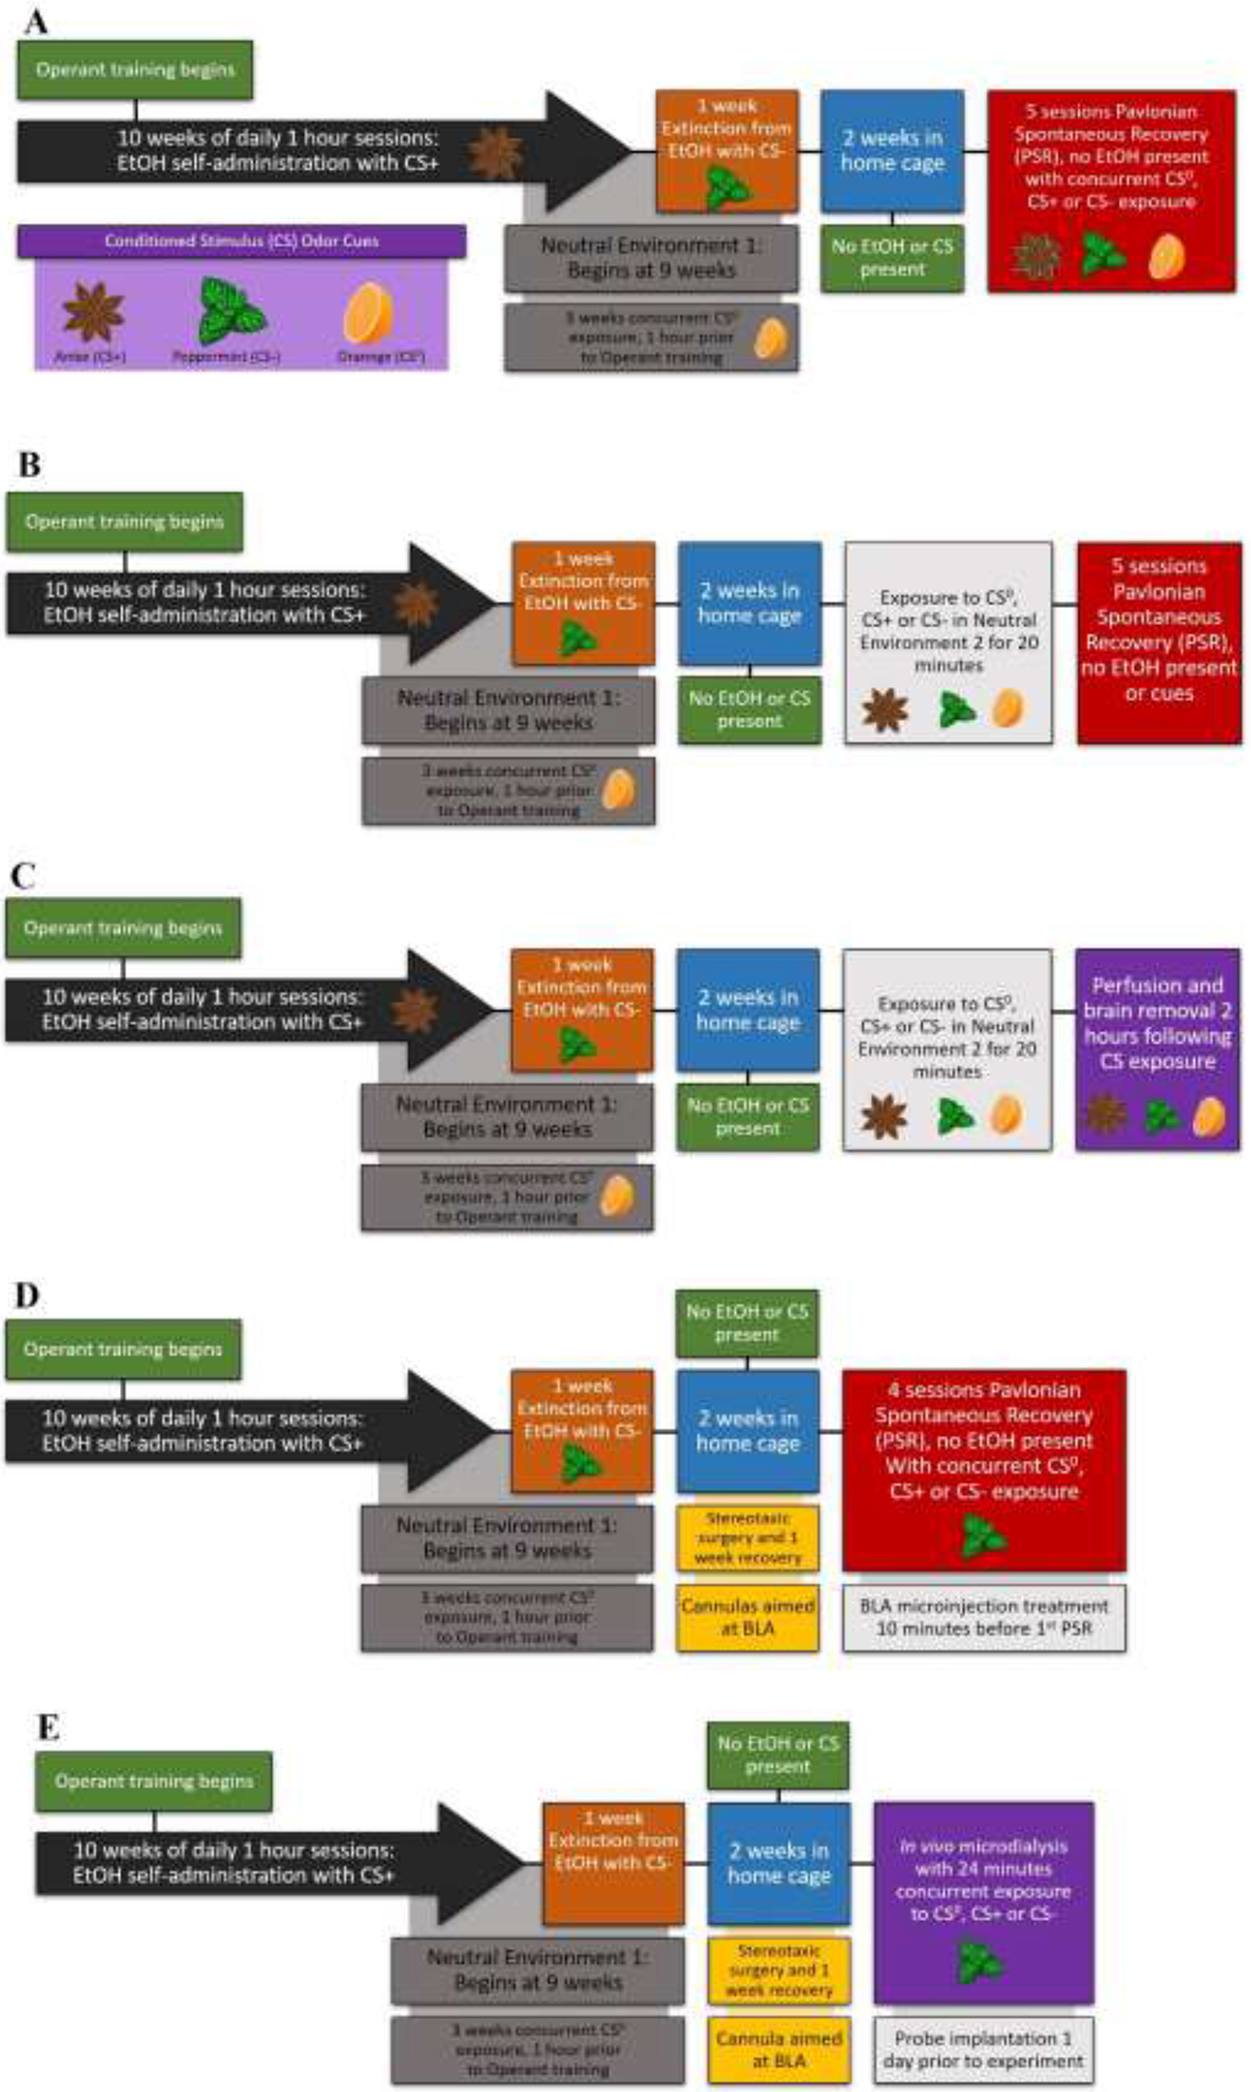
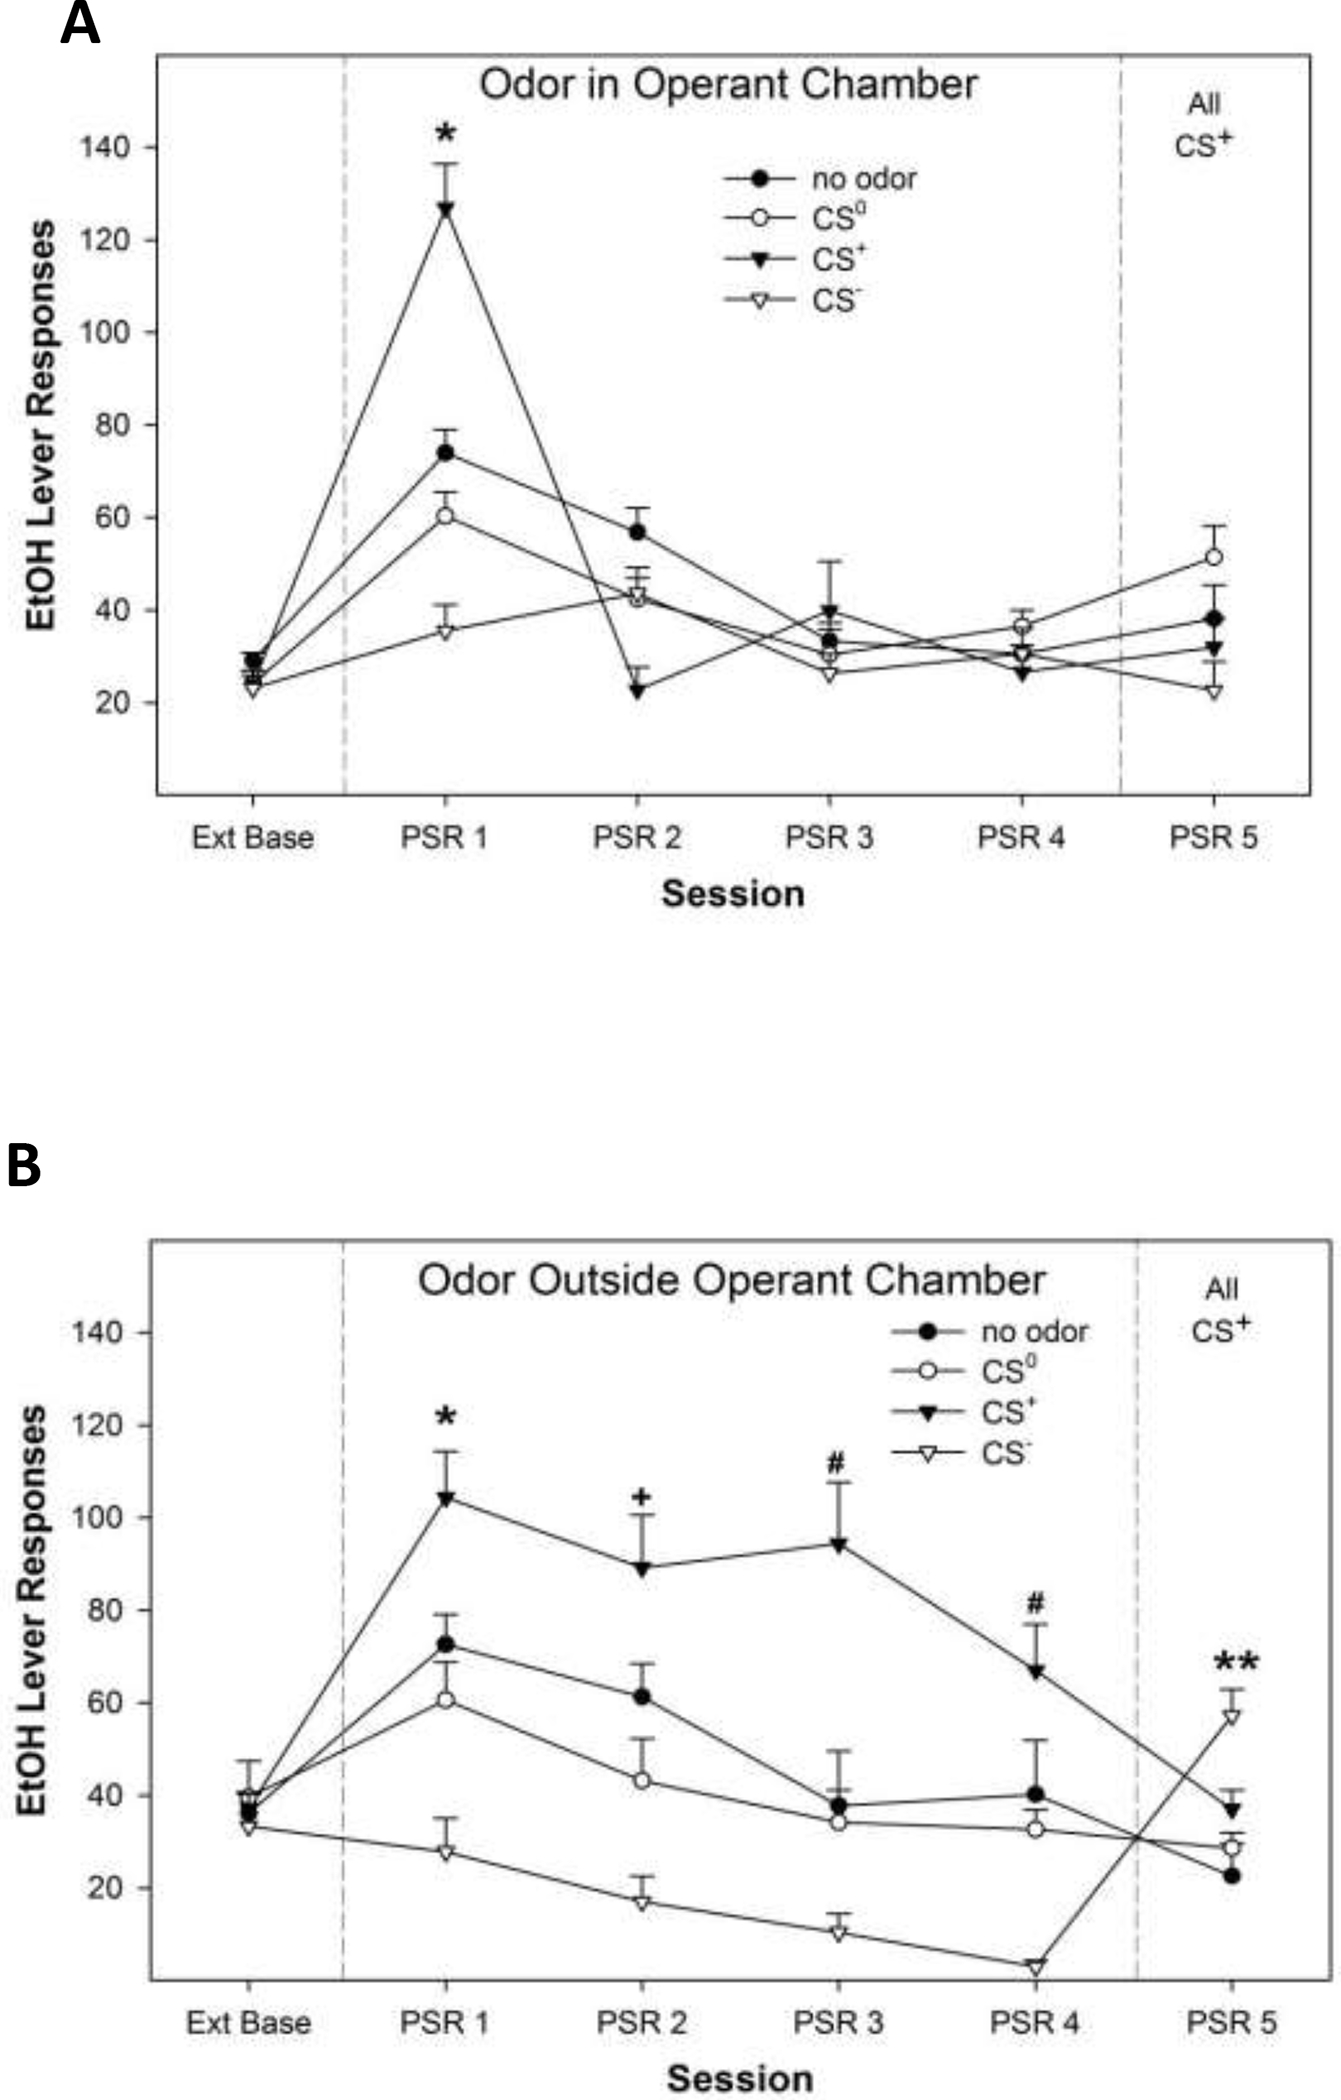
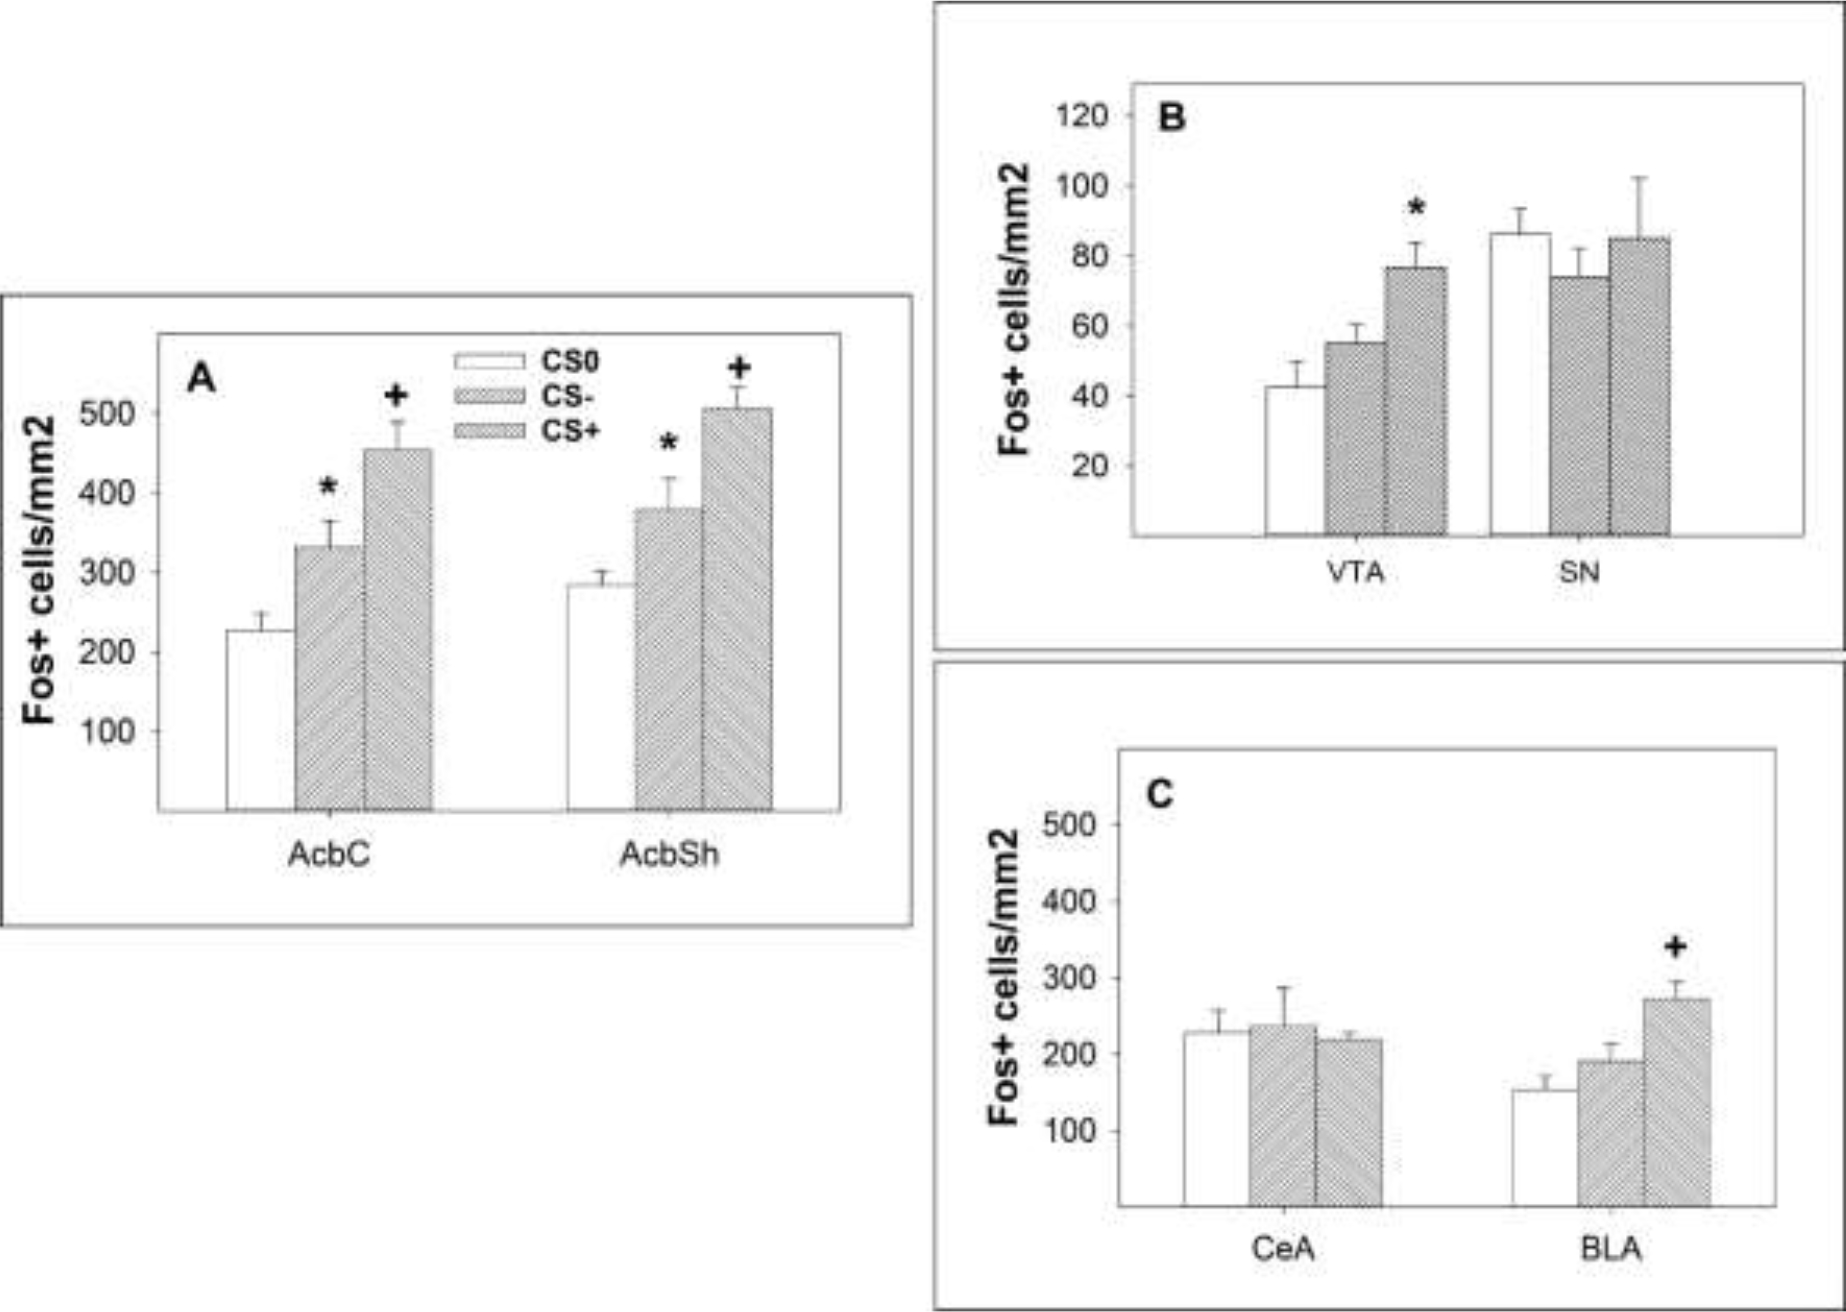
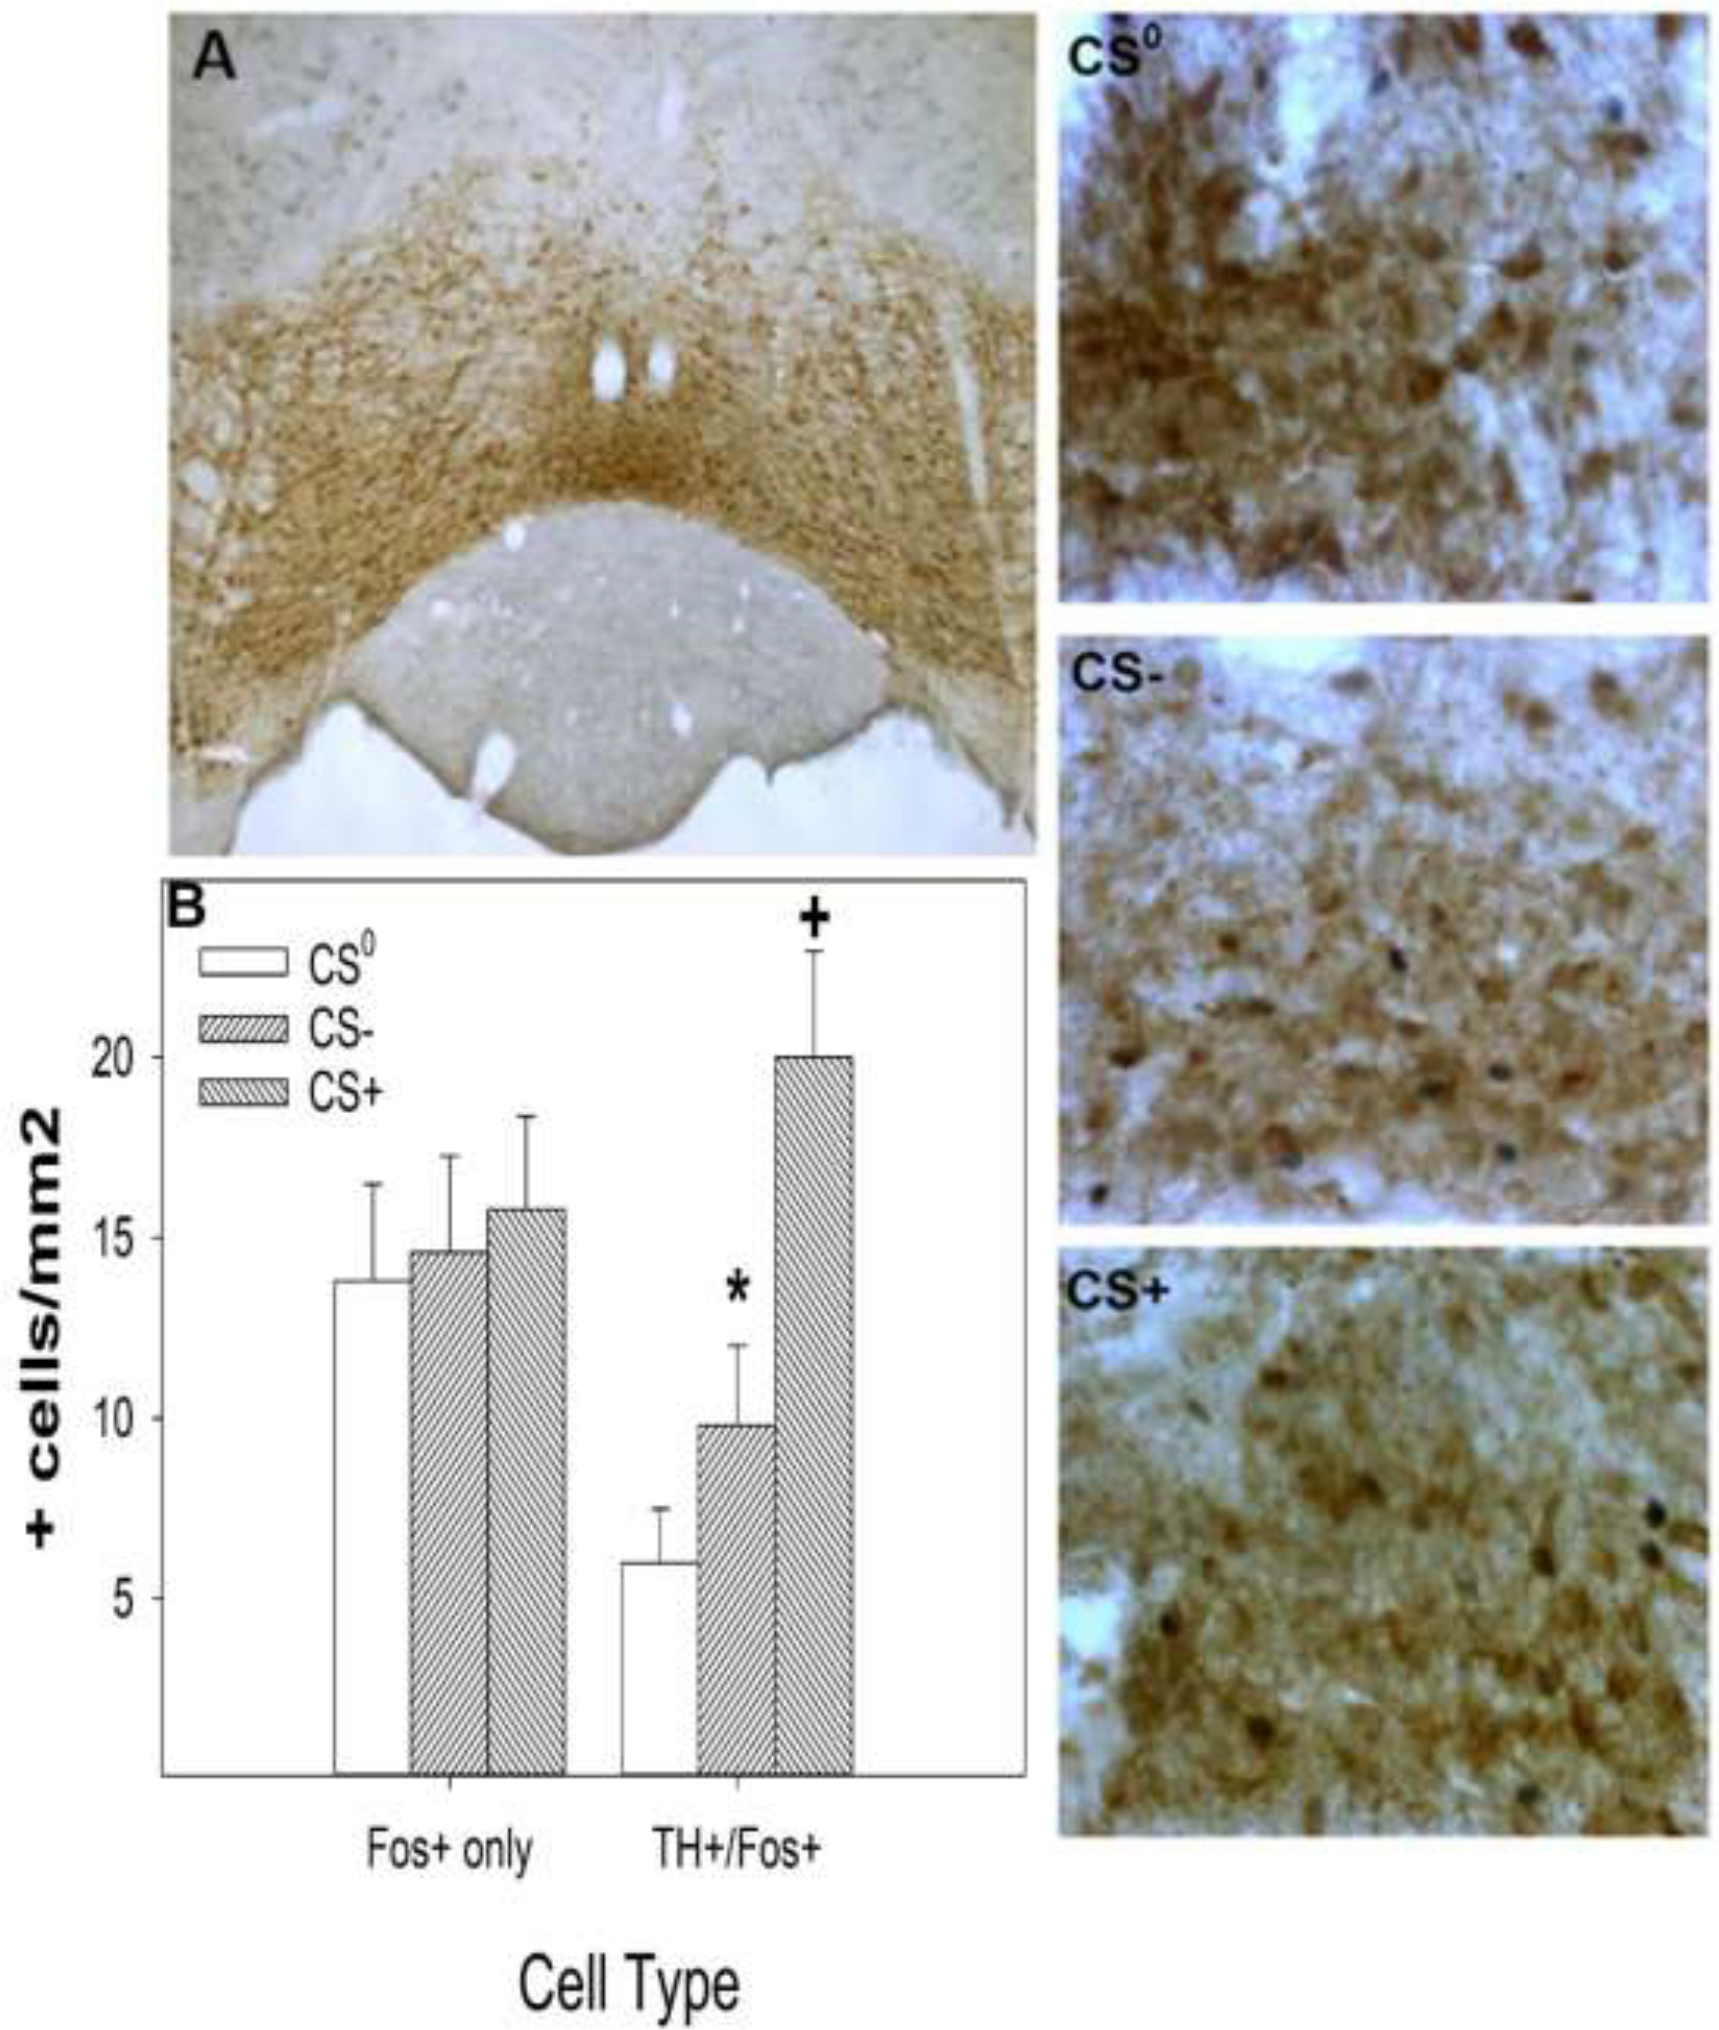
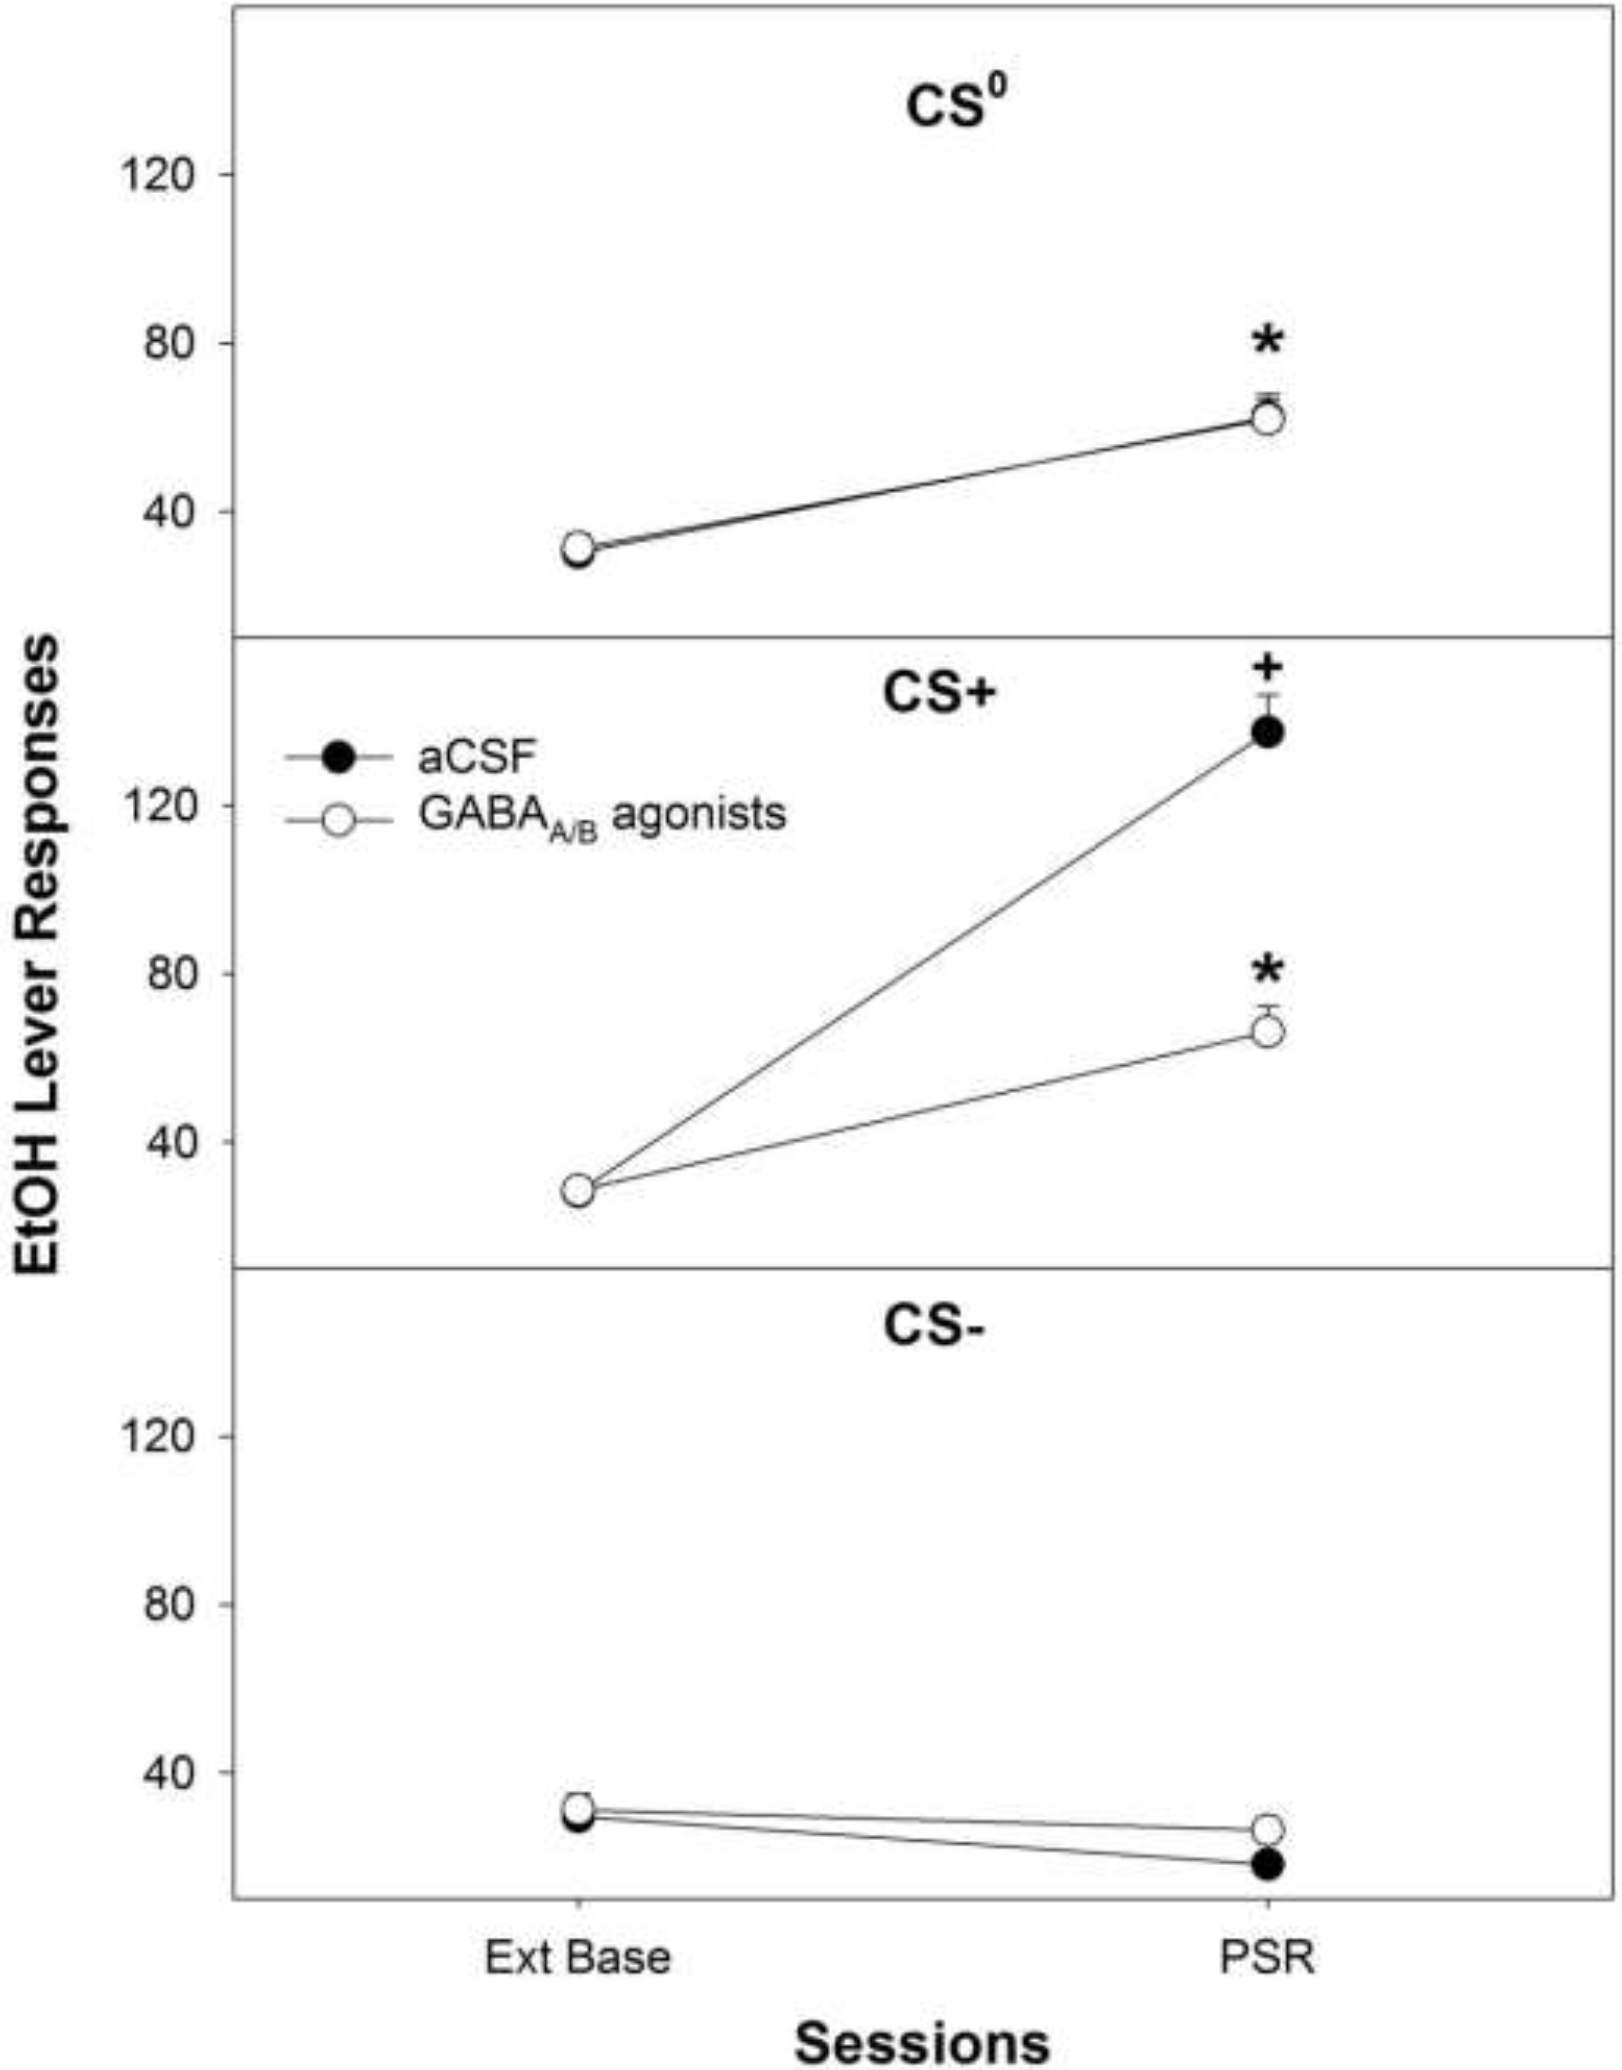
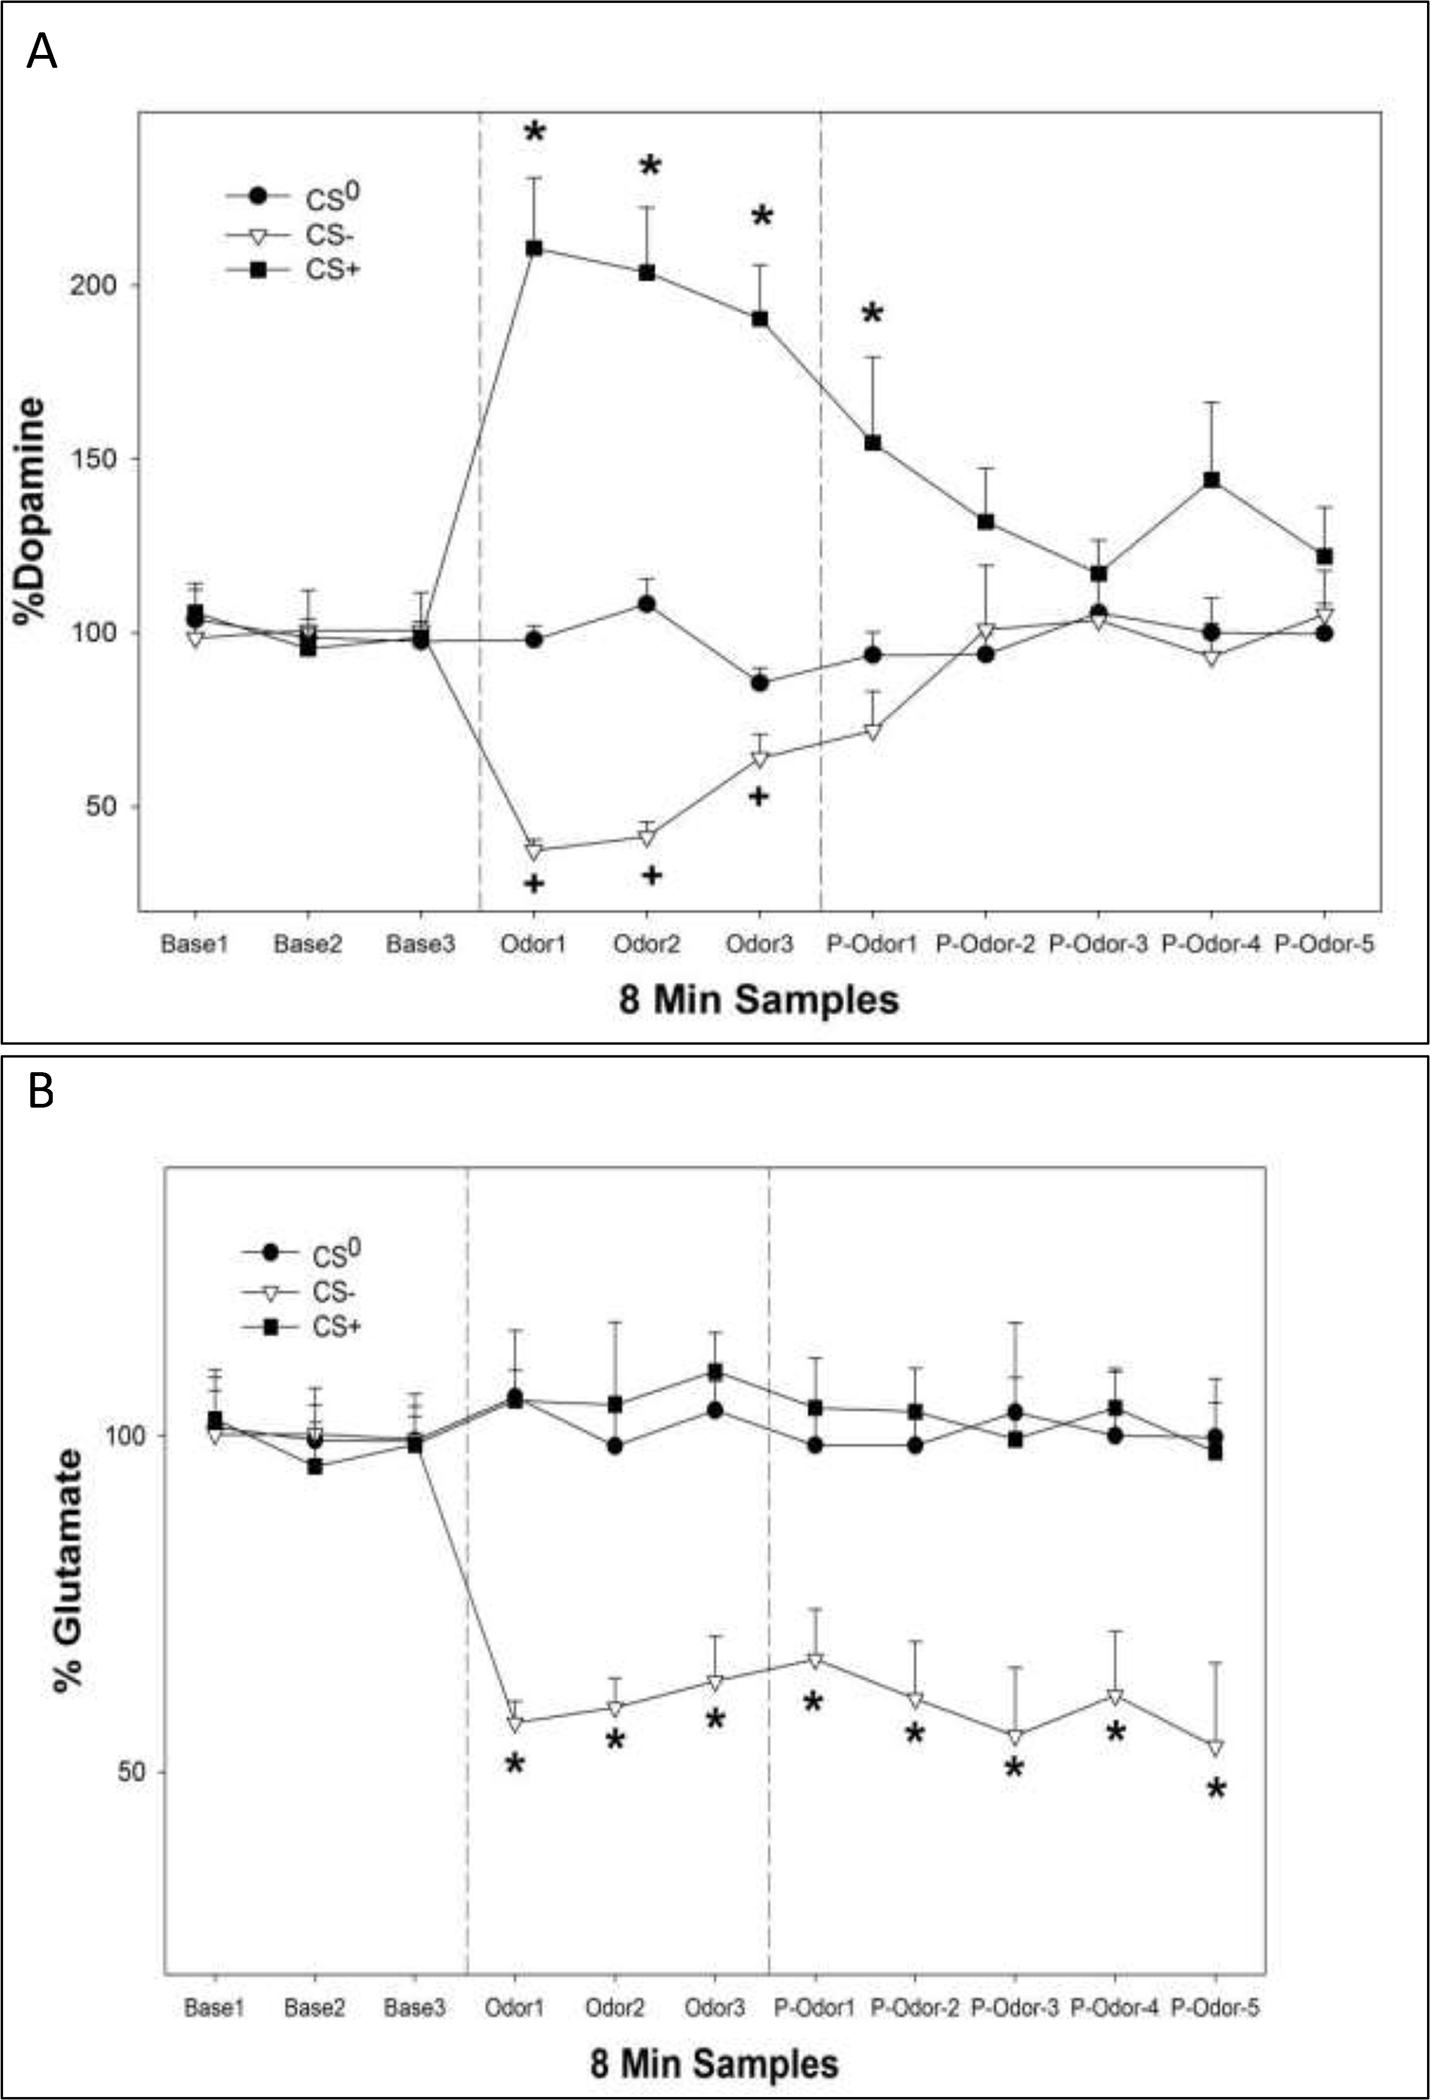
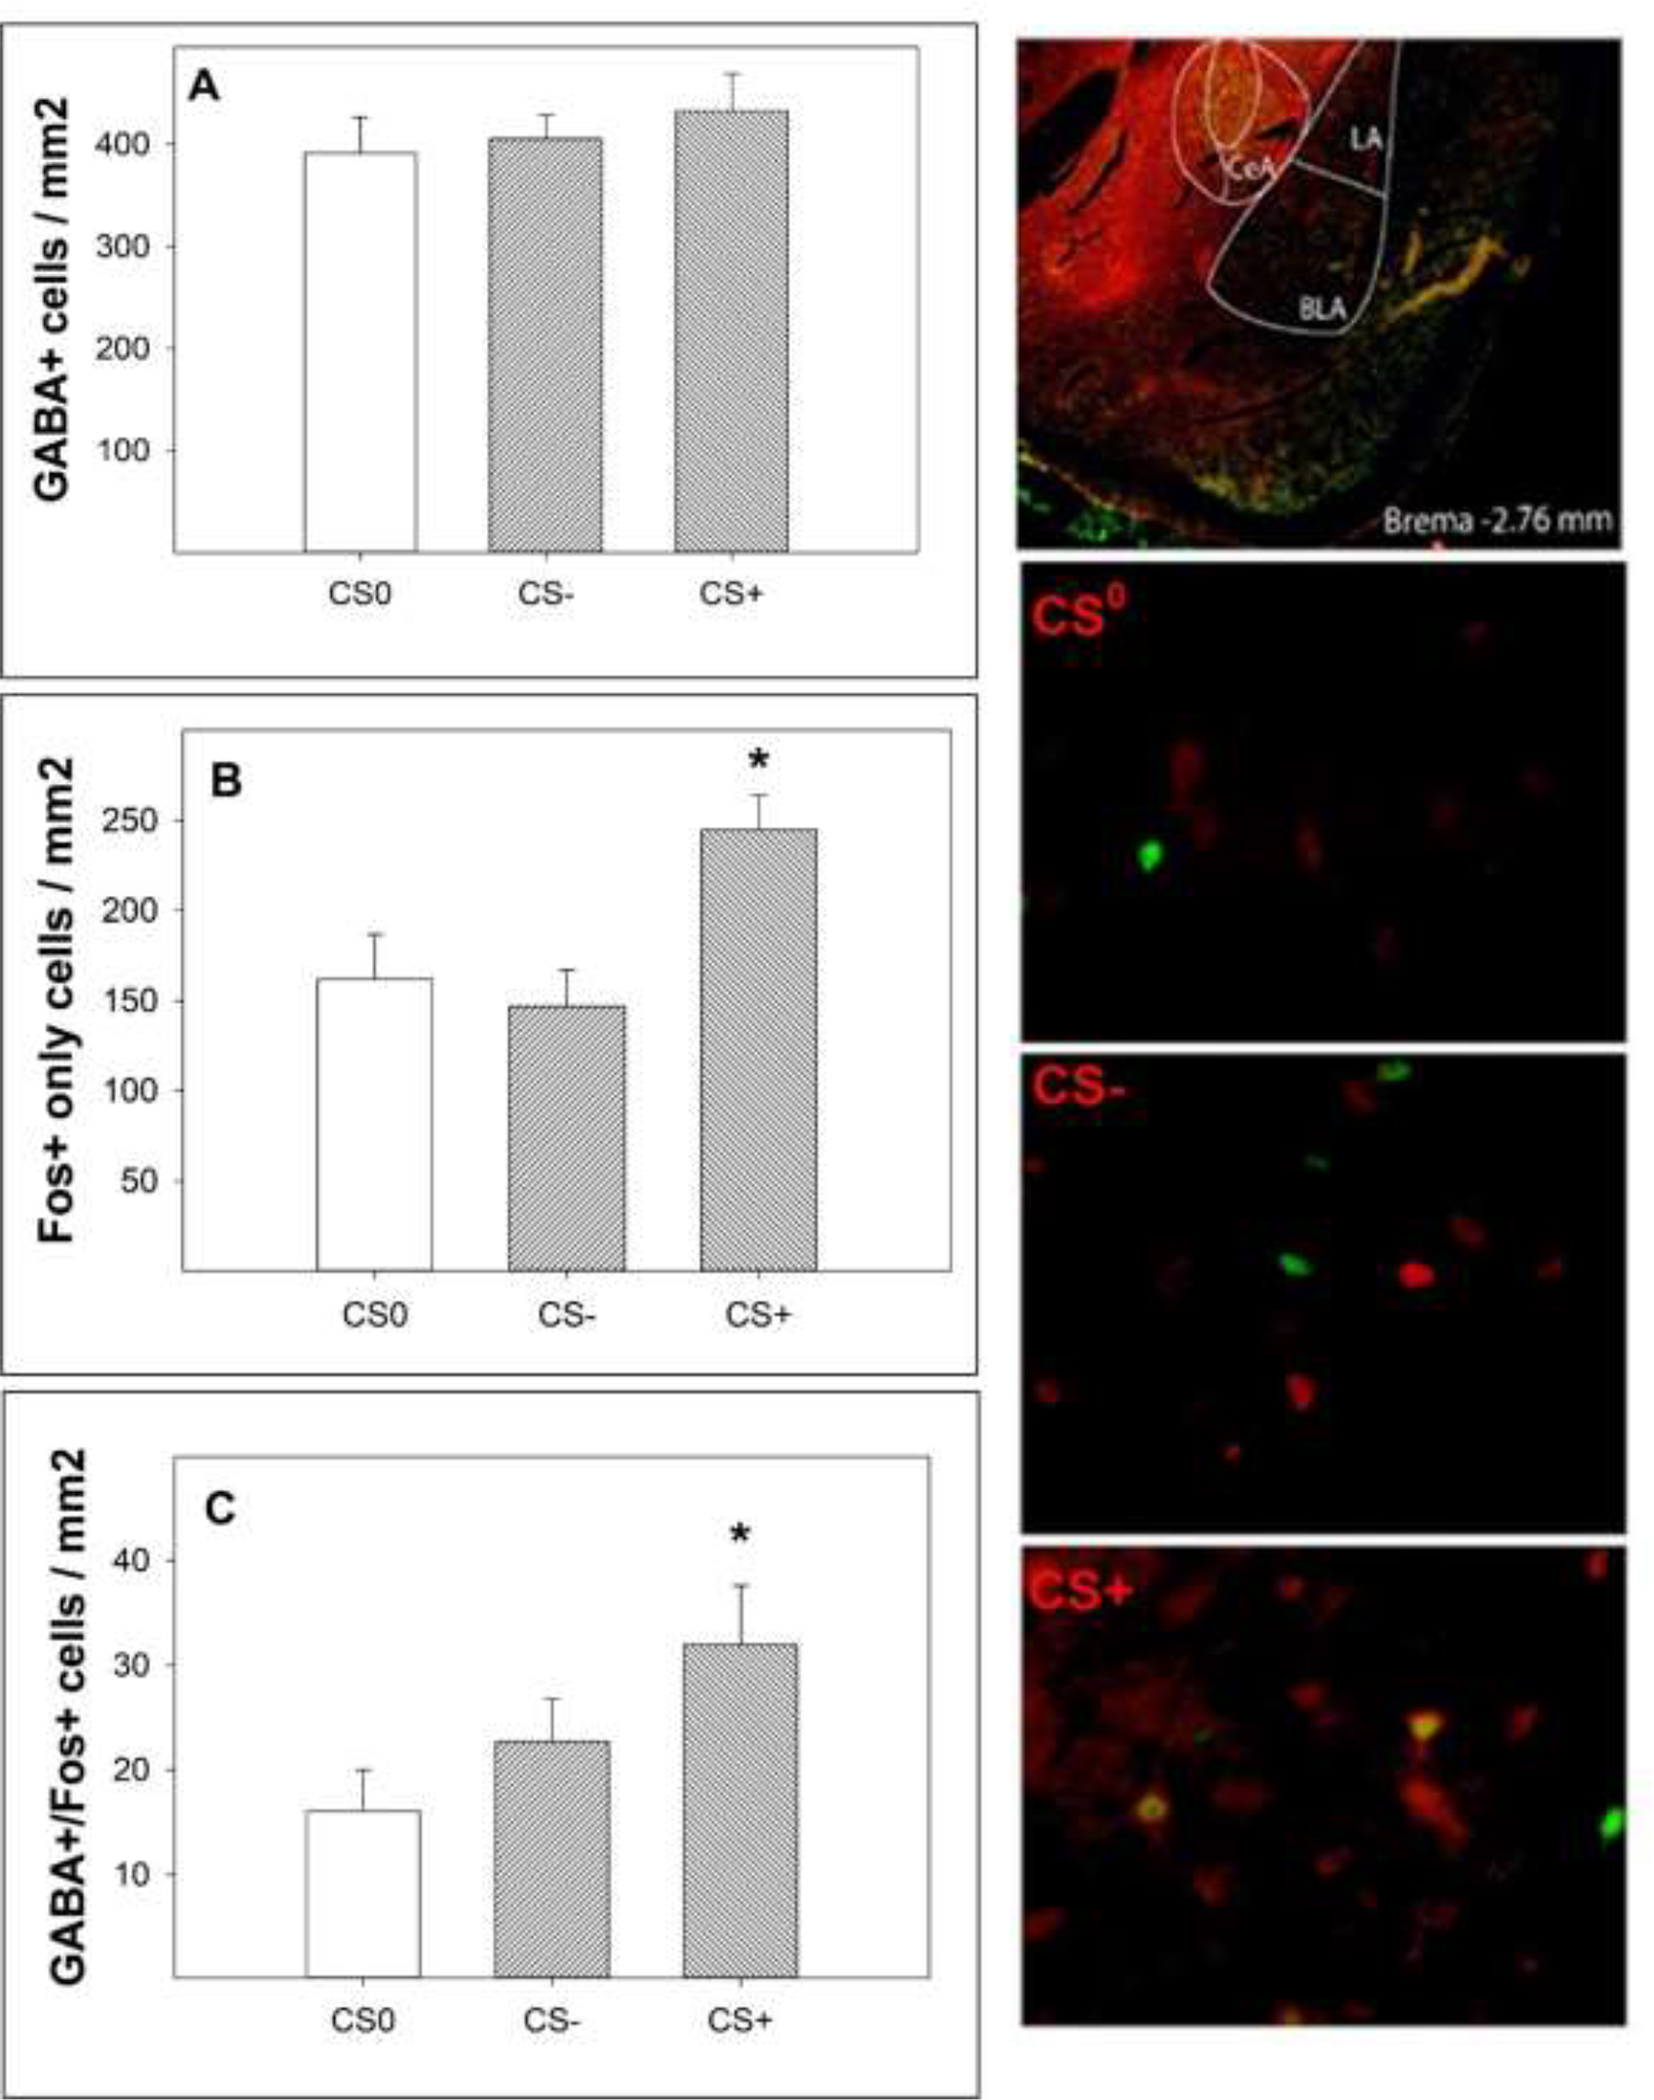
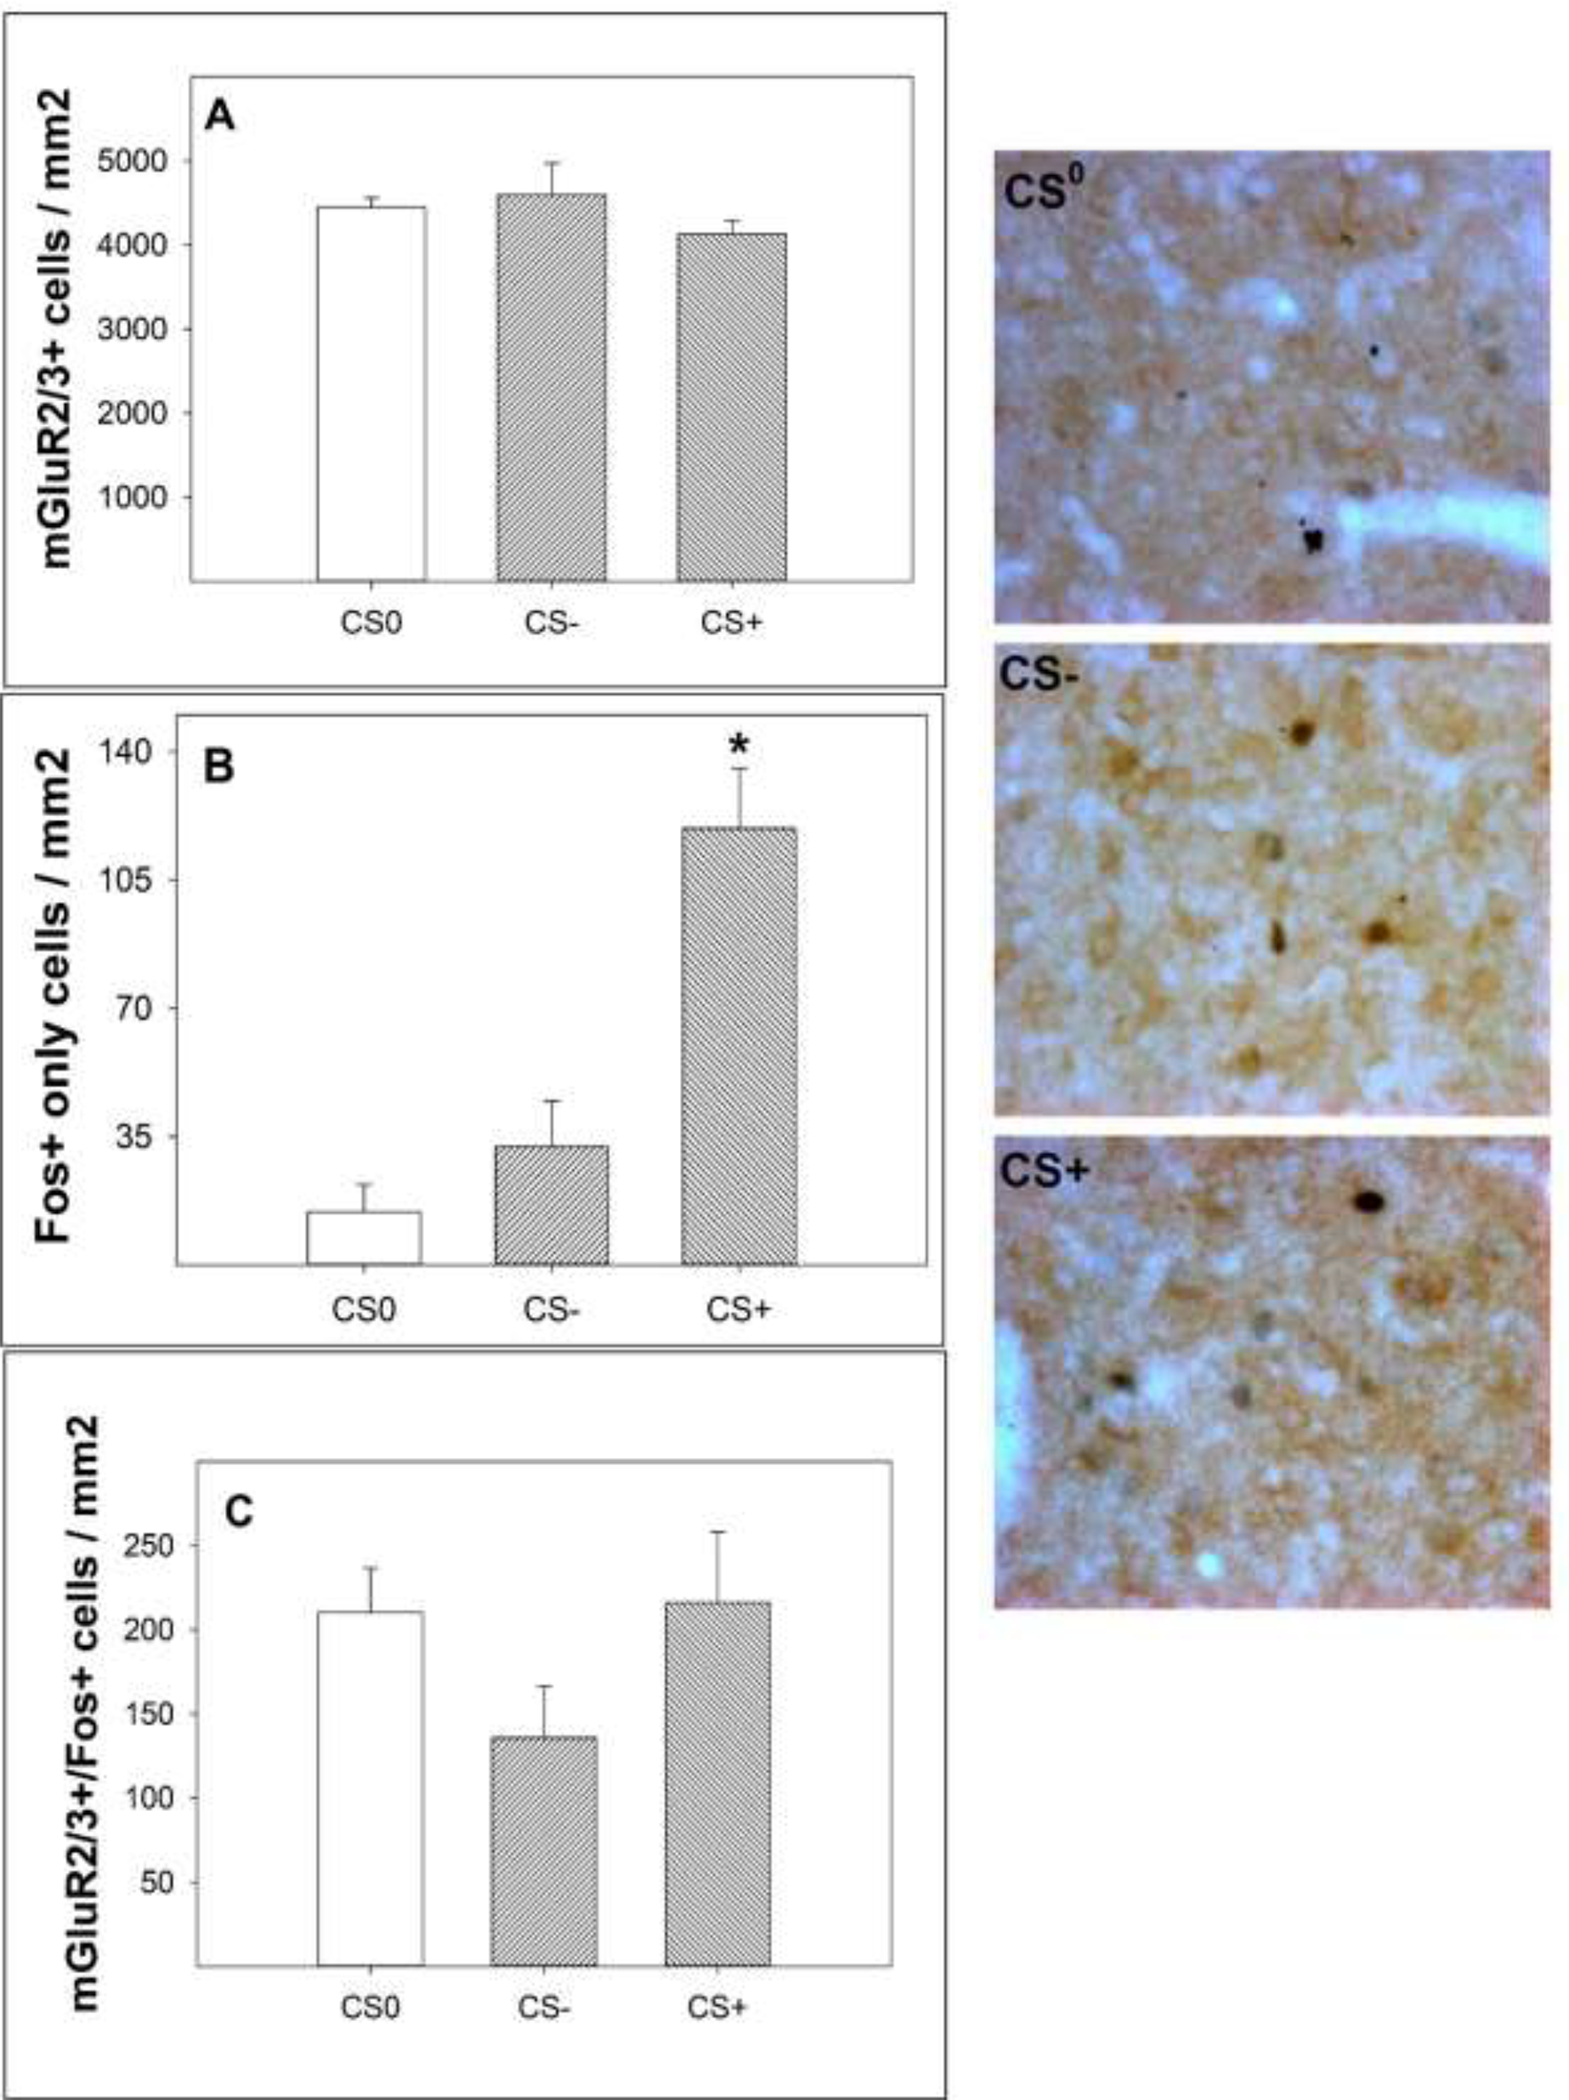
Cues associated with alcohol use can readily enhance self-reported cravings for alcohol, which increases the likelihood of reusing alcohol. Understanding the neuronal mechanisms involved in alcohol-seeking behavior is important for developing strategies to treat alcohol use disorder. In all experiments, adult female alcohol-preferring (P) rats were exposed to three conditioned odor cues; CS+ associated with EtOH self-administration, CS- associated with the absence of EtOH (extinction training), and a CS0, a neutral stimulus. The data indicated that presentation of an excitatory conditioned cue (CS+) can enhance EtOH- seeking while the CS- can inhibit EtOH-seeking under multiple test conditions. Presentation of the CS+ activates a subpopulation of dopamine neurons within the interfascicular nucleus of the posterior ventral tegmental area (posterior VTA) and basolateral amygdala (BLA). Pharmacological inactivation of the BLA with GABA agonists inhibits the ability of the CS+ to enhance EtOH-seeking but does not alter context-induced EtOH-seeking or the ability of the CS- to inhibit EtOH-seeking. Presentation of the conditioned odor cues in a non-drug-paired environment indicated that presentation of the CS+ increased dopamine levels in the BLA. In contrast, presentation of the CS- decreased both glutamate and dopamine levels in the BLA. Further analysis revealed that presentation of a CS+ EtOH-associated conditioned cue activates GABA interneurons but not glutamate projection neurons. Overall, the data indicate that excitatory and inhibitory conditioned cues can contrarily alter EtOH-seeking behaviors and that different neurocircuitries are mediating these distinct cues in critical brain regions. Pharmacotherapeutics for craving should inhibit the CS+ and enhance the CS- neurocircuits.
Keywords: Conditioned cues; Ethanol self-administration; Ethanol-seeking; Pavlovian Spontaneous Recovery.
Copyright © 2023 Elsevier B.V. All rights reserved.
Conflict of interest statement
Conflict of interest None of the authors has a conflict of interest associated with this research.
Figures
Similar articles
-
Conditioned stimuli affect ethanol-seeking by female alcohol-preferring (P) rats: the role of repeated-deprivations, cue-pretreatment, and cue-temporal intervals.Psychopharmacology (Berl). 2019 Sep;236(9):2835-2846. doi: 10.1007/s00213-019-05264-6. Epub 2019 May 16. Psychopharmacology (Berl). 2019. PMID: 31093721 Free PMC article.
-
Oral Conditioned Cues Can Enhance or Inhibit Ethanol (EtOH)-Seeking and EtOH-Relapse Drinking by Alcohol-Preferring (P) Rats.Alcohol Clin Exp Res. 2016 Apr;40(4):906-15. doi: 10.1111/acer.13027. Alcohol Clin Exp Res. 2016. PMID: 27038599 Free PMC article.
-
Unilateral inactivation of the basolateral amygdala attenuates context-induced renewal of Pavlovian-conditioned alcohol-seeking.Eur J Neurosci. 2013 Sep;38(5):2751-61. doi: 10.1111/ejn.12278. Epub 2013 Jun 12. Eur J Neurosci. 2013. PMID: 23758059 Free PMC article.
-
D1 receptors in the nucleus accumbens-shell, but not the core, are involved in mediating ethanol-seeking behavior of alcohol-preferring (P) rats.Neuroscience. 2015 Jun 4;295:243-51. doi: 10.1016/j.neuroscience.2015.03.030. Epub 2015 Mar 24. Neuroscience. 2015. PMID: 25813708 Free PMC article.
-
Blocking dopamine d1-like receptors attenuates context-induced renewal of pavlovian-conditioned alcohol-seeking in rats.Alcohol Clin Exp Res. 2014 Feb;38(2):418-27. doi: 10.1111/acer.12262. Epub 2013 Oct 24. Alcohol Clin Exp Res. 2014. PMID: 24164210 Free PMC article.
Cited by
-
Activating group II metabotropic glutamate receptors in the basolateral amygdala inhibits increases in reward seeking triggered by discriminative stimuli in rats.Int J Neuropsychopharmacol. 2025 Jun 6;28(6):pyaf030. doi: 10.1093/ijnp/pyaf030. Int J Neuropsychopharmacol. 2025. PMID: 40341317 Free PMC article.
-
A critical scientific evaluation of a purportedly negative data report - response to Seneviratne et al. 2022.Front Psychiatry. 2023 Oct 4;14:1271229. doi: 10.3389/fpsyt.2023.1271229. eCollection 2023. Front Psychiatry. 2023. PMID: 37860166 Free PMC article.
-
Triggered temptations: A new procedure to compare reward-seeking behaviour induced by discriminative and conditioned stimuli in rats.Psychopharmacology (Berl). 2025 Aug;242(8):1811-1832. doi: 10.1007/s00213-025-06764-4. Epub 2025 Feb 24. Psychopharmacology (Berl). 2025. PMID: 39994055
References
Publication types
MeSH terms
Substances
Grants and funding
LinkOut - more resources
Full Text Sources
